

Abstract
Autophagy is important for cellular homeostasis and can serve as innate immunity to remove intracellular pathogens. Here we demonstrate by a battery of morphological and biochemical assays that HCV induces the accumulation of autophagosomes in cells without enhancing autophagic protein degradation. This induction of autophagosomes depended on the unfolded protein response (UPR), as the suppression of UPR signaling pathways suppressed HCV-induced lipidation of the LC3 protein, a necessary step for the formation of autophagosomes. The suppression of UPR or the suppression of expression of LC3 or Atg7, a protein that mediates LC3 lipidation, suppressed HCV replication, indicating a positive role of UPR and the incomplete autophagic response in HCV replication. Conclusion: Our studies delineate the molecular pathway by which HCV induces autophagic vacuoles and also demonstrate the perturbation of the autophagic response by HCV. These unexpected effects of HCV on the host cell likely play an important role in HCV pathogenesis.
Keywords: autophagy, autophagosomes, ER stress, HCV replication, siRNA knockdown
Introductory Statement
Autophagy is important for removing long-lived proteins and damaged organelles in cells. During autophagy, double-membrane vesicles form to sequester part of the cytoplasm. These double-membrane vesicles, also known as autophagosomes, subsequently fuse with lysosomes to form autolysosomes for the degradation of their contents for recycling (1). Many genes that are important for autophagy have been identified. Among them is LC3 whose covalent linkage to phosphatidylethanolamine by the ubiquitin-activating enzyme E1-like protein Atg7 is necessary for the formation of autophagosomes (2).
HCV is a positive-stranded RNA virus with a genome size of 9.6 Kb. Infection by this virus can lead to liver cirrhosis and hepatocellular carcinoma. Based on their genetic relatedness, different HCV isolates have been grouped into six major genotypes and many more subtypes. The HCV genome codes for a polyprotein, which is proteolytically cleaved to generate the mature protein products (for a review, see (3)).
Recently, a cell culture system for efficient HCV propagation using the JFH1 strain, which belongs to HCV genotype 2a, has been developed (4–7). In this system, the HCV JFH1 RNA or its derivative was transfected into human hepatoma cells to direct the replication and release of infectious HCV particles, which could then initiate the next round of infection. In this report, we use this HCV RNA transfection/infection system to study HCV-host interactions. Our results indicate that HCV induces the accumulation of autophagosomes by activating UPR. However, HCV does not enhance autophagic protein degradation. Importantly, this induction of autophagosomes enhanced HCV replication. The persistent induction of the UPR and the perturbation of the autophagic response likely play an important role in HCV pathogenesis.
Experimental Procedures
Cell cultures, DNA plasmids and siRNAs
Huh7.5 cells were maintained in DMEM supplemented with 10% FBS and 1% nonessential amino acids (the “growth medium”). Huh7.5 cells that stably expressed GFP-LC3 were produce by transfecting Huh7.5 cells with pEGFP-LC3 (8) followed by G418 selection. The plasmids pJFH1 and pJFH1/GND used had been described before (9). Stable Huh7 cells that contained the HCV Con1 subgenomic RNA replicon has also been described (10). The two PERK siRNAs (11) and LC3 siRNA (12) were synthesized at the USC Microchemical Core Facility. IRE1α, ATF6 and Atg7 siRNAs were purchased from Qiagen (Germantown, MD) and the negative control siRNA was purchased from Invitrogen (Carlsbad, CA). Cells were transfected with siRNA using Lipofectamine 2000 (Invitrogen, Carlsbad, CA) per the manufacturer’s instructions. The siRNA sequences are shown in Supplementary Table 1.
In vitro transcription of HCV RNA and Electroporation of Huh7.5 cells
Plasmids pJFH-1 and pJFH-1/GND were linearized with the restriction enzyme Xba1 for RNA synthesis using the MEGA-script kit (Ambion, Foster City, CA). Huh7.5 cells were then electroporated with the HCV RNA. Unless specifically indicated, all the analyses were conducted on cells between 2 to 5 days post-electroporation.
Confocal microscopy and LysoTracker-red staining
Cells were fixed with 4% formaldehyde and incubated with the rabbit anti-HCV core antibody and then with the rhodamine-conjugated goat anti-rabbit antibody for confocal microscopy. For LysoTracker-red staining, cells were treated with 50 nM LysoTracker Red DND-99 (Invitrogen, Carlsbad, CA) at 37°C for 3 hours. Depending on the experiments, cells might be nutrient starved in HBSS or treated with 2.5 mM DTT in the growth media for the induction of ER stress at 37°C for an additional 20 minutes in the presence of LysoTracker-red. The colocalization coefficient, which measures the fraction of GFP pixels that are also positive for LysoTracker-red, was performed on randomly selected GFP-positive cell images (n>20) using the Zeiss LSM 510 imaging software. A colocalization coefficient of 1 means complete colocalization whereas 0 means no colocalization.
Long-lived protein degradation assay
Cells were labeled with L-[4,5-3H] leucine (50 μCi/ml) for 24 hours in growth media, rinsed with DMEM and further incubated in growth media for 24 hours. Cells were then rinsed with DMEM or, for nutrient starvation, with HBSS, and treated with or without 200 nM BAF in DMEM or HBSS at 37ºC for one or four hours. Cell lysates and media were collected at the end of treatment, precipitated with TCA and analyzed by scintillation counting. The protein degradation rate was determined by the following equation: (TCA soluble counts in media) ÷ (total counts in media and cell lysates) × 100%. Cells treated with Tg were analyzed using the same procedures, with the exception that Tg was added into the growth media 12 hours after the removal of the 3H-leucine.
Quantitative reverse transcription polymerase chain reaction
Total cellular RNA was analyzed by qRT-PCR using the TaqMan Gold RT-PCR Kit (Applied Biosystems, Foster City, CA) following the manufacturer’s instructions. HCV JFH1 primers 5′-TCTGCGGAACCGGTGAGTA-3′ (sense) and 5′-TCAGGCAGTACCACAAGGC-3′ (antisense) and the probe 5′-CACTCTATGCCCGGCCATTTGG-3′ were used for the qRT-PCR. Control GAPDH primers and its probe were purchased from Applied Biosystems (Foster City, CA).
Analysis of XBP1 mRNA splicing by IRE1
Total cellular RNA was reverse transcribed and amplified using the sense primer (5′-CCTTGTAGTTGAGAACCAGG -3′) and antisense primer (5′-GGGGCTTGGTATATATGTGG -3′). The PCR products were further digested with the restriction enzyme Pst1. For internal control, the cDNA of the β-actin mRNA was also amplified using the sense primer (5′-ATCTGGCACCACACCTTCTACAATGAG -3′) and the antisense primer (5′-CGTCATACTCCTGCTTGCTGATCC -3′).
Results
Induction of autophagosomes by HCV
We transfected he HCV JFH1 RNA or its replication defective GND mutant RNA into Huh7.5 cells to study HCV-host interactions. The GND mutant RNA served as a negative control, as it cannot replicate and is rapidly degraded in transfected cells. By performing electron microscopy, we found that HCV JFH1 induced the accumulation of membrane vesicles with the morphology of autophagosomes (Supplementary Fig. 1A), which were rarely observed in GND RNA transfected cells (Supplementary Fig. 1B). To investigate whether HCV could indeed induce the accumulation of autophagosomes, we established stable Huh7.5 cells that expressed the GFP-LC3 fusion protein. As shown in Fig. 1, cells transfected by the GND RNA displayed no detectable HCV core protein signal and in general a weak and diffused cytoplasmic signal of the GFP-LC3 fusion protein (panel a). In contrast, most of the cells transfected by the JFH1 RNA stained strongly for the HCV core protein with most of them (approximately 80% at day 5 post-transfection) also displaying bright and punctuate GFP-LC3 signal (panel b). At a higher magnification, many of the core protein signals were often found to be circular, which is consistent with previous reports that the core protein is associated with lipid droplets. Importantly, the GFP-LC3 signals were also often found to be circular, consistent with their localization on autophagosomal membranes (panel c). Circular GFP-LC3 signals were also observed when JFH1 cells were stained for the HCV NS5A protein (Supplementary Fig. 2).
Figure 1. Induction of autophagic vacuoles by HCV.
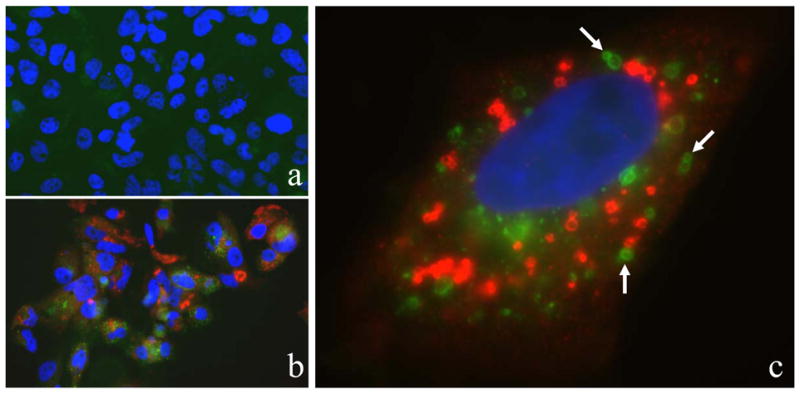
Stable GFP-LC3 cells were transfected by the HCV GND RNA (panel a) or the HCV JFH1 RNA (panels b and c). Green, the GFP-LC3 signal; red, the HCV core protein; blue, DAPI staining of nuclei. Cells were analyzed five days post-transfection. Arrows in panel c highlight the circular GFP-LC3 signals.
The above observations indicated that HCV could induce the accumulation of autophagosomes. This possibility was further confirmed by Western-blot analysis of LC3, which is converted from the cytosolic form (LC3-I) to the lipidated, autophagosome-associated form (LC3-II) during autophagy. As shown in Fig. 2A, although little LC3-II could be detected in mock transfected cells or cells transfected with the GND mutant RNA, a significant amount of LC3-II was detected in cells transfected with the JFH1 RNA. The ability of HCV to induce the lipidation of LC3 is not limited to the HCV JFH1 isolate, as shown in Fig. 2B, a similar result was observed in Huh7 cells harboring a high replication level of the subgenomic HCV RNA replicon derived from the genotype 1b Con-1 virus (10).
Figure 2. Induction of LC3 lipidation by HCV.
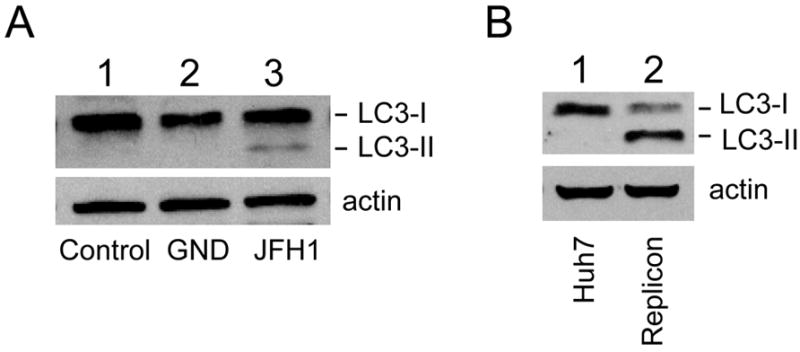
(A) Huh7.5 cells were mock-transfected (lane 1), transfected with the HCV GND RNA (lane 2) or with the HCV JFH1 RNA (lane 3) and lysed five days post-transfection for Western-blot analysis using the rabbit anti-LC3 antibody (MBL International, Woburn, MA) (top panel). Actin (bottom panel) was also analyzed to serve as a loading control. (B) Control Huh7 cells (lane 1) or stable Huh7 cells containing the HCV Con-1 subgenomic RNA replicon (lane 2) were lysed and analyzed by Western-blotting for LC3 (top panel) and actin (bottom panel).
Lack of enhancement of autophagy by HCV
The results shown in Fig. 1 and 2 indicated that HCV could induce the accumulation of autophagosomes in cells. To investigate whether HCV could also enhance autophagic protein degradation, we analyzed the degradation rate of long-lived proteins in cells. Huh7.5 cells were metabolically labeled with 3H-leucine for twenty-four hours followed by the chase of another twenty-four hours to allow the degradation of labeled, short-lived proteins. Cells were then rinsed and incubated in fresh media in the presence and absence of bafilomycin A1 (BAF), a vacuolar ATPase inhibitor that suppresses the fusion between autophagosomes and lysosomes (13). The protein degradation rate was determined by measuring the amount of TCA-soluble radiolabel released into the medium per hour. The overall protein degradation rates and those sensitive to BAF and hence mediated by autophagy are shown in Fig. 3A and 3B, respectively. As shown in the figures, nutrient starvation, which induces autophagy and served as the positive control, increased both overall and BAF-sensitive protein degradation rates. Interestingly, HCV JFH1 did not increase, but rather slightly reduced, overall and BAF-sensitive protein degradation rates. These results suggested that, although HCV JFH1 was able to enhance the accumulation of autophagosomes, it did not enhance autophagic protein degradation. To further confirm this observation, we analyzed the p62/SQSTM1 protein level in cells. The p62/SQSTM1 protein binds to LC3 and is degraded by autophagy (14). As shown in Fig. 3C, there was a continuous increase, albeit small, of the p62/SQSTM1 protein level in cells during the first 24 hours after the transfection of the HCV RNA. In contrast, nutrient starvation reduced the p62 level by approximately 65%. These results again indicated that HCV JFH1 did not enhance autophagic protein degradation.
Figure 3. Lack of enhancement of autophagic degradation by HCV.
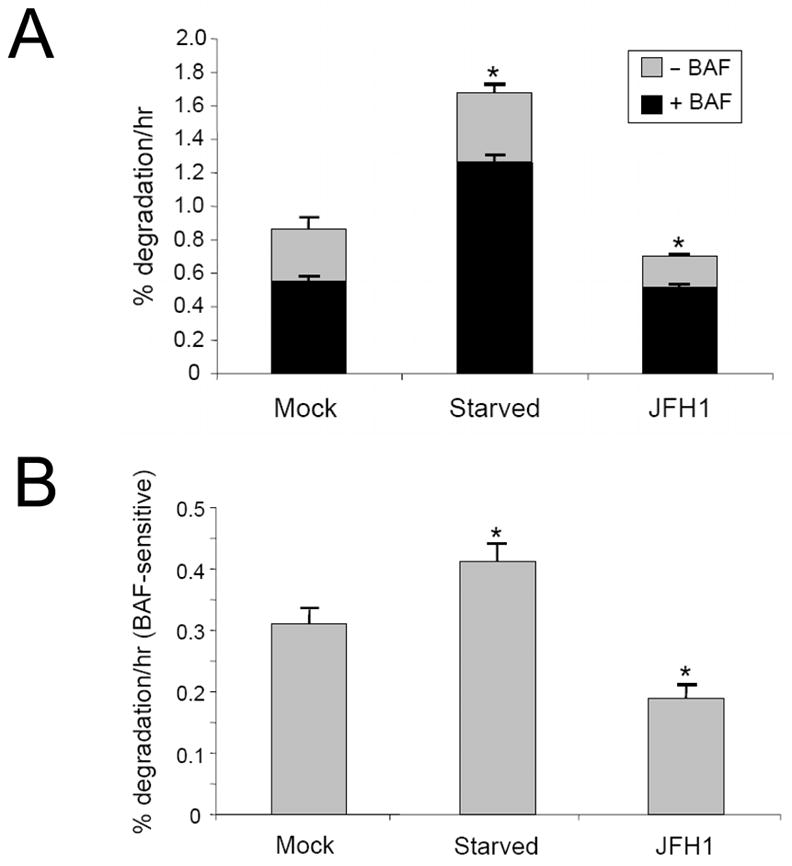
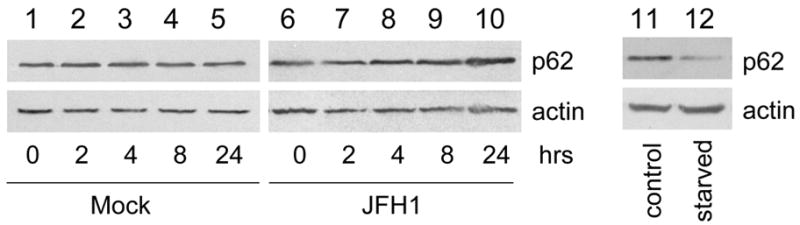
(A) and (B) The long-lived protein degradation assay. Mock, mock-transfected cells; Starved, nutrient-starved cells; JFH1, HCV JFH1 RNA transfected cells. The overall protein degradation rates in the absence (grey bar) or in the presence (black bar) of BAF are shown in (A) and the BAF-sensitive protein degradation rates are highlighted in (B). Asterisks indicate statistical significance (p<0.05) when nutrient starved cells or HCV JFH1 cells were compared against mock-transfected cells by Student’s t-test. (C) Western-blot analysis of p62/SQSTM1. Mock-transfected (lanes 1–5) or HCV JFH1 RNA transfected (lanes 6–10) cells were lysed at 0, 2, 4, 8 and 24 hours post-transfection for p62/SQSTM1 analysis using the anti-p62 antibody (American Research Products, Belmont, MA). Naïve Huh7.5 cells without (lane 11) or with nutrient starvation (lane 12) for twenty minutes were also analyzed. Actin was also analyzed to serve as a loading control. The p62 level in lane 12 was approximately 35% of that in lane 11 after normalization against actin.
To further investigate why the accumulation of autophagosomes induced by HCV did not lead to a higher protein degradation rate, we analyzed the level of autolysosomes in cells by staining stable GFP-LC3 cells with LysoTracker-red that stains for acidic organelles such as lysosomes. GFP-LC3 cells that were starved for nutrients were used as a positive control. Bright GFP puncta (i.e., autophagic vacuoles) were detected in a large fraction of cells that were nutrient-starved (Fig. 4). Nearly half (colocalization coefficient 0.43) of these GFP puncta were also positive for LysoTracker-red. In contrast, when HCV cells were also analyzed, the fraction of GFP-LC3 puncta that was also positive for LysoTracker-red was significantly lower with a colocalization coefficient of only 0.14 (p<0.005). These results, together with the low autophagic protein degradation rate of HCV cells, indicated that the fusion between autophagosomes and lysosomes was inefficient in HCV cells.
Figure 4. Inefficient maturation of autophagic vacuoles induced by HCV.

Cells were nutrient starved (top panels) or transfected with the HCV GND RNA (middle panels) or JFH1 RNA (bottom panels). The Merge panels combine LysoTracker (red) and GFP-LC3 (green) signals, whereas the Merge+Core panels combine LysoTracker (red), GFP-LC3, the HCV core protein staining (blue) and phase-contrast micrograph. The HCV core protein was stained with the rabbit anti-core primary antibody and the Alexa Fluor 405-conjugated goat anti-rabbit secondary antibody (Invitrogen, Carlsbad, CA).
Induction of ER stress by HCV
Several HCV gene products, as well as the subgenomic RNA replicon, have been shown to induce ER stress, although sometimes with conflicting results (15–18). Since ER stress has been shown to induce autophagy (19, 20), we decided to investigate whether HCV could induce the accumulation of autophagosomes via the induction of ER stress. We first examined whether HCV could induce ER stress during productive replication. ER stress, which is caused by the accumulation of misfolded proteins in the ER, can activate the UPR via three different sensors: PERK, ATF6 and IRE1 (21). As shown in Fig. 5A, HCV induced the phosphorylation of PERK and its downstream effector eIF2α, which in turn led to the increased expression of ATF4, CHOP/GADD153 and the protein chaperon GRP78. We then examined the effect of HCV on IRE1, which, upon its activation, induces the splicing of the xbp1 mRNA to stimulate the expression of UPR target genes (21). Splicing of xbp1 mRNA was assayed by RT-PCR: the unspliced RNA generates a 442-bp product that can be digested by the restriction enzyme Pst1, whereas the spliced RNA generates a 416-bp Pst1-resistant product (22). As shown in Fig. 5B, the spliced xbp1 RNA was easily detectable in cells transfected with the JFH1 RNA but not in cells transfected with the GND RNA or in untransfected cells. As a positive control, we treated naïve Huh7.5 cells with DTT, a chemical that causes protein misfolding and ER stress (22). As expected, this treatment induced the splicing of xbp1 mRNA in Huh7.5 cells (Fig. 5B).
Figure 5. Activation of the unfolded protein response by HCV JFH1.
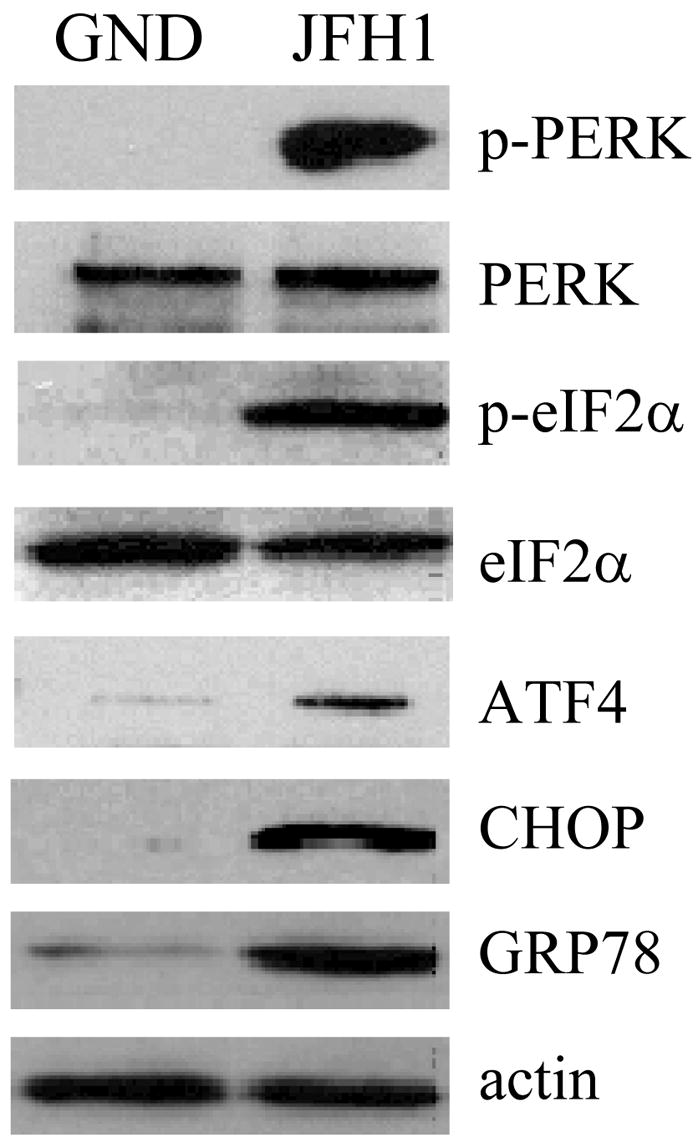

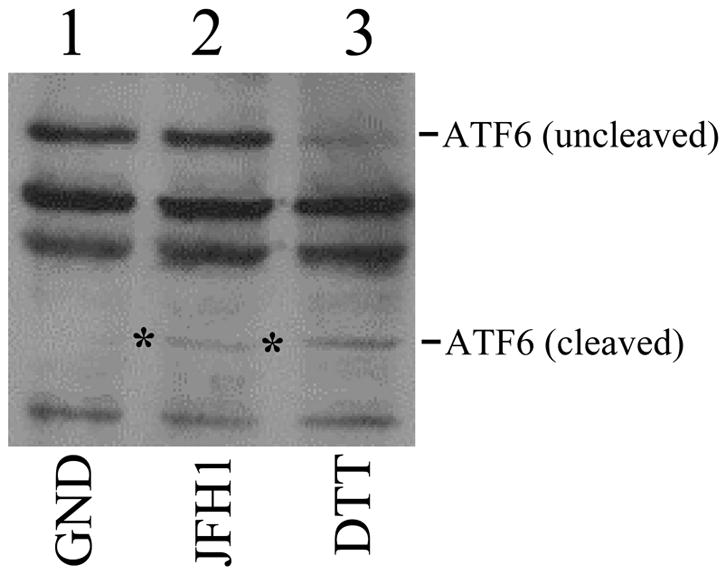
(A) Activation of the PERK signaling pathway. Huh7.5 cells electroporated with JFH1 or JFH1/GND RNA were lysed three days post-transfection for Western-blot analysis of the proteins indicated. p-PERK and p-eIF2α indicated the phosphorylated PERK and eIF2α, respectively. (B) Activation of the IRE1-XBP1 signaling pathway. Total cellular RNA was analyzed for XBP1 RNA by semi-quantitative RT-PCR. Upper panel, undigested RT-PCR products; lower panel, Pst1-digested PCR products. XPB1 (U) and (S) represent DNA fragments derived from unspliced and spliced XBP1 RNA, respectively. XBP1 (H) represents the hybrid DNA derived from XBP1 (U) and XBP1 (S). The β-actin RNA was also analyzed to serve as an internal control. Digestion of XBP1 (U) by Pst1 would generate the 295-bp and the 147-bp DNA fragments. Lane 1, JFH1/GND RNA transfected cells; lane 2, JFH1 RNA transfected cells; lane 3, naïve Huh7.5 cells without DTT treatment to serve as a negative control; and lane 4, Huh7.5 cells with DTT treatment to serve as the positive control. (C)Activation of ATF6. Huh7.5 cells transfected with JFH1/GND (lane 1) or JFH1 (lane 2) RNA or treated with DTT (lane 3) were lysed for ATF6 analysis by Western-blot. The locations of uncleaved and cleaved ATF6 are indicated. Asterisks highlight the cleaved ATF6 protein band in JFH1 cells.
We also investigated the effect of HCV on the ATF6 signaling pathway. ATF6 is cleaved from the 90-kDa inactive form to a 50-kDa active fragment upon ER stress induction. As shown in Fig. 5C, a low level of activated ATF6 was detected in cells that were transfected with the HCV JFH1 RNA but not in cells that were transfected with the replication defective GND RNA. Huh7.5 cells treated with DTT served as the positive control, as they showed efficient ATF6 cleavage (Fig. 5C).
Induction of autophagosomes by HCV via ER stress
The results shown in Fig. 5 indicated that HCV could induce ER stress to activate all three arms of the UPR. Next, we examined whether ER stress could induce autophagy in Huh7.5 cells. Treatment of cells with the ER-stress inducer Tg or DTT induced the formation of LC3-II (Fig. 6A), the colocalization of GFP-LC3 puncta with LysoTracker-red (Fig. 6B), and an increase of overall and BAF-sensitive protein degradation rate (Fig. 6C). These observations indicated that ER stress could induce autophagy in Huh7.5 cells. To test whether HCV JFH1 indeed induced the accumulation of autophagosomes via the induction of ER stress, we treated HCV JFH1 cells with siRNAs directed against PERK, IRE1 and ATF6. As shown in Fig. 7A, two different siRNAs directed against PERK reduced significantly the PERK protein level in HCV JFH1 cells. In contrast, a control siRNA had no effect on the total PERK protein level. The suppression of PERK function by the siRNAs was confirmed by the observation that the phosphorylation of eIF2α, a substrate of PERK, was reduced by PERK siRNAs (Fig. 7A). Neither the control siRNA nor the PERK-specific siRNAs affected the total eIF2α protein level in HCV JFH1 cells. We then examined whether the suppression of PERK expression by siRNA would affect the lipidation of LC3 by HCV. As shown in Fig. 7A, while the LC3-II level was not affected by the control siRNA, it was significantly reduced by the PERK siRNAs. These results indicated a critical role of PERK in the autophagic response induced by HCV.
Figure 6. Induction of autophagy by ER stress in Huh7.5 cells.


(A) Induction of LC3 lipidation by ER-stress inducers Tg and DTT. Huh7.5 cells without treatment (lane 1), with 300 nM Tg treatment for 16 hours (lane 2), or with 5 mM DTT treatment for 30 minutes (lane 3) were analyzed by Western-blotting for LC3 and actin. (B) Confocal microscopy of autophagic vacuoles. Stable Huh7.5 cells that expressed GFP-LC3 were stained with LysoTracker-red for three hours and further treated with DTT for twenty minutes. (C) Long-lived protein degradation assay. Cells with or without Tg treatment for 16 hours were analyzed for protein degradation as described in the Fig. 3 legend. The overall protein degradation rates in the absence (grey bar) or in the presence (black bar) of BAF are shown in the top panel and the BAF-sensitive protein degradation rates are highlighted in the bottom panel.
Figure 7. Induction of LC3-lipidation by HCV via the unfolded protein response.
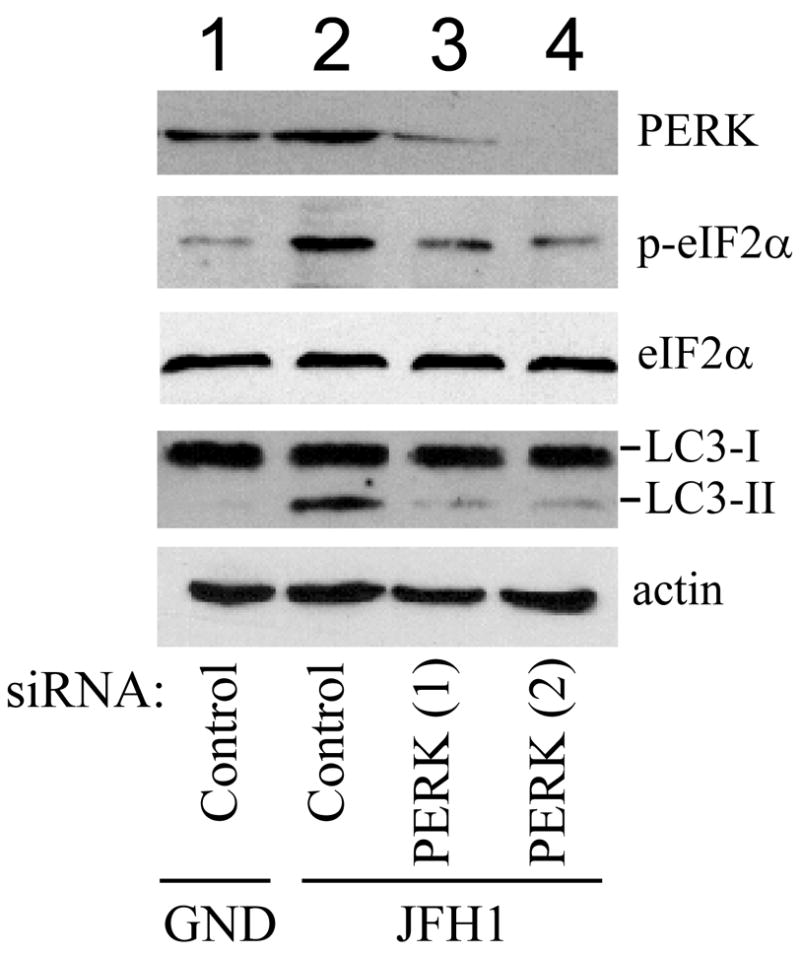
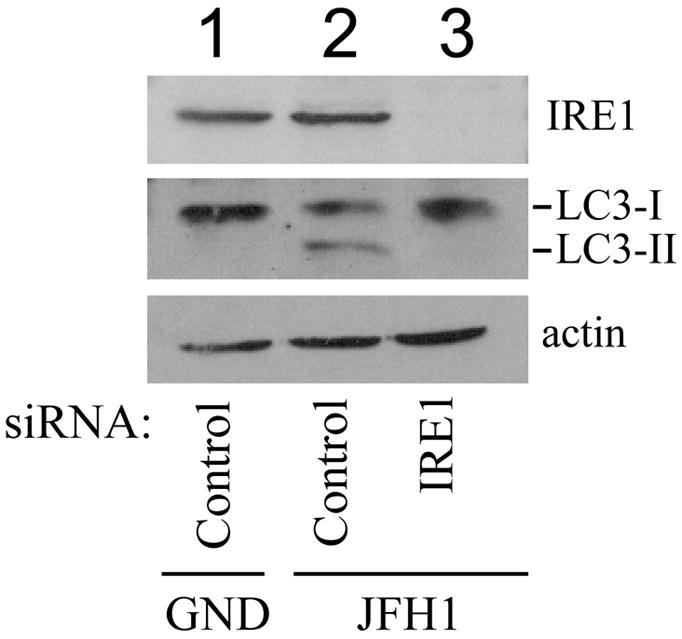
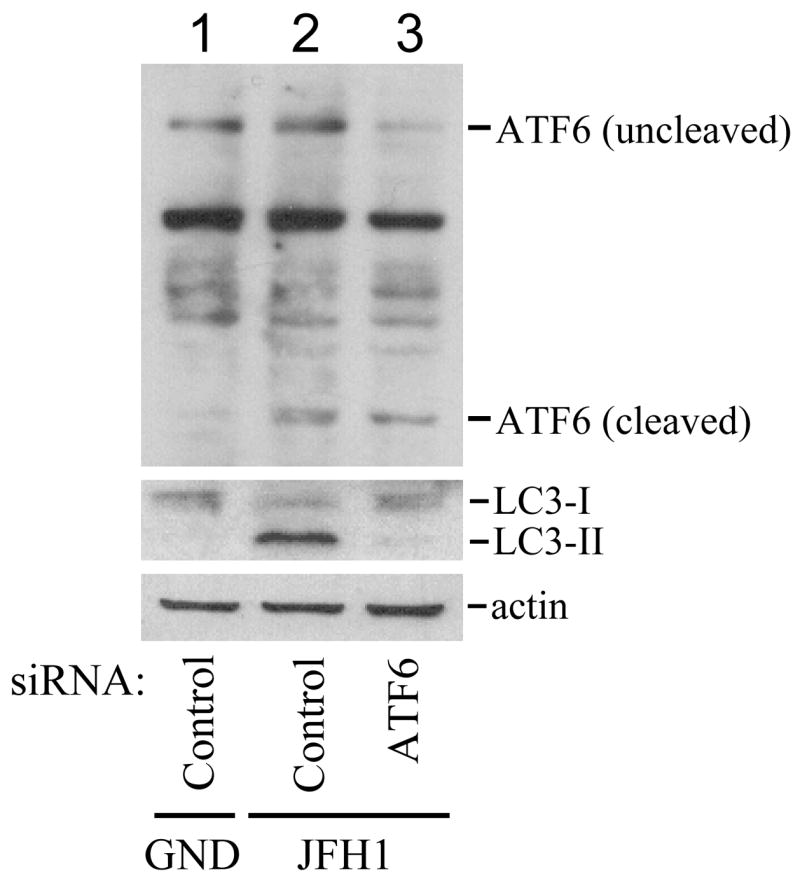
Huh7.5 cells were electroporated with JFH1/GND RNA (lane 1) or JFH1 RNA followed by transfection with a control siRNA (lanes 1 and 2) or siRNAs directed against PERK (A; lanes 3 and 4), IRE1 (B; lane 3) or ATF6 (C; lane 3). Cells were then lysed for Western-blot analysis.
In the IRE1 knockdown experiment, the siRNA directed against IRE1 but not the control siRNA significantly reduced the IRE1 protein level (Fig. 7B). The IRE1 siRNA but not the control siRNA also reduced the LC3-II protein level. Similarly, in the ATF6 knockdown experiment, the siRNA directed against ATF6 significantly reduced uncleaved and cleaved ATF6 protein levels and also the LC3-II protein level (Fig. 7C).
As a control, we also analyzed the effects of PERK, IRE1 and ATF6 siRNAs on LC3 in naïve Huh7.5 cells. None of these siRNAs had any effect on LC3 (Supplementary Figure 3). These results indicated that PERK, IRE1 and ATF6 pathways were also important for the lipidation of LC3 induced by HCV. The role of ER stress in LC3 lipidation was further confirmed by the treatment of cells with the chemical chaperon PBA, which reduced the LC3-II level in HCV cells (Supplementary Figure 4).
Positive effect of ER stress and autophagic pathway in HCV RNA replication
To investigate the possible effect of ER stress and the autophagic pathway on HCV RNA replication, cells treated with control siRNA or siRNA directed against PERK, IRE1 or ATF6 were analyzed for HCV RNA levels by qRT-PCR. As shown in Fig. 8A, the siRNAs directed against PERK, IRE1 and ATF6 reduced the HCV RNA level by approximately 80%, 98% and 80%, respectively, as compared with HCV RNA levels in cells treated with the control siRNA. These results indicated that ER stress and likely also autophagosomes played a positive role in HCV RNA replication. To confirm the role of the autophagosomes in HCV RNA replication, we conducted additional knockdown experiments using siRNAs directed against LC3 and Atg7. The LC3 siRNA reduced both LC3-I and LC3-II protein levels, whereas the Atg7 siRNA reduced the Atg7 protein level and the LC3-II level (Fig. 8B). The LC3 siRNA and the Atg7 siRNA also reduced the HCV RNA level by approximately 70% and 55% in JFH1 cells (Fig. 8A), confirming a positive role of autophagosomes or the pathway leading to its accumulation in HCV RNA replication.
Figure 8. Effects of ER stress and LC3 on HCV RNA replication.


(A) Quantification of HCV RNA. Huh7.5 cells electroporated with either GND RNA or JFH1 RNA were further transfected using the siRNAs indicated under the chart for 48 hrs. Total cellular RNA was then isolated for qRT-PCR analysis. JFH1 cells transfected with the control siRNA were arbitrarily defined as 100%. The results represent the average of at least three independent experiments. The PERK(2) siRNA, which was more efficient in suppressing the expression of PERK was used for the analysis. (B) Western-blot analysis of LC3 and Atg7. Cells in a 10-cm dish transfected by the GND RNA (lanes 1 and 5), JFH1 RNA (lanes 2–4 and 6–7) were further transfected with the control (C) siRNA (lanes 1, 2, 5 and 6), 4.7 μg of LC3 siRNA (lane 3), 9.5 μg of LC3 siRNA (lane 4) or 9.5 μg of Atg7 siRNA (lane 7).
Discussion
Several viruses have been shown to induce autophagy (for a review, see (23)). Our results demonstrated that HCV also induces the accumulation of autophagosomes in its host cells (Fig. 1 and 2). The ability of HCV to induce autophagosomes is not limited to the genotype 2a HCV JFH1 strain, as this induction was also observed in Huh7 cells harboring the genotype 1b Con-1 virus subgenomic RNA replicon (Fig. 2B). While this manuscript was in preparation, it was also reported that the HCV genotype 1a virus could induce the accumulation of autophagic vacuoles (24). Thus, the ability of HCV to induce autophagosomes is shared by HCV strains across different genotypes. Interestingly, however, although HCV JFH1 was able to induce autophagosomes, it was not able to enhance autophagic protein degradation (Fig. 3). This lack of enhancement of autophagic degradation by HCV is apparently due to the inefficient fusion between autophagosomes and lysosomes (Fig. 4).
How viruses induce autophagy has remained largely unclear. Our results demonstrated that HCV induced the accumulation of autophagosomes via the induction of ER stress (Fig. 5 and 6). This induction of autophagosomes involved all three arms of the UPR (Fig. 7), as the suppression of any of these three pathways suppressed the lipidation of LC3, an essential step for the formation of autophagosomes. This observation is interesting, as it indicated that the target genes activated by these different signaling pathways must work in concert with one another to induce autophagy. ER stress can enhance autophagy in Huh7.5 cells (Fig. 6). However, the autophagy activated by HCV is incomplete, as autophagic degradation is not increased (Fig. 3). It is likely that HCV factors and/or other signaling pathways activated by HCV perturb the maturation of autophagic vacuoles (Fig. 4).
The suppression of any of the three signaling pathways of UPR decreased HCV RNA replication (Fig. 8). This is at least partially via the suppression of the autophagic response, as suppressing the expression of Atg7 and LC3, two proteins necessary for autophagosome formation, also led to a reduced level of HCV RNA replication (Fig. 8). Thus, our results indicated that ER stress and the autophagic pathway play a positive role in HCV replication. It does not appear likely that HCV uses autophagosomes as sites for virion morphogenesis, as the HCV core protein and autophagosomes do not colocalize (Fig. 1B). The replication complexes of several positive RNA viruses localize to autophagosomes (25–28), but it remains to be determined whether the HCV RNA replication complex also resides on autophagosomes or on membranes derived from autophagosomes.
In conclusion, our studies demonstrated that HCV induced ER stress and an incomplete autophagic response. The persistent induction of ER stress and the incomplete activation of autophagy likely play an important role in HCV pathogenesis. Our results also suggest that the many viruses that are capable of inducing ER stress have the potential to induce an autophagic response. The outcome of this response, however, would likely vary for individual viruses, as, on the one hand, autophagy is a cellular mechanism to clear viral infection, while, on the other hand, viruses like HCV appear to have used this cellular response to enhance its own replication.
Supplementary Material
Acknowledgments
This work was supported by PHS grants (AI060559 to J.O. and P30DK26743 to the UCSF Liver Center) and a VA Merit Review grant (to T.S.B.Y).
We wish to thank Dr. Amy Lee for helpful discussions on ER stress during the course of our studies and Dr. David Ann for helpful suggestions on autophagy studies and for critical reading of this manuscript. We also thank Dr. Charles Rice for providing us with the Huh7.5 cells, Ms. Michelle McVeigh at the USC Research Center for Liver Diseases for help with confocal microscopy and Ms. Sandra Huling of the SFVAMC/NCIRE Microscopy Core for electron microscopy.
List of abbreviations
- HCV
hepatitis C virus
- UPR
unfolded protein response
- LC3
microtubule-associated protein light chain 3
- DMEM
Dulbecco’s modified Eagle’s medium
- FBS
fetal bovine serum
- HBSS
Hank’s balanced salt solution
- GFP
green fluorescence protein
- Tg
thapsigargin
- DTT
dithiothreitol
- TCA
trichloroacetic acid
- siRNA
short interference RNA
- PBA
4-phenylbutyric acid
- qRT-PCR
quantitative real-time polymerase chain reaction
- BAF
bafilomycin A1
- ER stress
endoplasmic reticulum stress
Contributor Information
Donna Sir, Email: dsir@hsc.usc.edu.
Wen-ling Chen, Email: wenlingc@hsc.usc.edu.
Jinah Choi, Email: jchoi@ucmerced.edu.
Takaji Wakita, Email: wakita@nih.go.jp.
T.S. Benedict Yen, Email: ben.yen@ucsf.edu.
Jing-hsiung James Ou, Email: jamesou@hsc.usc.edu.
References
- 1.Levine B, Kroemer G. Autophagy in the Pathogenesis of Disease. Cell. 2008;132:27–42. doi: 10.1016/j.cell.2007.12.018. [DOI] [PMC free article] [PubMed] [Google Scholar]
- 2.Kirkegaard K, Taylor MP, Jackson WT. Cellular autophagy: surrender, avoidance and subversion by microorganisms. Nat Rev Microbiol. 2004;2:301–314. doi: 10.1038/nrmicro865. [DOI] [PMC free article] [PubMed] [Google Scholar]
- 3.Moradpour D, Penin F, Rice CM. Replication of hepatitis C virus. Nat Rev Microbiol. 2007;5:453–463. doi: 10.1038/nrmicro1645. [DOI] [PubMed] [Google Scholar]
- 4.Wakita T, Pietschmann T, Kato T, Date T, Miyamoto M, Zhao Z, Murthy K, et al. Production of infectious hepatitis C virus in tissue culture from a cloned viral genome. Nat Med. 2005;11:791–796. doi: 10.1038/nm1268. [DOI] [PMC free article] [PubMed] [Google Scholar]
- 5.Lindenbach BD, Evans MJ, Syder AJ, Wolk B, Tellinghuisen TL, Liu CC, Maruyama T, et al. Complete replication of hepatitis C virus in cell culture. Science. 2005;309:623–626. doi: 10.1126/science.1114016. [DOI] [PubMed] [Google Scholar]
- 6.Zhong J, Gastaminza P, Cheng G, Kapadia S, Kato T, Burton DR, Wieland SF, et al. Robust hepatitis C virus infection in vitro. Proc Natl Acad Sci U S A. 2005;102:9294–9299. doi: 10.1073/pnas.0503596102. [DOI] [PMC free article] [PubMed] [Google Scholar]
- 7.Cai Z, Zhang C, Chang KS, Jiang J, Ahn BC, Wakita T, Liang TJ, et al. Robust production of infectious hepatitis C virus (HCV) from stably HCV cDNA-transfected human hepatoma cells. J Virol. 2005;79:13963–13973. doi: 10.1128/JVI.79.22.13963-13973.2005. [DOI] [PMC free article] [PubMed] [Google Scholar]
- 8.Kabeya Y, Mizushima N, Ueno T, Yamamoto A, Kirisako T, Noda T, Kominami E, et al. LC3, a mammalian homologue of yeast Apg8p, is localized in autophagosome membranes after processing. Embo J. 2000;19:5720–5728. doi: 10.1093/emboj/19.21.5720. [DOI] [PMC free article] [PubMed] [Google Scholar]
- 9.Kato T, Date T, Miyamoto M, Furusaka A, Tokushige K, Mizokami M, Wakita T. Efficient replication of the genotype 2a hepatitis C virus subgenomic replicon. Gastroenterology. 2003;125:1808–1817. doi: 10.1053/j.gastro.2003.09.023. [DOI] [PubMed] [Google Scholar]
- 10.Choi J, Lee KJ, Zheng Y, Yamaga AK, Lai MM, Ou JH. Reactive oxygen species suppress hepatitis C virus RNA replication in human hepatoma cells. Hepatology. 2004;39:81–89. doi: 10.1002/hep.20001. [DOI] [PubMed] [Google Scholar]
- 11.Shang J, Gao N, Kaufman RJ, Ron D, Harding HP, Lehrman MA. Translation attenuation by PERK balances ER glycoprotein synthesis with lipid-linked oligosaccharide flux. J Cell Biol. 2007;176:605–616. doi: 10.1083/jcb.200607007. [DOI] [PMC free article] [PubMed] [Google Scholar]
- 12.Zhu JH, Horbinski C, Guo F, Watkins S, Uchiyama Y, Chu CT. Regulation of autophagy by extracellular signal-regulated protein kinases during 1-methyl-4-phenylpyridinium-induced cell death. Am J Pathol. 2007;170:75–86. doi: 10.2353/ajpath.2007.060524. [DOI] [PMC free article] [PubMed] [Google Scholar]
- 13.amamoto A, Tagawa Y, Yoshimori T, Moriyama Y, Masaki R, Tashiro Y. Bafilomycin A1 prevents maturation of autophagic vacuoles by inhibiting fusion between autophagosomes and lysosomes in rat hepatoma cell line, H-4-II-E cells. Cell Struct Funct. 1998;23:33–42. doi: 10.1247/csf.23.33. [DOI] [PubMed] [Google Scholar]
- 14.Bjorkoy G, Lamark T, Brech A, Outzen H, Perander M, Overvatn A, Stenmark H, et al. p62/SQSTM1 forms protein aggregates degraded by autophagy and has a protective effect on huntingtin-induced cell death. J Cell Biol. 2005;171:603–614. doi: 10.1083/jcb.200507002. [DOI] [PMC free article] [PubMed] [Google Scholar]
- 15.Benali-Furet NL, Chami M, Houel L, De Giorgi F, Vernejoul F, Lagorce D, Buscail L, et al. Hepatitis C virus core triggers apoptosis in liver cells by inducing ER stress and ER calcium depletion. Oncogene. 2005;24:4921–4933. doi: 10.1038/sj.onc.1208673. [DOI] [PubMed] [Google Scholar]
- 16.Chan SW, Egan PA. Hepatitis C virus envelope proteins regulate CHOP via induction of the unfolded protein response. Faseb J. 2005;19:1510–1512. doi: 10.1096/fj.04-3455fje. [DOI] [PubMed] [Google Scholar]
- 17.Liberman E, Fong YL, Selby MJ, Choo QL, Cousens L, Houghton M, Yen TS. Activation of the grp78 and grp94 promoters by hepatitis C virus E2 envelope protein. J Virol. 1999;73:3718–3722. doi: 10.1128/jvi.73.5.3718-3722.1999. [DOI] [PMC free article] [PubMed] [Google Scholar]
- 18.Tardif KD, Mori K, Kaufman RJ, Siddiqui A. Hepatitis C virus suppresses the IRE1-XBP1 pathway of the unfolded protein response. J Biol Chem. 2004;279:17158–17164. doi: 10.1074/jbc.M312144200. [DOI] [PubMed] [Google Scholar]
- 19.Ogata M, Hino S, Saito A, Morikawa K, Kondo S, Kanemoto S, Murakami T, et al. Autophagy is activated for cell survival after endoplasmic reticulum stress. Mol Cell Biol. 2006;26:9220–9231. doi: 10.1128/MCB.01453-06. [DOI] [PMC free article] [PubMed] [Google Scholar]
- 20.Kouroku Y, Fujita E, Tanida I, Ueno T, Isoai A, Kumagai H, Ogawa S, et al. ER stress (PERK/eIF2alpha phosphorylation) mediates the polyglutamine-induced LC3 conversion, an essential step for autophagy formation. Cell Death Differ. 2007;14:230–239. doi: 10.1038/sj.cdd.4401984. [DOI] [PubMed] [Google Scholar]
- 21.Ron D, Walter P. Signal integration in the endoplasmic reticulum unfolded protein response. Nat Rev Mol Cell Biol. 2007;8:519–529. doi: 10.1038/nrm2199. [DOI] [PubMed] [Google Scholar]
- 22.Yoshida H, Oku M, Suzuki M, Mori K. pXBP1(U) encoded in XBP1 pre-mRNA negatively regulates unfolded protein response activator pXBP1(S) in mammalian ER stress response. J Cell Biol. 2006;172:565–575. doi: 10.1083/jcb.200508145. [DOI] [PMC free article] [PubMed] [Google Scholar]
- 23.Lee HK, Iwasaki A. Autophagy and antiviral immunity. Curr Opin Immunol. 2008 doi: 10.1016/j.coi.2008.01.001. [DOI] [PMC free article] [PubMed] [Google Scholar]
- 24.Ait-Goughoulte M, Kanda T, Meyer K, Ryerse JS, Ray RB, Ray R. Hepatitis C virus genotype 1a growth and induction of autophagy. J Virol. 2008;82:2241–2249. doi: 10.1128/JVI.02093-07. [DOI] [PMC free article] [PubMed] [Google Scholar]
- 25.Jackson WT, Giddings TH, Jr, Taylor MP, Mulinyawe S, Rabinovitch M, Kopito RR, Kirkegaard K. Subversion of cellular autophagosomal machinery by RNA viruses. PLoS Biol. 2005;3:e156. doi: 10.1371/journal.pbio.0030156. [DOI] [PMC free article] [PubMed] [Google Scholar]
- 26.Prentice E, Jerome WG, Yoshimori T, Mizushima N, Denison MR. Coronavirus replication complex formation utilizes components of cellular autophagy. J Biol Chem. 2004;279:10136–10141. doi: 10.1074/jbc.M306124200. [DOI] [PMC free article] [PubMed] [Google Scholar]
- 27.Pedersen KW, van der Meer Y, Roos N, Snijder EJ. Open reading frame 1a-encoded subunits of the arterivirus replicase induce endoplasmic reticulum-derived double-membrane vesicles which carry the viral replication complex. J Virol. 1999;73:2016–2026. doi: 10.1128/jvi.73.3.2016-2026.1999. [DOI] [PMC free article] [PubMed] [Google Scholar]
- 28.Goldsmith CS, Tatti KM, Ksiazek TG, Rollin PE, Comer JA, Lee WW, Rota PA, et al. Ultrastructural characterization of SARS coronavirus. Emerg Infect Dis. 2004;10:320–326. doi: 10.3201/eid1002.030913. [DOI] [PMC free article] [PubMed] [Google Scholar]
Associated Data
This section collects any data citations, data availability statements, or supplementary materials included in this article.