

Abstract
There have been several reports about the potential for predicting prognosis of neuroblastoma patients using microarray gene expression profiling of the tumors. However these studies have revealed an apparent diversity in the identity of the genes in their predictive signatures. In order to test the contribution of the platform to this discrepancy we applied z-scoring method to minimize the impact of platform and combine gene expression profiles of neuroblastoma (NB) tumors from two different platforms, cDNA and Affymetrix. A total of 12442 genes were common to both cDNA and Affymetrix arrays in our dataset. Two-way ANOVA analysis was applied to the combined dataset for assessing the relative effect of prognosis and platform on gene expression. We found 26.6% (3307) of the genes had significant impact on survival. There was no significant impact of microarray platform on expression after application of z-scoring standardization procedure. Artificial neural network (ANN) analysis of the combined data set in a leave-one-out prediction strategy correctly predicted the outcome for 90% of the samples. Hierarchical clustering analysis using the top-ranked 160 genes showed the great separation of two clusters, and the majority of matched samples from the different platforms were clustered next to each other. The ANN classifier trained with our combined cross-platform data for these 160 genes could predict the prognosis of 102 independent test samples with 71% accuracy. Furthermore it correctly predicted the outcome for 85/102 (83%) NB patients through the leave-one-out cross validation approach. Our study showed that gene expression studies performed in different platforms could be integrated for prognosis analysis after removing variation resulting from different platforms.
Introduction
Neuroblastoma (NB) is the most common solid extra-cranial tumor of childhood. Patients with high-risk neuroblastoma still have a very poor outcome; therefore the prediction of prognosis is important for the selection of treatment. We and others have reported the capability of predicting prognosis of neuroblastoma patients using microarray gene expression profiling [1; 2; 3; 4; 5]. However these studies have revealed an apparent diversity in the identity of the genes in their predictive signatures. The factors causing the diversity may include the difference of patient treatment protocol, tumor sample source, tumor selection, sample number, sample preparation, microarray platform and data analysis. Integrating data from existing experiments into a metadata pool may be beneficial for the retrieval of a gene signature that best predicts outcome for patients with neuroblastoma.
Microarray technology has become a powerful tool for analyzing gene expression and several different microarray platforms have emerged during the past several years including commercial and custom-made cDNA and oligonucleotide arrays. The diversity of platforms has made it a challenge to compare and integrate the datasets generated in different experiments. Many comparison studies have been done to investigate the agreement in results obtained with different platforms [6; 7; 8; 9; 10; 11; 12]. Recently Larkin et al [6] compared the whole gene expression data set generated in Affymetrix and cDNA platforms by using a mouse model of angiontensin II-induced hypertension and found that the analysis of cardiac gene expression yielded consistent results for greater than 90% of the genes in common between the two platforms.
In this study we compared and integrated the gene expression profiles of 42 neuroblastoma tumor samples with known patient outcome, using both cDNA and the Affymetrix platforms. We combined the data sets from different platforms after using z-scoring to minimize the impact of platform and assessed the relative effect of prognosis and platform on gene expression of the combined data. We used the signature obtained from the integrated data to validate independent data from a different laboratory.
Results
Impact of prognosis and platform on gene expression
To assess if the expression profile data from two different array platforms could be integrated for prognosis analysis, we performed gene expression profiles of 42 neuroblastoma tumor samples with known outcome on both cDNA and Affymetrix platforms (Supplemental Table 1). The data from each platform was normalized separately as described in detail in Materials and Methods. The Unigene ID was used as a common identifier to link the two platforms. In case of multiple probes representing the same Unigene cluster, the probe with the top correlation (Pearson correlation) between cDNA and Affymetrix arrays was kept for the analysis. A total of 12442 unique Unigene clusters were common to both platforms and were kept for the subsequent analysis. We performed log2 transformation for the expression ratio and z-score standardization across samples for each gene separately for each platform. The data sets from two different platforms were then combined for further analysis. The gene correlation between the data collected from two platforms is shown in Fig 1. Around 50% of genes have a correlation greater than 0.56 (p < 0.0001).
Fig 1. Cross-platform correlation of neuroblastoma prognosis gene expression data.

Forty-two unique neuroblastoma samples with 26 in good prognosis group (Alive) and 16 in poor prognosis (Dead) were analyzed by both cDNA and Affymetrix microarray platforms. The Unigene ID was used as a common identifier. The Pearson correlation was calculated for the probes representing the same Unigene cluster, the probe with the top correlation between cDNA and Affymetrix arrays was kept for the analysis (a total of 12442 Unigenes). The distribution of correlations for 12442 unigenes is shown in blue. The red curve shows the distribution of the correlations of the reshuffled data with random sample labels for each gene, the process was repeated for 1000 times. The dashed vertical line represents the p < 0.001 level.
We used principal components analysis (PCA) to reduce the dimensionality of the data. The first three principal components showed the differential expression of tumors with good prognosis and poor prognosis (Fig 2A). Hierarchical clustering using all of 12442 genes also showed a separation of tumors with good prognosis and poor prognosis (Fig 2B), but three of tumor samples (NB282, NB206 and NB207) were shown clearly not clustered according to their status. In the original paper [1] NB282 was also predicted to have poor prognosis and it is possible that this patient may have relapsed after the 3-year follow-up period since there is a small percentage of patients that relapse after 3 years. Unfortunately because the patients were anonymized for our study and have severed all linking information we do not have the means to see what happened to the patient after 3 years. Interestingly NB206 and NB207 were predicted to have poor prognosis using ANN in the original paper [1] although they are not clustered with other poor prognosis samples in our hierarchical clustering analysis here. There are two possible reasons for this. Firstly, hierarchical clustering is an unsupervised linear classification tool and we used all quality filtered genes and thus it is not expected to work as well as ANN which is supervised non-linear classification with use of hidden layers. Secondly, of note NB206 and NB207 although they died of disease had relatively longer survival times (5.8 and 3.1 years) compared to other poor prognosis samples. Thus these unusual samples may be biologically different compared with the majority of others who dies of disease. These are speculative and difficult to validate.
Fig 2. The impact of prognosis on gene expression.
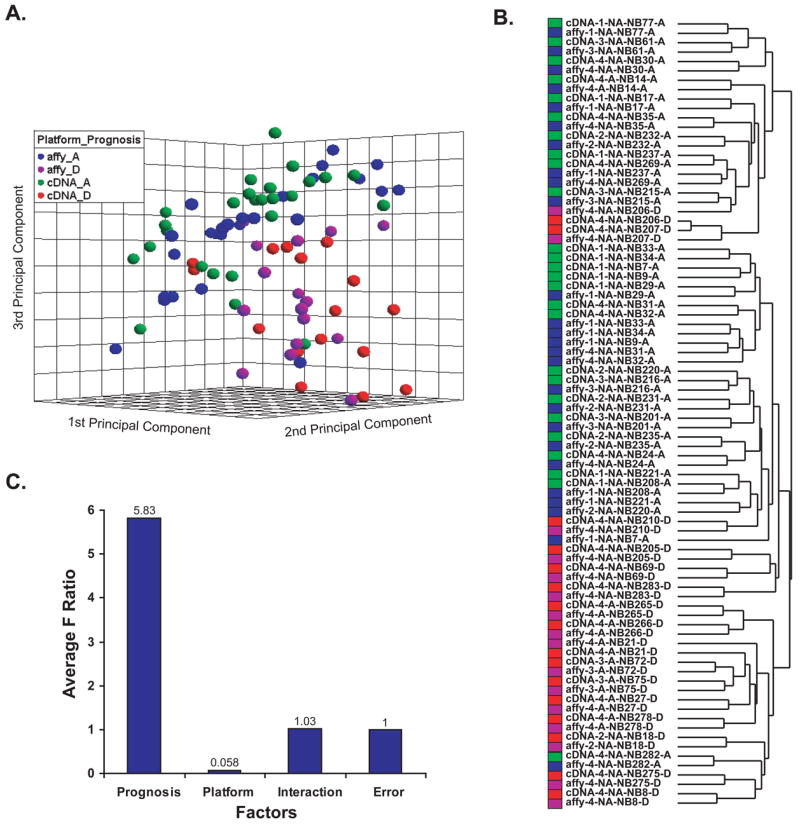
The datasets of 42 neuroblastoma samples from two platforms were combined after the normalization and z-score standardization to remove the effect of platform. The poor prognosis samples are shown in red (cDNA) and magenta (Affymetrix), good prognosis in green (cDNA) and blue (Affymetrix). A. Loading plot of top three principal components of the 84 experiments using all 12442 Unigenes demonstrates the separation of good prognosis from poor prognosis samples. Platform effect is not seen after normalization. The sample labels are shown as follows: platform-stage-MYCN status-sample name-survival status. For MYCN; NA= not amplified and A= amplified and for survival status A= alive and D= dead. B. Hierarchical clustering analysis using all 12442 Unigenes showed the experiments are mainly clustering according to clinical outcome. C. The sources of variation in the two-way ANOVA analysis. Prognosis has the highest variation.
We then investigated the effect of platform on the combined data analysis using two-way ANOVA as described by Larkin et al [6]. Fig 2C showed the source of variation associated with the different factors: prognosis, platform, and interaction. The F-ratio for each factor represents the variance by this factor relative to the random within group variance (error). Interaction addresses whether the effect of prognosis depends on platform or vice versa. In this two-way ANOVA result, the F-ratio of 0.058 for platform factor means that the variation associated with platform was very low suggesting that the effect of platform could be removed by the simple z-scoring standardization; F-ratio of 5.83 for prognosis effect means that the variation associated with prognosis is much larger. This result agreed with the result of PCA and hierarchical clustering. In detail, for the 12442 genes present on both arrays, 26.6% (n = 3307) had significant impact (p_prognosis < 0.01) on prognosis; there was no significant impact of microarray platform on expression levels after the normalization mentioned above (p_platform > 0.19 for all genes). The interaction in the ANOVA analysis identifies genes with divergent gene expression measurements between the two platforms [6]. We found that 2.0% (n = 253) of all 12442 genes had significant interaction (p_interaction < 0.01) between platform and prognosis (Supplemental Table 5), which means that the two platforms gave discordant measurements of samples with good and poor prognosis for this subset of genes. The false discovery rate (FDR) of the test at significance level of 0.05 is shown in Supplemental Table 2; according to FDR-adjusted significance level 3632 genes had significant prognosis impact, 21 genes showed interaction and no gene had significant platform impact. All datasets as well as the ANOVA results are available in an online searchable database (http://pob.abcc.ncifcrf.gov/cgi-bin/JK). To investigate the biological differences between good and poor prognosis groups, we performed GO analysis on these 3307 significant genes (p_prognosis < 0.01) as well as their significance (Supplemental Table 3). Genes involved in signal transducer activity were significantly associated with good prognosis group; genes involved in metabolism, mitotic cell cycle, biosynthesis, RNA and DNA metabolism, and RNA processing were significantly associated with poor prognosis group.
We also compared z-score method with two other methods, Distance Weighted Discrimination (DWD) [13] and mean-centering method, in removing variation resulting from different platforms. As shown in Supplemental Fig 1, all three methods worked well, which suggested that all of these methods could be used to integrate the data. In addition, we validated the integration method on a published breast cancer dataset [11] (Supplemental Fig 2). Finally we validated our method using a dataset from preclinical pediatric xenograft samples generated on custom cDNA array [14] and Affymetrix human U133plus2 array [15] (Supplemental Fig 3). For this dataset RNA from the same xenograft samples were isolated in independent laboratories and were profiled with cDNA by our laboratory [14] and Affymetrix microarrays from an independent laboratory [15] respectively (see methods and Supplemental Fig 3 for more details).
Neuroblastoma prognosis analysis on cross-platform data
To investigate if the data integrated from the two platforms could be used for prognosis analysis, ANN analysis and leave-one-out prediction strategy were applied on the combined cross-platform data of 42 neuroblastoma samples with 12442 genes. Samples analyzed on the two platforms were considered as different samples, the same samples from both platforms were left out as test samples when performing the leave-one-out testing. We found that the ANNs correctly predicted 30/32 poor-outcome and 46/52 good-outcome cases (Fig 3A) with an accuracy rate 90%. To identify the optimal set of genes that results in the minimum classification errors, we performed a gene minimization procedure in a separate ANN analysis. We observed that the top 160 ANN-ranked probes resulted in the minimal classification error (Fig 3B). The ranking information is also available in the online searchable database (http://pob.abcc.ncifcrf.gov/cgi-bin/JK). Hierarchical clustering analysis (Fig 3C) using the 160 top-ranked probes showed two distinct clusters (good prognosis vs. poor prognosis group). We did not observe a platform effect on the clustering. The majority of matched samples from the different platforms were clustered next to each other. In most cases they have a similar heatmap pattern. This result again suggests that the data from two platforms could be integrated for the prognosis analysis after the data standardization.
Fig 3. Prediction of neuroblastoma outcome using cross-platform data.

A. ANN voting results for outcome prediction of 42 samples from two platforms using 12442 Unigenes in a leave-one-out prediction strategy. The same samples from both platforms were left out as test samples when performing leave-one-out test. Red represents the samples with poor prognosis, green with good prognosis. Vertical line at 0.5 is the decision boundary for outcome prediction, good signature < 0.5, poor signature >= 0.5. B. Gene minimization plot for ANN prediction. ANNs were trained using 42 samples from both two platforms; the average prediction errors were calculated. The minimal number of genes that generated the minimal error rate was 160. C. Hierarchical clustering analysis using the top 160 Unigenes showed the experiments clustered according to clinical outcome. Matched samples from the different platforms clustered tightly. Experiment color codes and sample labels are used as in Fig 2.
Prediction of prognosis in an independent test set
To investigate if the experiment of independent samples from a different lab can be integrated with the previous cross-platform data set of 42 samples, we used an independent test dataset of 102 neuroblastoma samples, representing different cohort of patients, produced on the Affymetrix U133ABset platform generated by a different lab [4]. This data set includes 56 good prognosis samples (no disease relapse for at least 5 years from diagnosis) and 46 poor prognosis samples (have disease relapse). We performed PCA and ANOVA analysis on the integrated data consisting of the cross-platform data set of 42 samples (84 experiments) and the independent data set of 102 samples, each of them was z-score standardized before combined. As shown in Fig 4A the samples representing different cohort of patients on different platforms are intermingled. Separation between good and poor prognosis group could be seen as well. ANOVA analysis showed that the variation associated with prognosis is much larger than platform and patient cohort (Fig 4B).
Fig 4. Integrated data from different cohorts of patients.
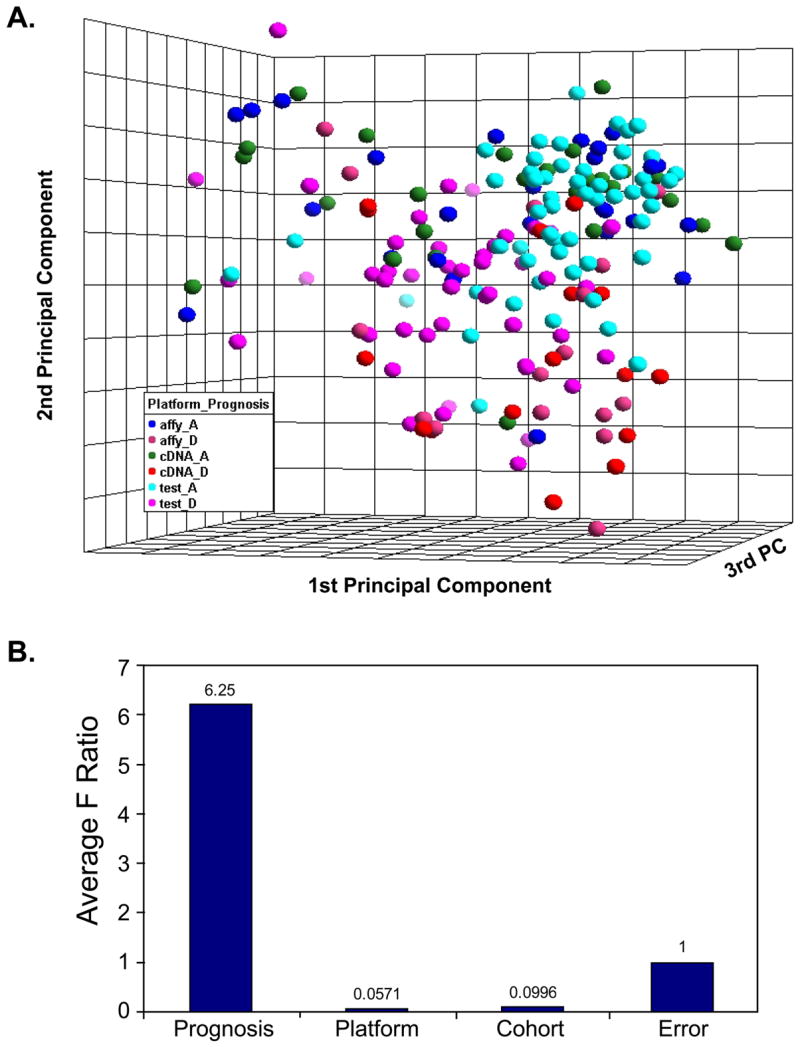
The datasets of 42 neuroblastoma samples on cDNA and Affymetrix platforms (84 experiments) and a dataset of 102 neuroblastoma samples produced on Affymetrix platform generated by a different lab [4] with a different cohort of patients were combined after the normalization and z-score standardization separately. A. Loading plot of top three principal components of the 186 experiments using all 12442 Unigenes demonstrates the separation of good prognosis from poor prognosis samples. Platform effect and patient cohort effect are not seen after standardization. The sample labels are shown as follows: for patient cohort and platform status affy= 42 neuroblastoma samples on Affymetrix, cDNA= 42 neuroblastoma samples on cDNA, test= 102 neuroblastoma samples on Affymetrix; for survival status A= alive and D= dead. B. The sources of variation in the ANOVA analysis. Prognosis has the highest variation.
We also tested the prediction power of 160 top ranked genes on samples from the independent data set. We recalibrated or trained the ANNs with the cross-platform data of 42 samples for the 160 top ranked genes and predicted the prognosis of 102 neuroblastoma samples in the independent test data set [4]. The ANNs correctly predicted the outcomes for 32/46 poor outcome and 40/56 good outcome patients, corresponding to the accuracy rate of 71% (Fig 5A). The Kaplan-Meier survival curve of event-free-survival was constructed for the patients classified as good and poor outcome by the ANN analysis above (Fig 5B). The results showed that the patients classified into different outcomes had significantly different survival probabilities (P < 0.0001). We also used ANNs to predict the prognosis of the 102 samples with the 160 top ranked probes using a leave-one-out prediction strategy. We found that this ANN classifier correctly predicted 38/46 poor-outcome and 47/56 good-outcome cases with the accuracy rate 83%. This corresponds to a sensitivity of 83% and specificity of 84% for the poor-outcome patients (data not shown).
Fig 5. Prediction of neuroblastoma prognosis in an independent data set.

A. ANN voting results for outcome prediction of 102 neuroblastoma samples from an independent test set [4]. The ANNs were trained using the top ranked 160 Unigenes with the cross-platform data of 42 samples. The data set from 102 neuroblastoma samples were z-score transformed and plugged in as test samples. Magenta represents the samples with poor prognosis; blue with good prognosis. Vertical line at 0.5 is the decision boundary for outcome prediction, good signature < 0.5, poor signature >= 0.5. ANN classifier correctly predicted 32/46 poor-outcome and 40/56 good-outcome cases with the accuracy rate 71%. The sample labels are shown as: disease status-sample number. For disease status; “poor” means patients relapsed within 5 year and “good” means there is no disease relapse for at least 5 years from diagnosis. B. Kaplan-Meier curve of event-free-survival probability of 102 patients based on the ANN analysis obtained from A. The patients classified as good and poor outcome had significantly different survival probability (p < 0.0001).
Discussion
We have shown that gene expression studies performed in different platforms could be combined for prognosis analysis after properly removing variation resulting from different platforms. However in order to perform integration of data from different sources with highly heterogeneous cross-platform data sets, many factors have to be considered, such as sample source, sample composition, time interval of freezing of samples, RNA preparation, labeling method, array platform, data preprocessing and other technical noises. In this study we mainly focused on the noise caused by platforms using homogenous sample preparation. We examined the effect of the platform by carefully selecting the same RNA samples for both cDNA and Affymetrix oligonucleotide platforms, and applied the z-scoring method to integrate the cross-platform data. Because of the use of z-scoring to standardize the data from each of the different platforms the method will best work when combining similar data sets, in our case both data sets were from neuroblastoma tumors. We compared two neuroblastoma prognosis data sets generated on in-house cDNA and Affymetrix oligonucleotide arrays by using ANOVA, PCA and hierarchical clustering analysis. All of the results confirmed that platform had no significant effect after standardization but patient prognosis had a dominant impact on gene expression levels of combined data. Hierarchical clustering analysis using the top ranked genes separated well the samples of good prognosis group from those of poor prognosis. The same samples analyzed in two platforms clustered tightly, they were next to each other in most of cases. However there were a small set of genes which showed a significant interaction between prognosis and platform. Splice variants, difference of probe sequences used in both platforms and the contamination of cDNA clones may contribute to the inconsistence of their expressions.
It has been well discussed [6; 7; 11] that methods used for the data preprocessing and handling may affect the comparability of expressions across platforms. In order to perform the cross-platform comparison the Unigene ID has been frequently used as a unique identifier to match probes on the different platforms. The sequence-matching approach has also been used to increase the cross-platform consistency [16]. We used Unigene ID as the common identifier in this study; in cases where multiple probes were represented for same unigene in both cDNA and Affymetrix platforms, we kept the top correlated probes in the neuroblastoma study; and the average of multiple probes was used in pediatric xenograft datasets and breast cancer datasets (Supplemental Fig 2 and 3). The success of this method is evident by the unsupervised hierarchical clustering analysis (Fig 3C and Supplemental Fig 3B); the majority of matched samples from the different platforms were clustered next to each other. Since the normalization methods for the data from the different platforms are very different, we normalized the data sets from cDNA array and Affymetrix array platforms separately in their own standard normalization methods. Then each data set was standardized using a simple z-score transformation method and combined for analysis. This simple standardizing process has been proven to work well in our study and make the data from two different platforms, but similar datasets, comparable and combinable on the same scale. We used ANOVA analysis [6] to assess the impact of platform on expression levels after z-scoring standardization in neuroblastoma study and have not observed any gene with significant impact of platform. DWD and mean-centered methods were also proved to work well. A previous study [11] illustrated that data from different microarray platforms are variable to the extent that direct integration of data from several sources may be complicated and unreliable. Our study clearly exhibits the promising result of data integration from different platforms, and we have tested the method on the breast cancer cell line data used in that study (Supplemental Fig 2). PCA analyses showed that after z-score standardization the experiments of same cell line with data generated on different platforms and different normalizations cluster together tightly; ANOVA analysis also indicated that the standardization completely reduced the platform effect and increased the difference between cell lines. In addition, we validated the method on a dataset of preclinical pediatric xenograft generated on both cDNA and Affymetrix platforms (Supplemental Fig 3). The result in Supplemental Fig 3 indicated that the integrative method is applicable to multi-class unsupervised (PCA and hierarchical clustering analysis) and supervised (ANN analysis) classification. Furthermore, we used a neuroblastoma prognosis data set generated on Affymetrix U133ABset platform from a different laboratory by Asgharzadeh et al [4] as an independent test set. Of note the ANN classifier calibrated or trained with our combined cross-platform data could predict the prognosis of 102 samples of the independent test set to 71% accuracy. The 42 tumor samples we had were of different stages with or without MYCN amplification, however the 102 samples from Asgharzadeh et al [4] only included the patients in the high stage without MYCN amplification. Considering that the data is from a different lab, a different platform, with different data normalization method, different sample collection method and even different patient selection, it is not trivial to achieve such accuracy. Again the ANN analysis on this independent set with the 160 genes correctly predicted 83% of patients in a leave-one-out prediction strategy, further indicating that the gene signature obtained from the cross-platform data are reliable.
Functional GO analysis for the top 160 genes obtained from the integrated data indicated that genes related with mitochondrion were significantly associated with poor prognosis group (p < 0.01 and Bonferroni corrected p < 0.01). Genes involved in energy pathways, mitotic cell cycle, ATPase activity and structural constituent of ribosome were also significantly associated with poor prognosis group (p < 0.05) although it is not significant after Bonferroni correction (data not shown). So far several gene expression-based prognostic classifiers have been published [1; 2; 3; 4; 5]; comparison of the 160 genes with those classifiers showed some overlapped genes. There are 8 genes overlapped with the classifier identified by Oberthuer et al [5] (CHAF1A, CNR1, FLJ20105, MAP7, PDE4DIP, PGM2L1, PMP22 and WSB1), 3 genes with Asgharzadeh et al [4] (CNR1, PGM2L1, and TMOD2), 2 genes with Schramm et al [2] (NEDD8 and PSMA6), 1 gene with Wei et al [1] (CNR1) and no overlap with the classifier of Ohira et al [3]. It is not too surprising to find that very few overlapped genes between the 160-gene classifier and other different classifiers. Several reasons may account for this, since these studies were performed using a heterogeneous set of samples with patients receiving different treatment protocols, tumor selection, sample number and sample preparation is playing an important role in the classifier identification. Because of the rarity of neuroblastoma incidence, sample numbers for current neuroblastoma published studies are limited when done in a single lab. Therefore the z-scoring method enables us to integrate data from different existing data into a metadata pool to identify a prognostic gene signature.
During recent years microarray technology has made it possible and relatively affordable for scientists to study gene expression on a global scale. More and more microarray gene expression data have been deposited in public databases for scientists to share. Exploring the methods to standardize the data from different sources and different platforms and to make data comparable and data integration possible will be necessary, especially for studies of rare diseases such as neuroblastoma where lack of sufficient samples to perform large studies. In addition, to perform a large study in a single lab using a single platform is technically challenging because of preferences for different technologies in individual labs and the continuing evolution of microarray technology. Therefore data integration may be a strategy for retrieval of the best gene signature.
In summary, we used z-scoring method to integrate the neuroblastoma prognosis data sets from different platforms; the effect of platform was eliminated to the minimal level and the greatest signal was due to prognosis. Using ANN analysis and a leave-one-out strategy to predict the patient’s prognosis we found that more than 90% of samples are independent of platform. The top-ranked 160 genes from ANN may have a relevance to biology. The ANN classifier trained for these genes with our combined cross-platform data could predict the prognosis of 102 independent test samples with pretty high accuracy. Our study showed that gene expression studies performed in different platforms could be integrated for prognosis analysis after removing variation resulting from different platforms.
Materials and Methods
Tumor samples and microarray experiments
Forty-two pretreatment primary neuroblastoma tumor samples from patients with outcome information were obtained retrospectively from three sources [1]. Patients were divided into two outcome groups: the “good-outcome” (Alive) group had event-free survival (i.e., neither relapses nor neuroblastoma progression) for at least 3 years (n=26), and “poor-outcome” (Dead) died due to neuroblastoma disease (n=16). Total RNA from seven human cancer cell lines (CHP212, RD, HeLa, A204, K562, RDES, and CA46) was pooled in equal portions to constitute a reference RNA, which was used in all of the cDNA microarrray experiments. RNA preparation and cDNA microarray experiment was done as previously described [1]. The same RNAs were used for Affymetrix microarray experiments. Biotinylated cRNA was synthesized and hybridized to Affymetrix Genechip U133 set (HG-U133A and HG-U133B arrays; Affymetrix, Santa Clara, CA) according to the Affymetrix protocol. For the Xenograft data a total 42 experiments of preclinical pediatric xenograft samples was analyzed (22 experiments on custom cDNA array from our laboratory [14] and 20 experiments on Affymetrix human U133plus2 array platform from an independent laboratory [15]). The data came from three pediatric cancer types: Neuroblastoma (NB), Rhabdomyosarcoma (RMS) and Ewing’s sarcoma (EWS) (Supplemental Table 4).
Data processing
A total of 42,578 cDNA clones were printed on our in-house cDNA array. The cDNA gene expression ratios between tumor RNA and reference RNA on each microarray were normalized using a pin-based normalization method [1]. In order to include only high quality data in the analysis, the quality of each individual cDNA spot was calculated as previously described [1]. Spots with an average quality across all samples less than 0.95 were excluded from the analysis. For neuroblastoma data, a total of 37668 clones representing 33180 Unigene clusters passed this quality filter. For neuroblastoma data on Affymetrix gene chip, we exported. CEL files from Affymetrix GCOS software and normalized in dChip [17] to the median intensity using the PM-only model. To get Affymetrix gene expression ratios, the expression values of samples obtained from dChip normalization process were divided by the median value of the whole array. We used 10% present call filter and removed the probe sets with the present calls less than 10% across all samples; a total of 33647 probes representing 31124 Unigene clusters remained for the further analysis.
Data analysis
For comparison between neuroblastoma data from cDNA and Affymetrix arrays we used UniGene cluster ID (Build #191) as the common identifier between the platforms. In case of multiple probes representing the same Unigene cluster, the probe with the top correlation (Pearson correlation) between cDNA and Affymetrix arrays was kept for the analysis. A total of 12442 Unigenes were common to both platforms and used for the analysis. The data was log2 transformed and z-score normalization was performed across samples for each gene separately in each data set. The two data sets were then combined using the common identifier for prognosis analysis. For the published data set by Asgharzadeh et al [4], we extracted the data from Gene Expression Omnibus (GEO accession number GSE3446; http://www.ncbi.nlm.nih.gov/geo/) which included 102 samples (56 samples have no disease relapse for at least 5 years from diagnosis; 46 samples have disease relapse). They are all metastatic neuroblastoma without MYCN amplification. The data has been normalized by authors; therefore we directly used the data for the analysis. A two-way ANOVA was applied to quantify the impact of platform and prognosis on gene expression. Gene ontology (GO) analysis was performed using EASE tool from David bioinformatics resources (http://david.abcc.ncifcrf.gov/). The whole set of 12442 genes was used as the background list. The list of genes with high expression in good or poor prognosis group was run separately to evaluate the enrichment of GO categories represented in each gene list.
Analysis using Architecture of Artificial Neural Networks (ANNs)
We used principal component analysis (PCA) and reduced the dimensionality of the data to the top 10 PCs as inputs for ANNs. This procedure reduced the number of variables to 10 to avoid over-fitting the data which occurs when the number of variables exceeds the number of samples. We used feed-forward resilient back-propagation multi-layer perceptron ANNs [1; 18] (coded in Matlab, The Mathworks, Natick, MA) with 3 layers: an input layer of the top 10 principal components (PCs) of the data; a hidden layer with 5 nodes; and an output layer generating a committee vote that discriminates two classes (i.e., good- and poor-outcome groups). Average ANN committee votes were used to classify samples, and 0.5 was used as the decision boundary for ANN prediction throughout the study. The ideal vote was 0 for the good-outcome group (alive), and 1 for the poor-outcome group (dead). We trained the ANNs and predicted NB outcomes using an 8-fold cross validation scheme in all analyses similar as described previously [1].
Statistical analysis for evaluation of prognosis in survival
The probability of survival was calculated using the Kaplan-Meier method, and the significance of the difference between Kaplan-Meier curves was calculated using the log-rank test.
Web-based Database
We have released the gene expression data of 42 neuroblastoma samples generated on both cDNA array and Affymetrix U133AB set platforms in an online searchable database (http://pob.abcc.ncifcrf.gov/cgi-bin/JK). The two-way ANOVA analysis results as well as ANN ranking information were also included in the database. The web-interface offers a broad variety of options for data query and visualization.
Supplementary Material
Acknowledgments
We thank Drs. John Maris, Wendy London of the Children’s Oncology Group (COG), Steven Qualman of the Cooperative Human Tissue Network (CHTN), Daniel Catchpoole at the Children’s Hospital at Westmead, Australia, Frank Westermann, Manfred Schwab of German Cancer Research Center and Frank Berthold, University of Cologne, Germany for the tumor samples and patient demographic information. We thank Drs. Christopher L. Morton, Malcolm A. Smith, and Peter J. Houghton for providing us the preclinical pediatric xenograft data generated on Affymetrix platform. This research was supported by the Intramural Research Program of the NIH, National Cancer Institute, Center for Cancer Research. It has been funded in whole or in part with federal funds from the National Cancer Institute, National Institutes of Health, under contract N01-CO-12400. The content of this publication does not necessarily reflect the views or policies of the Department of Health and Human Services, nor does mention of trade names, commercial products, or organizations imply endorsement by the U.S. Government.
References
- 1.Wei JS, Greer BT, Westermann F, Steinberg SM, Son CG, Chen QR, Whiteford CC, Bilke S, Krasnoselsky AL, Cenacchi N, Catchpoole D, Berthold F, Schwab M, Khan J. Prediction of clinical outcome using gene expression profiling and artificial neural networks for patients with neuroblastoma. Cancer Res. 2004;64:6883–91. doi: 10.1158/0008-5472.CAN-04-0695. [DOI] [PMC free article] [PubMed] [Google Scholar]
- 2.Schramm A, Schulte JH, Klein-Hitpass L, Havers W, Sieverts H, Berwanger B, Christiansen H, Warnat P, Brors B, Eils J, Eils R, Eggert A. Prediction of clinical outcome and biological characterization of neuroblastoma by expression profiling. Oncogene. 2005;24:7902–12. doi: 10.1038/sj.onc.1208936. [DOI] [PubMed] [Google Scholar]
- 3.Ohira M, Oba S, Nakamura Y, Isogai E, Kaneko S, Nakagawa A, Hirata T, Kubo H, Goto T, Yamada S, Yoshida Y, Fuchioka M, Ishii S, Nakagawara A. Expression profiling using a tumor-specific cDNA microarray predicts the prognosis of intermediate risk neuroblastomas. Cancer Cell. 2005;7:337–50. doi: 10.1016/j.ccr.2005.03.019. [DOI] [PubMed] [Google Scholar]
- 4.Asgharzadeh S, Pique-Regi R, Sposto R, Wang H, Yang Y, Shimada H, Matthay K, Buckley J, Ortega A, Seeger RC. Prognostic significance of gene expression profiles of metastatic neuroblastomas lacking MYCN gene amplification. J Natl Cancer Inst. 2006;98:1193–203. doi: 10.1093/jnci/djj330. [DOI] [PubMed] [Google Scholar]
- 5.Oberthuer A, Berthold F, Warnat P, Hero B, Kahlert Y, Spitz R, Ernestus K, Konig R, Haas S, Eils R, Schwab M, Brors B, Westermann F, Fischer M. Customized oligonucleotide microarray gene expression-based classification of neuroblastoma patients outperforms current clinical risk stratification. J Clin Oncol. 2006;24:5070–8. doi: 10.1200/JCO.2006.06.1879. [DOI] [PubMed] [Google Scholar]
- 6.Larkin JE, Frank BC, Gavras H, Sultana R, Quackenbush J. Independence and reproducibility across microarray platforms. Nat Methods. 2005;2:337–44. doi: 10.1038/nmeth757. [DOI] [PubMed] [Google Scholar]
- 7.Irizarry RA, Warren D, Spencer F, Kim IF, Biswal S, Frank BC, Gabrielson E, Garcia JG, Geoghegan J, Germino G, Griffin C, Hilmer SC, Hoffman E, Jedlicka AE, Kawasaki E, Martinez-Murillo F, Morsberger L, Lee H, Petersen D, Quackenbush J, Scott A, Wilson M, Yang Y, Ye SQ, Yu W. Multiple-laboratory comparison of microarray platforms. Nat Methods. 2005;2:345–50. doi: 10.1038/nmeth756. [DOI] [PubMed] [Google Scholar]
- 8.Bammler T, Beyer RP, Bhattacharya S, Boorman GA, Boyles A, Bradford BU, Bumgarner RE, Bushel PR, Chaturvedi K, Choi D, Cunningham ML, Deng S, Dressman HK, Fannin RD, Farin FM, Freedman JH, Fry RC, Harper A, Humble MC, Hurban P, Kavanagh TJ, Kaufmann WK, Kerr KF, Jing L, Lapidus JA, Lasarev MR, Li J, Li YJ, Lobenhofer EK, Lu X, Malek RL, Milton S, Nagalla SR, O’Malley PJ, Palmer VS, Pattee P, Paules RS, Perou CM, Phillips K, Qin LX, Qiu Y, Quigley SD, Rodland M, Rusyn I, Samson LD, Schwartz DA, Shi Y, Shin JL, Sieber SO, Slifer S, Speer MC, Spencer PS, Sproles DI, Swenberg JA, Suk WA, Sullivan RC, Tian R, Tennant RW, Todd SA, Tucker CJ, Van Houten B, Weis BK, Xuan S, Zarbl H. Standardizing global gene expression analysis between laboratories and across platforms. Nat Methods. 2005;2:351–6. doi: 10.1038/nmeth754. [DOI] [PubMed] [Google Scholar]
- 9.Schlingemann J, Habtemichael N, Ittrich C, Toedt G, Kramer H, Hambek M, Knecht R, Lichter P, Stauber R, Hahn M. Patient-based cross-platform comparison of oligonucleotide microarray expression profiles. Lab Invest. 2005;85:1024–39. doi: 10.1038/labinvest.3700293. [DOI] [PubMed] [Google Scholar]
- 10.Mah N, Thelin A, Lu T, Nikolaus S, Kuhbacher T, Gurbuz Y, Eickhoff H, Kloppel G, Lehrach H, Mellgard B, Costello CM, Schreiber S. A comparison of oligonucleotide and cDNA-based microarray systems. Physiol Genomics. 2004;16:361–70. doi: 10.1152/physiolgenomics.00080.2003. [DOI] [PubMed] [Google Scholar]
- 11.Jarvinen AK, Hautaniemi S, Edgren H, Auvinen P, Saarela J, Kallioniemi OP, Monni O. Are data from different gene expression microarray platforms comparable? Genomics. 2004;83:1164–8. doi: 10.1016/j.ygeno.2004.01.004. [DOI] [PubMed] [Google Scholar]
- 12.Tan PK, Downey TJ, Spitznagel EL, Jr, Xu P, Fu D, Dimitrov DS, Lempicki RA, Raaka BM, Cam MC. Evaluation of gene expression measurements from commercial microarray platforms. Nucleic Acids Res. 2003;31:5676–84. doi: 10.1093/nar/gkg763. [DOI] [PMC free article] [PubMed] [Google Scholar]
- 13.Benito M, Parker J, Du Q, Wu J, Xiang D, Perou CM, Marron JS. Adjustment of systematic microarray data biases. Bioinformatics. 2004;20:105–14. doi: 10.1093/bioinformatics/btg385. [DOI] [PubMed] [Google Scholar]
- 14.Whiteford CC, Bilke S, Greer BT, Chen Q, Braunschweig TA, Cenacchi N, Wei JS, Smith MA, Houghton P, Morton C, Reynolds CP, Lock R, Gorlick R, Khanna C, Thiele CJ, Takikita M, Catchpoole D, Hewitt SM, Khan J. Credentialing preclinical pediatric xenograft models using gene expression and tissue microarray analysis. Cancer Res. 2007;67:32–40. doi: 10.1158/0008-5472.CAN-06-0610. [DOI] [PubMed] [Google Scholar]
- 15.Neale G, Su X, Morton CL, Phelps D, Gorlick R, Lock RB, Reynolds CP, Maris JM, Friedman HS, Dome J, Khoury J, Triche TJ, Seeger RC, Gilbertson R, Khan J, Smith MA, Houghton PJ. Molecular characterization of the pediatric preclinical testing panel. Clinical Cancer Res. doi: 10.1158/1078-0432.CCR-07-5090. (in Press) [DOI] [PMC free article] [PubMed] [Google Scholar]
- 16.Mecham BH, Klus GT, Strovel J, Augustus M, Byrne D, Bozso P, Wetmore DZ, Mariani TJ, Kohane IS, Szallasi Z. Sequence-matched probes produce increased cross-platform consistency and more reproducible biological results in microarray-based gene expression measurements. Nucleic Acids Res. 2004;32:e74. doi: 10.1093/nar/gnh071. [DOI] [PMC free article] [PubMed] [Google Scholar]
- 17.Li C, Wong WH. Model-based analysis of oligonucleotide arrays: expression index computation and outlier detection. Proc Natl Acad Sci U S A. 2001;98:31–6. doi: 10.1073/pnas.011404098. [DOI] [PMC free article] [PubMed] [Google Scholar]
- 18.Hasenauer H, Merkl D, Weingrthner M. Estimating tree mortality of Norway spruce stands with neural networks. Advances Environ Res. 2001;5:405–414. [Google Scholar]
Associated Data
This section collects any data citations, data availability statements, or supplementary materials included in this article.