

Abstract
Correct phosphorylation site assignment is a critical aspect of phosphoproteomic analysis. Large-scale phosphopeptide data sets that are generated through liquid chromatography-coupled tandem mass spectrometry (LC-MS/MS) analysis often contain hundreds or thousands of phosphorylation sites that require validation. To this end, we have created PhosphoScore, an open-source assignment program that is compatible with phosphopeptide data from multiple MS levels (MSn). The algorithm takes into account both the match quality and normalized intensity of observed spectral peaks compared to a theoretical spectrum. PhosphoScore produced >95% correct MS2 assignments from known synthetic data, >98% agreement with an established MS2 assignment algorithm (Ascore), and >92% agreement with visual inspection of MS3 and MS4 spectra.
INTRODUCTION
Phosphoproteomics is quickly emerging as a major area of focus in protein mass spectrometry. Several recent works 1–7 highlight the increasing interest and success in this field. There are, however, a number of computational obstacles for post-MS-acquisition analysis of phosphoproteomic data, including phosphopeptide filtering, false positive rate estimation and phosphorylation site assignment. To address some of these issues, we recently developed a software utility called PhosphoPIC 8. However, this program did not include a phosphorylation site assignment tool. The objective of the current work was to develop such a tool. Thus far the predominant software available for assigning phosphorylation sites in a Sequest environment has been the Ascore algorithm 9, which utilizes a probabilistic approach based on the number and intensity of “site determining” ions. While Ascore can successfully assign phosphorylation sites from MS2 data, the program is not configured to handle MS3 or higher level data files that are obtained with the neutral loss scanning approach to LC-MS/MS phosphopeptide analysis. Since MS3 and MS4 spectra are often of higher quality and may contain unique phosphopeptide identifications when compared with MS2 data 7,8,10, we have developed a software tool, PhosphoScore, to predict phosphorylation site assignments for all levels of fragmentation spectra.
The PhosphoScore algorithm utilizes an objective function (“cost function”) that takes into account both the match quality and normalized intensity of observed spectral peaks compared to a theoretical spectrum 11,12. For optimized performance with different types of data sets, the program implements Gibbs sampling 13 to search parameter space. The software also incorporates a confidence score (D-score) to each assignment. The D-score reflects the cost difference between the first and second place phosphorylation configurations and allows the user to reject certain assignments as “ambiguous” if they fall below this value. We validated this algorithm on data derived from synthetic phosphopeptides with known phosphorylation sites as well as on large-scale unknown phosphopeptide data sets from native kidney collecting duct and HeLa cells.
METHODS
PhosphoScore Tree Algorithm
The mechanism by which PhosphoScore matches actual and theoretical spectra is conceptualized in Figure 1. For a given fragment ion and charge state, the position of its peak in a theoretical spectrum (m/z ratio) is dependent on the sum of the residue masses of all amino acids contained in its peptide sequence. For a phosphopeptide, the position of a peak can change depending on the phosphorylation of the amino acids within the sequence. In an MS3 spectrum, for example, a particular serine or threonine residue in the peptide sequence can be phosphorylated (+80 Da), undergo neutral loss (−18 Da), or remain unmodified, which results in three possible locations of a theoretical peak that includes that particular serine or threonine. Since phosphotyrosine residues do not normally undergo neutral loss, the position of a theoretical peak that includes tyrosine would have two possible locations corresponding to the unmodified residue and the phosphorylated form (+80 Da). Building a theoretical fragmentation spectrum then entails construction of a tree to determine the predicted positions of each mass peak for all possible phosphorylation states (Figure 1A). Each level of the tree represents addition of an amino acid residue. At the root of the tree resides the residue mass of the first amino acid (N-terminal residue for b-ion series, C-terminal residue for y-ion series). The next node of the tree represents the residue mass of the first amino acid plus the residue mass of the second amino acid. When a serine, threonine or tyrosine amino acid is found, up to three nodes are spawned. This process is repeated until the last nodes (leaves) of the tree are reached, corresponding to the last amino acid in the sequence. PhosphoScore constructs a tree from the root to the leaves, assigning weights to each node based on the cost function (dependent on both intensity and location of the actual peak relative to the theoretical peak), and finding the lowest cost path through the tree (yellow path in Figure 1). The lowest cost path can then be interpreted as the peptide sequence containing the most likely phosphorylation site assignments. For simplicity, Figure 1A describes a tree for only the b ion series from a single charge state, for which the theoretical spectrum is shown in Figure 1B. However, during an actual PhosphoScore analysis, all ions (b and y) and present charge states (+1, +2, and +3) are 5 combined into one tree, and the lowest cost path of this combined tree is used to assign phosphorylation sites.
Figure 1. The PhosphoScore tree algorithm.

A) Graphical representation of the cost tree for the phosphopeptide PQSVTLK (+1) where both S and T residues are potential sites of phosphorylation. In this example, the tree is built from N- to C-terminus using only b ions. (y ions and alternate charge states have been left out for clarity.) Only certain paths are viable (blue and yellow paths), due to the constraints imposed by the precursor ion mass. The path with the lowest cumulative cost (yellow) is considered as having the correctly assigned phosphorylation site as residue S, not T. B) Theoretical b-ion series MS2 spectrum of the hypothetical phosphopeptide with sequence PQSVTLK where S is phosphorylated.
PhosphoScore Cost Algorithm
The cost function is intended to model mathematically how well an observed peak in the spectrum would match to the theoretical peak. The closer an observed peak is to a theoretical peak, and the more intense it is on the spectrum, the more likely it is that the observed peak is a bona fide match to the theoretical peak. Previous studies such as PepHMM 11 and SCOPE 12 have shown two important characteristics about ion matching that are used as the basis for the cost function. First, it was observed that the distribution of the tolerance in m/z of an observed peak to a theoretical peak has an approximately normal distribution. Second, the distribution of the peak intensity for matches is exponential. Therefore, we calculate the cost, C, of each peak as:
This equation defines the cost as the sum of two terms that are weighted by the parameters ωMatch and ωIntensity, based on the observed m/z (Mobs) and the normalized intensity of the peak (Pobs), respectively.
The first term measures how well an observed peak matches a theoretical peak. This match term is based on the area above the normal distribution curve from the observed m/z (Mobs) (defined as x), to the theoretical m/z (defined as the mean μ) (Figure 2), with a closer match indicated by a smaller area and, hence, lower cost. In this equation, σ is the standard deviation and is derived from the match tolerance which is in turn dependent on the mass accuracy of the mass spectrometer used for acquisition. For our purposes the match tolerance was set to ±1000 ppm to reflect the mass accuracy of the Thermo LTQ (linear ion trap) mass spectrometer. The standard deviation of the normal function is always set as half of the match tolerance (e.g. 500 ppm), which means that within 2 standard deviations, 95.4% of the area under the normal curve is contained within the match tolerance.
Figure 2. Graphical representation of the match term of the cost function.

The difference between the theoretical and observed m/z of a particular peak determines the match cost for that peak and is equivalent to the shaded area above the curve in gray. The closer the observed peak is to the theoretical peak, the smaller the area and therefore the lower the cost.
The second term, Pobs, is either the peak intensity divided by the intensity of the largest peak in the spectrum (“relative intensity” mode) (Supplementary Figure 1A) or a value that is based on normalized rank where the highest intensity peak is given the highest score (1.0) and lower-intensity peaks are given progressively lower scores to a limit of 0 (“relative rank” mode) (Supplementary Figure 1B). “Relative rank” is the preferred intensity mode used by PhosphoScore that works best with a wide variety of data sets. In this study, ε had a value of 1 in all calculations, but in principle, this term can be varied. The values of the parameters ωMatch, ωIntensity, σ, and ε are all adjustable.
Default Cost
Another adjustable parameter is known as the “default cost”. A given peak is assigned the value of the default cost when there is no corresponding peak from the observed spectrum that is within the match tolerance (i.e. ±2 standard deviations from the mean of the normal distribution), or when the computed cost for a peak is more than the default cost. Practically, the default cost represents the highest value that can be assigned to a peak. By lowering the default cost, we can adjust the minimum quality match that we want to be considered in the final cost of the peptide. This property of PhosphoScore allows for adjustable match quality and is exploited during Gibbs sampling in order to find the optimal values for the parameters that will yield the highest number of correct phosphorylation assignments. See Supplementary Methods for a detailed explanation on varying the default cost.
PhosphoScore Statistics
PhosphoScore places a level of confidence in the resulting phosphopeptide assignment that enables a user to accept or reject that assignment when the phosphorylation sites cannot be determined with certainty. Each resulting peptide is assigned a Z-score and a D-score. The Z-score is an expression of how many standard deviations the lowest cost path is from the mean of all possible paths. In PhosphoScore, a lower Z-score (i.e. more negative) is better since the lowest cost path is below the mean. The D-score reflects how close the lowest cost path is to its nearest neighbor, which is similar in principle to the deltaCn parameter used by Sequest 14, a popular program for identifying peptides through spectral matching. The D-score is computed by taking the difference between the two best paths and dividing by the cost of the best path. For our data, we found that a D-score threshold of 1% gave consistent results (>95% accuracy) without the need for setting an additional Z-score threshold. A peptide assignment with a D-score above the threshold was accepted as a correct assignment, whereas any peptide not meeting the required threshold was rejected as indeterminate (“ambiguous”). However, it is worth noting that simply because the program labels an assignment as “ambiguous” does not mean that the correct prediction is unattainable. It is critical to go back and check ambiguous spectra through manual confirmation.
As the D-score is a user-defined value that can influence the number of assignments that are considered correct, it was also important to determine the sensitivity of this threshold. Figure 3 shows a sensitivity analysis for MS2-level data obtained from synthetic phosphopeptides corresponding to the water channel aquaporin-2 (AQP2). As can be seen from the graph, increasing the stringency of the D-score threshold allows maximization of the number of correct assignments at the expense of reducing overall sensitivity. Using a 1% D-score cutoff resulted in higher accuracy but at the loss of approximately 20% of peptides in the data set. A similar trend was seen in an analysis of a large-scale synthetic phosphopeptide library 9 kindly provided by Dr. Steven Gygi (Supplementary Figure 2).
Figure 3. Threshold sensitivity analysis for an MS2 data set with known phosphorylation sites.

The sensitivity of the threshold value in terms of the number of correct assignments above the threshold (blue) is shown against the number of peptides above the threshold (red). As the threshold is increased, the percentage of correct assignments increases slightly at the expense of a dramatic decrease in the total percentage of assignments above the D-score threshold, reducing the overall sensitivity of the analysis.
Parameter Estimation: Gibbs sampling
The cost function contains several parameters that can vary the cost of a node in the tree, and hence can greatly affect the final choice of phosphorylation sites. Choosing these parameters manually is difficult at best. Optimal parameter settings may change depending on differences in MS instrumentation setup, MS calibration, and composition of the peptide sample. Therefore, in order to find the parameters that will yield the highest number of correct phosphorylation assignments, PhosphoScore contains another tool called PhosphoGibbs, which implements a Gibbs sampling algorithm over the parameter space of the cost function to find the optimal parameters for a set of mass spectra.
Gibbs sampling 13 is a Markov Chain Monte Carlo method used to heuristically approach the maxima or minima of a function over a large parameter space. PhosphoGibbs attempts to find the average minimum match quality that can be used to distinguish correct peptides from incorrect peptides. As was discussed previously, the default cost controls what level of match quality we want to accept as a valid match. Therefore, we use the distance from the default cost, or “DC-distance” as the function to minimize. DC-distance is defined as the difference between the average cost of each amino acid in the peptide (i.e. total peptide cost divided by the number of amino acids in the peptide) and the default cost. As the distance between these two values decreases, poor quality matches are given the value of the default cost. The effect of varying the default cost on the quality of the dataset is demonstrated Figure 4. This figure shows that minimizing the DC-distance correlates with the number of correct phosphorylation assignments.
Figure 4. The relationship between DC-distance and the number of correct phosphorylation assignments.
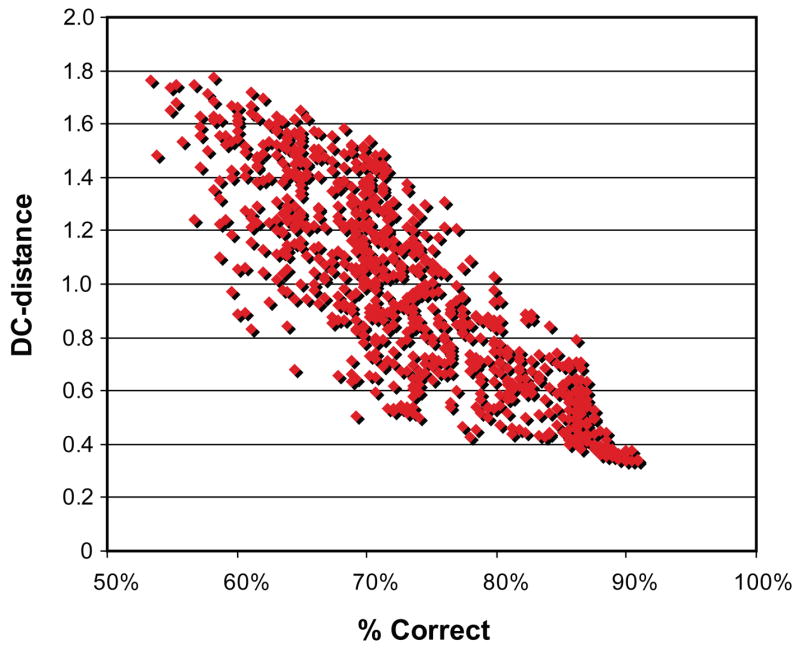
Each point represents a run of PhosphoScore with random parameters in the cost function. As the DC-distance of the data set is minimized, the number of correct assignments increases.
To begin a PhosphoScore analysis using Gibbs sampling optimization, the user defines the minimum and maximum bounds for each parameter or chooses the default values. All subsequent steps are automated. Arbitrary initial values within defined parameter bounds are chosen for each parameter of the cost function. PhosphoScore is run on the entire data set with the chosen parameter values. Next, a new value in the parameter bounds is chosen for one parameter, and the program is run again. If the new value of this single parameter decreases the average DC-distance of the data set, the new value is kept. Otherwise the value of that parameter reverts back to the previous value and a new value for another parameter is chosen. This process continues for a set number of iterations, or until convergence on the minimum DC-distance has been achieved.
Technical Details
PhosphoScore was written in Java. The program is accessible through a graphical user interface (GUI) (Supplementary Figure 7) or can be run from the command line. The input directory should contain all Sequest DTA and OUT files as well as the Sequest parameters (sequest.params) file from the original LC-MSn analysis. Data from different MS levels should be analyzed separately by PhosphoScore due to differences in Sequest search parameters. Please consult the “readme” file for more details on running the program. The PhosphoScore output is a tab-delimited text file listing the phosphorylation site assignments for each peptide in the dataset, along with the D-score, Z-score and the confidence of the resulting assignment. Currently only Sequest data files are supported. However, since PhosphoScore was written with a swappable interface, one could easily write an interface for a new type of data file and swap into the program with minimal effort. PhosphoScore, including source code, is freely available for non-profit use upon email request.
Isolation of phosphopeptides from rat liver
This experiment was conducted in accord with an animal protocol approved by the Animal Care and Use Committee of the National Heart, Lung, and Blood Institute (ACUC protocol number H-0110). A small piece (~ 0.5 cm3) of freshly isolated rat liver was minced and then sonicated in 3 ml 6M guanidine-HCl. Samples were spun at 16,000 × g to pellet cellular debris and the supernatant was saved for BCA protein assay (Pierce). The cleared liver lysate was reduced and alkylated as previously described 7. Serial dilutions (1 μg, 100 ng, and 10 ng) of either of 2 distinct, synthetic phosphorylated peptide standards (Biotin-LC-CEPDTDWEEREVRRRQpSVELHpSPQSLPRGSKA or Biotin-LC-CEPDTDWEEREVRRRQpSVELHSPQSLPRGpSKA) were added separately to 500 μg aliquots of liver sample prior to digestion with trypsin. Peptide samples were desalted on a 1 ml LB cartridge (Waters Oasis) and phosphopeptides were enriched via IMAC (Pierce Phosphopeptide Isolation Kit). Samples were desalted (C18 Ziptip, Millipore) and resuspended in 0.1% formic acid prior to analysis by mass spectrometry.
Mass Spectrometry and Database Searching
Isolated phosphopeptide samples were analyzed on an Agilent 1100 nanoflow system (Agilent Technologies, Palo Alto, CA) LC connected to a Finnigan LTQ FT mass spectrometer (Thermo Electron, San Jose, CA) equipped with a nanoelectrospray ion source. Samples were run using standard parameters for neutral loss scanning in both “LTQ-FT” and “LTQ only” modes 7. MS spectra were analyzed by using BIOWORKS software (Thermo Electron) running the Sequest search algorithm for peptide identification. Peak masses were searched against the most current version of the Rat Refseq Database (National Center for Biotechnology Information) with the following parameters: full trypsin specificity, 3 missed cleavages, LTQ peptide tolerance = 2.0 (0.05 for FT), fragment ion tolerance = 1.0, fixed carbamidomethylation of Cys, variable oxidation of Met, variable phosphorylation of Ser, Thr, and Tyr (+80 Da) for both MS2 and MS3 spectra, variable loss of water (− 18 Da) from Ser and Thr for MS3.
RESULTS
PhosphoScore was tested on “positive control” data sets consisting of synthetic phosphopeptides with known phosphorylation sites as well as on several previously published data sets of unknown phosphopeptides. PhosphoScore results files for all data sets described in this manuscript are available as Supplementary Data online. These files include complete sequence information, site assignments, and statistics for all identified phosphopeptides.
Analysis of Synthetic Aquaporin-2 Phosphopeptides
This data set consisted of two distinct, doubly-phosphorylated aquaporin-2 (AQP2) synthetic phosphopeptides separately spiked into liver cell lysates, a tissue that does not express AQP2 endogenously. The initial data set consisted of 356 unfiltered AQP2 identifications (208 from MS2 and 148 from MS3). Analysis of the data using default parameters resulted in 82.6% of MS2 peptides and 60.8% of MS3 peptides above the confidence threshold (D-score >1%). Of the peptide site assignments above the threshold, 93.0% of MS2 and 87.7% of MS3 peptides had their sites correctly predicted. Subsequent Gibbs sampling optimized the parameters to achieve higher assignment rates compared with those obtained when using the default parameters. Following Gibbs sampling, 73.1% of MS2 peptides were above the 1% D-score threshold, and 95.4% of these were correctly assigned. For MS3 peptides, 54.7% of peptides were above the 1% D-score threshold, with 88.9% of peptides having their phosphorylation sites correctly predicted. Since Gibbs sampling improved assignment accuracy, all remaining data sets were run using this option.
The MS2 portion of the AQP2 synthetic peptide data set was also run using an established MS2 phosphorylation site assignment program, Ascore (http://ascore.med.harvard.edu/ascore.php)9 for comparison. Of the 52.4% of MS2 peptides above the Ascore-defined threshold of 19 (i.e. >99% certainty of a correct assignment), 98.1% of these were correctly predicted (compared to 95.4% correct predictions from PhosphoScore). Although both programs demonstrated similar accuracy, PhosphoScore proved to have ~ 20% higher sensitivity than Ascore when assigning sites from this data set.
Analysis of a Large-scale Synthetic Phosphopeptide Library
Next we tested our software on a random sample of 380 MS2 peptides from a large-scale synthetic phosphopeptide library 9 kindly provided by Dr. Steven Gygi. Each peptide was of one of the forms GpSPXPXAXFEA, GAPXPXpSXFEA or ADZZSpSTZZFEAK, where X was one of the amino acids ADEFGLSTVY, and Z was one of the amino acids SDLFGHP. Of the 76.3% of peptides above threshold, PhosphoScore had a correct assignment rate of 96.6%. At multiple sensitivity thresholds, PhosphoScore consistently displayed higher accuracy compared to both deltaCn and cross correlation (XCorr) parameters of Sequest 14 (Figure 5A). For example, at 55% sensitivity (i.e. 55% of assignments were above threshold), PhosphoScore identified 98% of sites correctly, while XCorr correctly identified only 86%. This experiment supports prior evidence that the parameters used by Sequest are not optimized for analyzing phosphopeptide spectra 9 and demonstrates the need for additional scoring criteria.
Figure 5. Assessing the performance of PhosphoScore on large-scale phosphopeptide data sets.

A) Comparison of PhosphoScore and Sequest in correctly assigning phosphorylation sites from a large-scale synthetic phosphopeptide library. Overall, PhosphoScore assigns more correct identifications (accuracy) than either of the Sequest parameters (XCorr, dCn) throughout a wide sensitivity range. B) Comparison of PhosphoScore and Ascore analyses of MS2 data sets of unknown phosphopeptides (top table). Performance of PhosphoScore compared to visual inspection of MS2, MS3, and MS4 level spectra (bottom table).
Performance on data sets of unknown phosphopeptides
Finally, the performance of PhosphoScore was tested on phosphopeptide data sets from kidney inner medullary collecting duct (IMCD) 7,8 and HeLa cells 9. In these instances, the sites of phosphorylation were not known a priori. Therefore, PhosphoScore assignments were compared to results obtained through Ascore analysis for MS2 spectra (Figure 5B, top table; full version in Supplementary Table 1 online) or through visual inspection of spectra for higher MSn levels (Figure 5B, bottom table; full version in Supplementary Table 2 online). At a 1% D-score threshold, PhosphoScore agreed with Ascore on >98% of assignments and with visual inspection on >92% of assignments. Moreover, PhosphoScore successfully analyzed data that included both singly and multi-phosphorylated peptides from MS2, MS3, and MS4 levels.
DISCUSSION
In summary, we have developed PhosphoScore, a program which utilizes a cost function to assign peptide phosphorylation sites from large-scale data sets. The software is compatible with phosphopeptides identified using the Bioworks/Sequest platform. Through rigorous testing on both known and predicted phosphopeptide data sets, PhosphoScore demonstrated high accuracy in assigning correct phosphorylation sites. PhosphoScore displayed higher accuracy and sensitivity than Sequest in assigning sites from a large-scale synthetic phosphopeptide data set. In addition, PhosphoScore also demonstrated comparable performance to an established algorithm, Ascore (http://ascore.med.harvard.edu/ascore.php) 9, which assigns phosphorylation sites from MS2 spectra using a probability-based scoring method. PhosphoScore is also configured to handle data from higher MS levels (e.g. MS3, MS4) in addition to standard MS2 spectra, has multiple adjustable parameters for optimization and, depending on the data set, possesses comparable or higher sensitivity than Ascore. Another assignment program that is currently available is called MSQuant (http://msquant.sourceforge.net) 6,15. Unlike PhosphoScore, however, MSQuant is compatible with searches performed using Mascot, not with Sequest. Although these three programs perform the same basic function (i.e. phosphorylation site assignment), they can be viewed as complementary in that localization of the same phosphorylation site using different programs lends an added level of confidence to that prediction. Moreover, using assignment programs that are compatible with different search engines on the same sample set would permit localization of phosphorylation sites on phosphopeptides that may have been missed by using one particular search engine over another.
Supplementary Material
Supplementary Figure 1, an explanation of the intensity term of the cost function; Supplementary Figure 2, threshold sensitivity analysis of a large-scale synthetic phosphopeptide library; Supplementary Figures 3–6, an explanation of the default cost and match quality; Supplementary Figure 7, explanation of the PhosphoScore GUI.
summary of data sets analyzed by PhosphoScore.
Acknowledgments
We thank Dr. Sean Beausoleil and Dr. Steve Gygi for providing synthetic phosphopeptide and HeLa cell data sets as well as assistance with Ascore analysis. This work was supported by the National Heart, Lung, and Blood Institute intramural budget ZO1-HL001285.
Reference List
- 1.Molina H, Horn DM, Tang N, Mathivanan S, Pandey A. Global proteomic profiling of phosphopeptides using electron transfer dissociation tandem mass spectrometry. Proc Natl Acad Sci U S A. 2007;104(7):2199–2204. doi: 10.1073/pnas.0611217104. [DOI] [PMC free article] [PubMed] [Google Scholar]
- 2.Gruhler A, Olsen JV, Mohammed S, Mortensen P, Faergeman NJ, Mann M, Jensen ON. Quantitative phosphoproteomics applied to the yeast pheromone signaling pathway. Mol Cell Proteomics. 2005;4(3):310–327. doi: 10.1074/mcp.M400219-MCP200. [DOI] [PubMed] [Google Scholar]
- 3.Wolf-Yadlin A, Hautaniemi S, Lauffenburger DA, White FM. Multiple reaction monitoring for robust quantitative proteomic analysis of cellular signaling networks. Proc Natl Acad Sci U S A. 2007;104(14):5860–5865. doi: 10.1073/pnas.0608638104. [DOI] [PMC free article] [PubMed] [Google Scholar]
- 4.Cantin GT, Venable JD, Cociorva D, Yates JR., III Quantitative phosphoproteomic analysis of the tumor necrosis factor pathway. J Proteome Res. 2006;5(1):127–134. doi: 10.1021/pr050270m. [DOI] [PMC free article] [PubMed] [Google Scholar]
- 5.Beausoleil SA, Jedrychowski M, Schwartz D, Elias JE, Villen J, Li J, Cohn MA, Cantley LC, Gygi SP. Large-scale characterization of HeLa cell nuclear phosphoproteins. Proc Natl Acad Sci U S A. 2004;101(33):12130–12135. doi: 10.1073/pnas.0404720101. [DOI] [PMC free article] [PubMed] [Google Scholar]
- 6.Olsen JV, Blagoev B, Gnad F, Macek B, Kumar C, Mortensen P, Mann M. Global, in vivo, and site-specific phosphorylation dynamics in signaling networks. Cell. 2006;127(3):635–648. doi: 10.1016/j.cell.2006.09.026. [DOI] [PubMed] [Google Scholar]
- 7.Hoffert JD, Pisitkun T, Wang G, Shen RF, Knepper MA. Quantitative phosphoproteomics of vasopressin-sensitive renal cells: regulation of aquaporin-2 phosphorylation at two sites. Proc Natl Acad Sci U S A. 2006;103(18):7159–7164. doi: 10.1073/pnas.0600895103. [DOI] [PMC free article] [PubMed] [Google Scholar]
- 8.Hoffert JD, Wang G, Pisitkun T, Shen RF, Knepper MA. An automated platform for analysis of phosphoproteomic datasets: application to kidney collecting duct phosphoproteins. J Proteome Res. 2007;6(9):3501–3508. doi: 10.1021/PR0701153. [DOI] [PMC free article] [PubMed] [Google Scholar]
- 9.Beausoleil SA, Villen J, Gerber SA, Rush J, Gygi SP. A probability-based approach for high-throughput protein phosphorylation analysis and site localization. Nat Biotechnol. 2006;24(10):1285–1292. doi: 10.1038/nbt1240. [DOI] [PubMed] [Google Scholar]
- 10.Lu B, Ruse C, Xu T, Park SK, Iii JY. Automatic validation of phosphopeptide identifications from tandem mass spectra. Anal Chem. 2007;79(4):1301–1310. doi: 10.1021/ac061334v. [DOI] [PMC free article] [PubMed] [Google Scholar]
- 11.Wan Y, Yang A, Chen T. PepHMM: a hidden Markov model based scoring function for mass spectrometry database search. Anal Chem. 2006;78(2):432–437. doi: 10.1021/ac051319a. [DOI] [PubMed] [Google Scholar]
- 12.Bafna V, Edwards N. SCOPE: a probabilistic model for scoring tandem mass spectra against a peptide database. Bioinformatics. 2001;17(Suppl 1):S13–S21. doi: 10.1093/bioinformatics/17.suppl_1.s13. [DOI] [PubMed] [Google Scholar]
- 13.Geman S, Geman D. Stochastic relaxation, Gibbs distribution and the Bayesian restoration of images. IEEE Transactions on Pattern Analysis and Machine Intelligence. 1984;6(6):721–741. doi: 10.1109/tpami.1984.4767596. [DOI] [PubMed] [Google Scholar]
- 14.Eng JK, McCormack AL, Yates JR. An approach to correlate tandem mass spectral data of peptides with amino acid sequences in a protein database. J Am Soc Mass Spectrom. 1994;5:976–989. doi: 10.1016/1044-0305(94)80016-2. [DOI] [PubMed] [Google Scholar]
- 15.Olsen JV, Mann M. Improved peptide identification in proteomics by two consecutive stages of mass spectrometric fragmentation. Proc Natl Acad Sci U S A. 2004;101(37):13417–13422. doi: 10.1073/pnas.0405549101. [DOI] [PMC free article] [PubMed] [Google Scholar]
Associated Data
This section collects any data citations, data availability statements, or supplementary materials included in this article.
Supplementary Materials
Supplementary Figure 1, an explanation of the intensity term of the cost function; Supplementary Figure 2, threshold sensitivity analysis of a large-scale synthetic phosphopeptide library; Supplementary Figures 3–6, an explanation of the default cost and match quality; Supplementary Figure 7, explanation of the PhosphoScore GUI.
summary of data sets analyzed by PhosphoScore.