

Abstract
This study tested the convergence of behavioral inhibition measures across emotional and non-emotional versions of the same go/no-go task in 85 college students. The two tasks differed only in the stimuli used for trial cues (i.e., circles versus facial expressions). Moderate correlations (r = .51 to r = .56) between commission errors across the emotional and non-emotional tasks support the construct validity of behavioral inhibition. Further, parametric manipulation of preceding context had comparable effects on performance on the two tasks. Responses were slower and more variable, commission errors were more numerous, and perceptual sensitivity was lower on the emotional than the non-emotional task. A bias for happy faces on the emotional task resulted in faster responses and more commission errors for happy than sad faces despite marginally greater sensitivity for the latter. These results suggest that the basic neuropsychological constructs of the original go/no-go task were preserved in the emotional adaptation.
Keywords: Behavioral inhibition, emotional bias, construct validity, go/no-go task
1. Introduction
Growing awareness of the interaction of emotional processing and behavioral inhibition has generated a proliferation of neuropsychological paradigms designed to differentially assess the impact of these processes (Mathews & McLeod, 1994). Most of these paradigms are variants of classic inhibition tasks in which the standard stimuli have been replaced with emotionally-charged words or images. One such task is the emotional go/no-go task, which was first described in a study of hemispheric specialization for face recognition (Reynolds & Jeeves, 1978), and is an adaptation of the classic go/no-go paradigm that has been used for decades to test behavioral inhibition in both animals (Mishkin & Pribram, 1955) and humans (Costantini & Hoving, 1973; White, 1981). The go/no-go paradigm involves a continuously presented series of stimuli composed of frequent “go” cues to which subjects respond as rapidly as possible and infrequent “no-go” cues to which subjects do not respond. The frequency of go cues (≥ 75%) creates a prepotent tendency to respond that must then be inhibited for no-go cues, thereby providing a measure of the ability to inhibit a prepotent response. The emotional go/no-go task yields the same measure of inhibition, but the substitution of affective stimuli for the letters or pictorial stimuli commonly used as go and no-go cues also permits analysis of performance in response to cues of different emotional valences (e.g., happy versus sad). Thus, the task not only provides a measure of behavioral inhibition, but also of the emotional modulation of this inhibition (Drevets & Raichle, 1998).
The emotional go/no-go task has been used extensively to test emotional processing in both healthy adults and patients with affective disorders. A series of studies that used a go/no-go task with affective words as stimuli found mood-congruent response biases in both manic and depressed patients, such that manic patients made faster responses to happy words on go trials, while depressed patients made faster responses to sad words (Murphy et al., 1999). The lack of comparable performance differences on no-go trials suggest that these emotional biases do not extend to inhibitory mechanisms. Rather, manic patients had difficulty inhibiting responses on no-go trials regardless of emotional valence, suggesting a general deficit in behavioral inhibition (Murphy et al., 1999). Subsequent neuroimaging studies with this task implicated the subgenual and rostral anterior regions of the cingulate gyrus in these emotional response biases (Elliott et al., 2004; Elliott, Rubinsztein, Sahakian, & Dolan, 2000, 2002). These studies also found activation of lateral orbitofrontal cortex when inhibiting responses to no-go cues of any valence (Elliott et al., 2000, 2002, 2004), although this activation was greater for sad than happy cues in patients with depression (Elliott et al., 2002) and mania (Elliott et al., 2004). Another study of healthy adults that used a go/no-go task with affective facial expressions as cues found slowed responses to fearful expressions that were associated with amygdala activation and difficulty inhibiting responses to happy faces that was inversely related to caudate nucleus activity (Hare, Tottenham, Davidson, Glover, & Casey, 2005). This study also noted consistent activation of a prefrontal region near the lateral orbitofrontal cortex during the inhibition of responses to no-go cues regardless of emotional valence.
Activation of the lateral orbitofrontal cortex by the behavioral inhibition component of the various emotional go/no-go tasks is not entirely consistent with the pattern of activation found with non-emotional go/no-go tasks. Neuroimaging studies with standard go/no-go tasks have generally localized behavioral inhibition to a more superior region of the ventral prefrontal cortex (Bunge, Dudukovic, Thomason, Vaidya, & Gabrielli, 2002; Durston, Thomas, Worden, Yang, & Casey, 2002a; Durston et al., 2002b). This discrepancy in anatomical localization raises questions about whether the emotional and non-emotional go/no-go tasks engage the same inhibitory processes. Even small changes in the performance demands of go/no-go tasks change the neural, and presumably cognitive, contributors to behavioral inhibition (Mostofsky et al., 2003). The use of affective stimuli and the resultant demands on affect recognition and discrimination in emotional go/no-go tasks may engage somewhat different inhibitory processes than the letters commonly used in standard go/no-go tasks. This matter has both research and clinical implications. From the research perspective, the construct validity of behavioral inhibition would be supported by the convergence of measures across the emotional and non-emotional go/no-go tasks. Clinically, the convergence of measures would support the use of the emotional go/no-go task to distinguish between affective disorders based on inhibitory deficits (e.g., Murphy et al., 1999) or to simultaneously test behavioral inhibition and emotional processing. The convergence or divergence of measures across emotional and non-emotional go/no-go tasks has never been directly tested.
The purpose of the present study was to test the convergence of measures of behavioral inhibition on emotional and non-emotional go/no-go tasks in a nonreferred sample of college students. The two versions of the go/no-go task used in this study have the same structure, timing parameters, trial order, and response demands, and provide identical measures of behavioral inhibition, differing only in the stimuli used for the go and no-go cues. This study tested the correlations between measures of behavioral inhibition (i.e., errors of commission on no-go trials), behavioral execution (i.e., reaction time [RT] on go trials), and attention (i.e., errors of omission on go trials) on the two versions of the go/no-go task. Correlations between performance measures on the two go/no-go tasks in the moderate range (r = .40 to r = .60) would support the convergent or construct validity of behavioral inhibition (Campbell & Fiske, 1959; Cronbach & Meehl, 1955).
Gender and age differences in the recognition of facial emotions may also influence the emotional modulation of behavioral inhibition. A female advantage in facial emotion processing has been reported during childhood and adolescence (McClure, 2000). However, gender effects in emotional facial processing in adults differ depending on the sex of the face stimuli (Erwin et al., 1992). Adult males were less sensitive to sad female faces than female adults, who in turn, showed greater sensitivity to emotional expressions in male than female faces. Gender and developmental effects on facial emotion recognition could reasonably be predicted to impact on performance on emotional go/no-go tasks, but have never been directly tested.
Recent variations of the go/no-go task have incorporated parametric manipulations in the design to test the effect of preceding context on behavioral inhibition. For example, Durston et al. (2002a, 2002b) parametrically manipulated the go/no-go task so that no-go trials were preceded by one, three, or five go trials and found that commission errors increased as a function of the number of preceding go trials in both children and adults. The prepotent tendency to respond presumably strengthened with every response made, which in turn, made it more difficult to inhibit this tendency on no-go trials. Although not directly tested, the effect of preceding context on inhibition may also be reflected in increasingly shorter RT with every response made on go trials. To further test the convergence of the emotional and non-emotional go/no-go tasks, the present study also compared the parametric effect of preceding context on behavioral inhibition and execution across the two tasks.
2. Method
2.1. Participants
Participants were 85 college students (62 females, 23 males) ranging in age from 18 to 66 years (mean = 26.12, SD = 10.83) who were enrolled in an introductory psychology course. The students were recruited via campus postings and participated in the study to fulfill a research requirement. The sample was 10.6% African-American, 49.4% Caucasian, 9.4% Hispanic, and 30.6% Asian or mixed ethnicity. All participants gave written informed consent. The study was approved by the Institutional Review Boards of Queens College and The Mount Sinai School of Medicine.
2.2. Procedures
Participants were tested individually in a quiet room by trained doctoral students in neuropsychology. They were first administered the Matrix Reasoning and Vocabulary subtests of the Wechsler Abbreviated Scale of Intelligence (WASI; Wechsler, 1999) to obtain an estimate of Full Scale IQ (FSIQ). Participants with an estimated FSIQ of 70 or higher were then briefly interviewed to exclude those with a history of head injury, substance abuse, and/or severe psychiatric disturbances. Participants also completed the Conners Adult ADHD Rating Scale-Self-Report: Long Version (CAARS; Conners, 1997) and the Wender Utah Rating Scale (WURS; Ward, Wender, & Reimherr, 1993) to provide measures of current and childhood problems with ADHD behaviors, respectively. Finally, the emotional and non-emotional go/no-go tasks were administered as part of a larger battery of five tests that included measures of verbal and spatial working memory, attention, and face priming. The order of presentation of the five tasks was counterbalanced across subjects, and all tasks were administered in a single testing session that lasted about 2 hours.
Psychometric information on the subjects is presented in Table 1. As can be seen, mean FSIQ estimate was in the average range. The mean score on the WURS was slightly above the suggested cut-off score of 17.9 for control subjects and four (4.7%) participants had a WURS score above the cut-off of 60.3 that is indicative of a childhood history of ADHD (Ward, et al., 1993). Mean f-scores on the CAARS were in the normal range, but 10 participants had t-scores greater than 65 (i.e., 1.5 SD above age and gender means) on the DSM-IV Inattention, DSM-IV Hyperactivity-lmpulsivity, and/or Total ADHD Symptoms scales, indicative of current difficulties in the clinically significant range.
Table 1.
Psychometric Characteristics of the Sample (N = 85)
| Measure | Mean | SD | Range |
|---|---|---|---|
| WASI | |||
| IQ estimate | 95.38 | 10.49 | 75–123 |
| Vocabulary T-score | 43.72 | 8.45 | 20–64 |
| Matrix Reasoning T-score | 50.82 | 8.20 | 24–79 |
| CAARS-S:L | |||
| DSM-IV Inattentive Scale | 49.88 | 10.73 | 33–85 |
| DSM-IV Hyperactive Scale | 46.65 | 8.10 | 33–66 |
| Total ADHD Symptoms | 48.59 | 10.03 | 30–76 |
| WURS total score | 18.64 | 14.66 | 1–63 |
Note: ADHD = attention-deficit/hyperactivity disorder; CAARS-S:L = Conners Adult ADHD Rating Scale-Self-Report: Long Version; WASI = Wechsler Abbreviated Scale of Intelligence; WURS = Wender Utah Rating Scale.
2.3. Go/No-Go Tasks
The emotional and non-emotional go/no-go tasks used in this study were compiled and run using E-Prime™ software (Psychology Software Tools, Inc., Pittsburgh, PA; Schneider, et al., 2002). The two tasks had the same structure, timing parameters, trial order, and response demands, and provided identical measures of behavioral inhibition, differing only in the stimuli used for the go and no-go cues. Both tasks required subjects to monitor four series of stimuli presented individually in the center of a computer screen and respond as rapidly as possible by pressing a mouse button to target stimuli (go cues), while withholding responses to non-target stimuli (no-go cues).
The emotional and non-emotional go/no-go tasks each consisted of four 192 second blocks. Each block contained 96 stimuli, of which 72 (75%) were go cues and 24 (25%) were no-go cues, resulting in a total of 288 go cues and 96 no-go cues for each task. Trial order for both versions of the task was determined by counterbalancing across all conditions in the emotional go/no-go task (e.g., trial type, facial expression, face ethnicity, face gender, face number). This counterbalancing ensured that each trial type followed every other trial type equally often and also embedded the parametric manipulation of the number of go cues preceding no-go cues (i.e., from 0 to 11 go cues) in the trial order. Stimuli were presented in the center of the screen for 500ms each. The interstimulus interval (ISI) was pseudorandomized from 1250 to 1750ms (mean per block = 1500ms) to discourage anticipatory responses. A fixation cross was displayed in the center of the screen during the ISI. Instructions were displayed on the computer screen at the beginning of each block and subjects pressed a mouse button when ready to begin.
2.3.1. Emotional Go/No-Go Task
The stimuli for go and no-go cues consisted of happy and sad facial expressions from 24 individuals (12 female, 12 male) selected from the MacBrain Face Stimulus Set available at www.macbrain.org. The facial expressions used as go and no-go cues are illustrated in Figure 1. Eight models (4 female, 4 male) were used from each of the following races: African-American, Asian, and Caucasian. All face stimuli had closed mouths. The images were normalized for size and luminance. Happy and sad facial expressions were alternated as go and no-go cues across the four blocks in an HSSH order, which resulted in equal numbers of happy and sad faces serving as go and no-go cues. This arrangement adds a set-shifting component to two of the blocks (one block each with happy and sad go cues), whereby subjects must stop responding to stimuli that were targets in the previous block and begin responding to stimuli that were previously non-targets. The number of commission errors on no-go trials across the whole task and on each of the two face emotion conditions (i.e., happy vs. sad) served as the measures of behavioral inhibition and emotional modulation of this inhibition, respectively. The mean RT on go trials for the two emotion conditions have previously been used as measures of emotional bias (Elliott et al., 2000, 2002, 2004; Hare et al., 2005; Murphy et al., 1999).
Fig. 1.
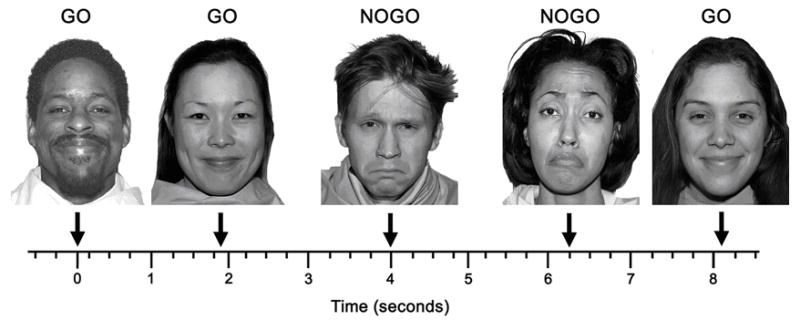
Schematic illustrating five trials of the emotional go/no-go task in which happy faces served as go cues and sad faces were no-go cues. Face images are from the MacBrain Face Stimulus Set available at www.macbrain.org.
2.3.2. Non-Emotional Go/No-Go Task
Green and red circles of the same approximate size and luminance as the facial expressions served as the stimuli for go and no-go cues, respectively. The go and no-go cues were not alternated in this version of the task (i.e., no set-shifting). The number of commission errors on no-go trials across all four blocks was defined as the primary measure of behavioral inhibition on the task.
2.4. Data Analysis
Commission errors on no-go trials in the non-emotional go/no-go task served as the gold standard for behavioral inhibition in these analyses. Commission errors, omission errors, RT, and RT standard deviation (RTSD) on the emotional go/no-go task were calculated for all face trials (regardless of expression) and separately for trials with happy versus sad face cues and trials in the set-shifting versus non-shifting conditions. The signal detection measures d′ and criterion (β) were also calculated using the formulas:
where z(H) and z(FA) represent the transformation of the hit (i.e., correct go trials) and false alarm (i.e., commission error) rates to z-scores. The variable d′ represents a measure of the perceptual sensitivity to different stimulus conditions that is independent from respondent biases. In contrast, criterion or β is a measure of these response biases and reflects the minimum level of internal certainty needed to decide that a particular stimulus was present. Thus, β provided a measure of bias towards happy and sad facial expressions in the emotional go/no-go task, with lower values indicating greater bias.
Performance differences on the emotional versus non-emotional go/no-go tasks and on the happy versus sad face and set-shifting versus non-shifting conditions were tested with paired-samples ttests. Pearson product-moment correlations were calculated between commission errors, omission errors, RT, and RTSD on the emotional and non-emotional go/no-go tasks, and age (in years). Gender and age differences in performance on the emotional go/no-go task were tested with 2 (Face Emotion) × 2 (Face Gender) × 2 (Participant Gender) × 2 (Age Group) mixed-factorial analyses of variance (ANOVA). The sample was divided into younger (mean age = 18.77 years, SD = 0.78) and older (mean age = 34.64 years, SD = 11.18) age groups using a median split on age (median = 20.0 years).
Commission errors on no-go trials and RT on go trials were also calculated for each level of the parametric manipulation (i.e., from 0 to 11 preceding go trials) embedded in the emotional and non-emotional go/no-go tasks. The 12 levels of the parametric manipulation were then collapsed into four levels that approximated those used by Durston et al. (2002a, 2002b), i.e., commission errors on no-go trials and RT on go trials following: (1) 0 go trials; (2) 1 or 2 go trials; (3) 3 or 4 go trials; and (4) 5 or more go trials. The parametric manipulation was tested across the emotional and non-emotional go/no-go tasks using 2 (Task) × 4 (Levels) repeated measures ANOVAs.
Statistical significance was set at the 0.01 level for all analyses to avoid type I errors due to the large number of tests. All probabilities were based on two-tailed tests. Values are expressed as mean ± SD.
3. Results
3.1. Performance measures
Performance measures on the emotional and non-emotional go/no-go tasks are presented in Table 2. Participants made significantly faster (t84 = 17.99, p < 0.001, η2 = 0.79) and less variable responses (t84 = 7.00, p < 0.001, η2 = 0.37), committed fewer commission errors (t84 = 11.57, p < 0.001, η2 = 0.61), and demonstrated greater perceptual sensitivity (t84 = 11.95, p < 0.001, η2 = 0.63) and less response bias (t84 = 13.29, p < 0.001, η2 = 0.68) on the non-emotional go/no-go task than for all face trials (regardless of expression) on the emotional version of the task. Performance on the emotional task was marked by significantly faster responses (t84 = 3.61, p = 0.001, η2 = 0.14), more commission errors (t84 = 4.69, p < 0.001, η2 = 0.21), and greater response bias (t84 = 3.61, p = 0.001, η2 = 0.18) on the happy face than the sad face condition. Differences in perceptual sensitivity to happy and sad face cues just missed significance (t84 = 2.73, p = 0.01, η2 = 0.07). Omission errors did not differ across the two tasks or the two face conditions of the emotional task (both p > 0.10). Responses were significantly more variable on the non-shifting than set-shifting conditions of the emotional task (t84 = 2.89, p = 0.005, η2 = 0.09), but did not differ in speed, accuracy, perceptual sensitivity, or response bias (all p > 0.10).
Table 2.
Performance on the Emotional and Non-Emotional Go/No-Go Tasks (N = 85)
| Emotional Go/No-Go
|
||||||||||||
|---|---|---|---|---|---|---|---|---|---|---|---|---|
| Non-Emotional Go/No-Go
|
All Faces
|
Happy Faces
|
Sad Faces
|
Set-Shifting
|
Non-Shifting
|
|||||||
| Variables | Mean | SD | Mean | SD | Mean | SD | Mean | SD | Mean | SD | Mean | SD |
| Commission (%) | 8.23 | 7.61 | 22.88 | 14.66 | 25.49 | 17.52 | 19.95 | 13.76 | 23.71 | 15.78 | 22.45 | 14.04 |
| Omission (%) | 0.81 | 3.91 | 2.74 | 6.64 | 2.01 | 3.62 | 3.52 | 11.09 | 2.55 | 7.27 | 2.13 | 4.29 |
| RT (ms) | 362 | 57 | 442 | 48 | 438 | 50 | 446 | 49 | 440 | 50 | 445 | 48 |
| RTSD (ms) | 79.7 | 30.6 | 96.5 | 29.3 | 95.8 | 32.0 | 95.5 | 31.2 | 92.0 | 30.5 | 99.1 | 31.6 |
| d′ | 4.38 | 0.90 | 3.13 | 0.91 | 3.13 | 0.93 | 3.32 | 0.99 | 3.22 | 1.05 | 3.21 | 0.94 |
| β | 1.58 | 0.60 | 0.83 | 0.51 | 0.74 | 0.64 | 0.96 | 0.56 | 0.83 | 0.60 | 0.87 | 0.54 |
Note: β = signal detection measure of response bias; d′ = signal detection measure of perceptual sensitivity; ms = millisecond; RT = reaction time; RTSD = reaction time standard deviation; SD = standard deviation
3.2. Correlations
Pearson product-moment correlations between percent commission errors, percent omission errors, mean RT, and RTSD across the non-emotional go/no-go task and different face conditions of the emotional go/no-go task are presented in Table 3. Commission errors, mean RT, and RTSD were significantly correlated across the non-emotional task and the all faces, happy face, and sad face conditions of the emotional task (all p < 0.001). In contrast, omission errors were not correlated across any conditions of the emotional and non-emotional tasks (all p > 0.10). Further, the inverse correlation between percent commission errors and mean RT was significant on the emotional task (r = −0.40, p < 0.001), but not the non-emotional task (r = −0.14, p > 0.10). Finally, performance measures on the go/no-go tasks were not correlated with IQ estimates or ratings on the CAARS and WURS (all p > 0.10) and only RT on the happy faces condition was correlated with age (r = 0.29, p = 0.008).
Table 3.
Correlation of the Non-Emotional Go/No-Go Task With Different Face Conditions of the Emotional Go/No-Go Task (N = 85)
| All Faces | Happy Faces | Sad Faces | |
|---|---|---|---|
| Commission errors | 0.56* | 0.56* | 0.51* |
| Omission errors | 0.01 | 0.03 | 0.01 |
| RT | 0.73* | 0.68* | 0.74* |
| RTSD | 0.73* | 0.63* | 0.74* |
Note: RT = reaction time; RTSD = reaction time standard deviation.
p < 0.001
3.3. Gender and age effects
Four-way ANOVAs that tested gender and age effects in emotional go/no-go task performance again found significantly faster responses (F1,81 = 9.74, p = 0.003, η2 = 0.11), more commission errors (F1,81 = 12.10, p = 0.001, η2 = 0.14), and greater response bias for happy face than sad face cues (F1,81 = 9.56, p = 0.003, η2 = 0.10). These ANOVAs also revealed a significant face emotion × face gender interaction effect on the signal detection measure d′ (F1,81 = 8.61, p = 0.004, η2 = 0.10). Perceptual sensitivity was greater for sad than happy female faces (3.56 ± 1.10 versus 3.14 ± 1.13), but was similar for sad and happy male faces (3.43 ± 1.13 versus 3.43 ± 1.00). There were no significant main effects or interactions for participant gender or age group on any performance measure (all p > 0.10).
3.4. Parametric manipulation
Separate two-way ANOVAs testing the effect of the parametric manipulation on commission errors and RT both yielded significant main effects for task (RT: F1,84 = 345.22, p < 0.001, η2 = 0.81; commission errors: F1,84 = 127.33, p < 0.001, η2 = 0.62) and for level (RT: F1,84 = 161.50, p < 0.001, η2 = 0.78; commission errors: F1,84 = 14.14, p < 0.001, η2 = 0.22). There was also a significant task x level interaction for RT (F1,84 = 21.99, p < 0.001, η2 = 0.30), but not for commission errors, (F1,84 = 2.52, p = 0.12, η2 = 0.04). As illustrated in Figure 2, post-hoc comparisons using Tukey’s Honestly Significant Difference tests revealed that the significant main effects for level were due to: (1) greater commission errors on no-go trials following 5 or more go trials than on no-go trials following 0, 1 to 2, and 3 to 4 go trials (p < 0.001); and (2) a significant linear decrease in RT as a function of preceding go trials (p < 0.001). The significant task × levels interaction for RT reflected a greater decline in RT on the emotional than the non-emotional go/no-go task following both 3 or 4 go trials and 5 or more go trials (p < 0.001).
Fig. 2. The effect of the parametric manipulation of preceding context on reaction time on go trials and commission errors on no-go trials.
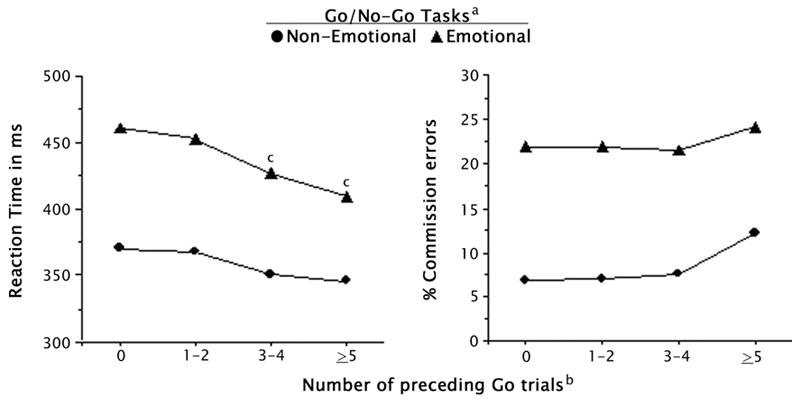
a Main effects for reaction time (F1,84 = 345.22, p < 0.001) and commission errors (F1,84 = 127.33, p < 0.001).
b Main effects for reaction time (F1,84 = 161.50, p < 0.001) and commission errors (F1,84 = 14.14, p < 0.001).
c Significant task x level interaction (F1,84 = 21.99, p < 0.001).
4. Discussion
These results provide evidence for moderate levels of convergence (r = .51 to r = .74) of performance measures across emotional and non-emotional versions of the same go/no-go task in a large nonreferred sample of young adults. Correlations between the percent of commission errors, the primary measure of behavioral inhibition, across the emotional and non-emotional tasks ranged from r = .51 to r = .56, comparable to those reported between several versions of the closely related continuous performance test (Borgaro et al., 2003), and sufficiently robust to support the convergent validity of behavioral inhibition on the go/no-go task (Campbell & Fiske, 1959; Cronbach & Meehl, 1955). These correlations support the use of the emotional go/no-go task to test behavioral inhibition in situations when emotional processing must be measured simultaneously (e.g., functional neuroimaging studies). Further, the inverse correlation between percent commission errors and mean RT on the emotional task is indicative of the accuracy for speed trade-off characteristic of go/no-go tasks. The lack of such a trade-off in the non-emotional task may reflect the relative ease of simple go/no-go tasks for most adults (i.e., floor effects) (Eigisti, et al., 2006).
The comparable effects that the parametric manipulation of preceding context had on performance across the emotional and non-emotional go/no-go tasks also suggests that the basic neuropsychological constructs of the original task were preserved in the emotional adaptation. The progressively faster responses on every consecutive go trial indicate that the prepotent tendency to respond increased as predicted on both tasks. However, unlike in the studies by Durston et al. (2002a, 2002b), the inhibition of the prepotent response tendency on no-go trials did not become more difficult until after five or more preceding go trials on both tasks. This discrepancy is likely to reflect the substantial differences in the go/no-go tasks used in the studies. Most importantly, the task in the Durston et al. (2002a, 2002b) studies was designed expressly to test the parametric manipulation of preceding context and all of the no-go trials were preceded by one, three, or five go trials. In contrast, trial order in the present task was counterbalanced to ensure that each trial type followed every other trial type equally often. Thus, no-go trials were equally likely to occur on any trial, preceded by anywhere from zero to 11 go trials. This and other task differences (e.g., long, fixed ISI vs. short, variable ISI) may have contributed to the discrepancies in the effect that the parametric manipulation of preceding context had on behavioral inhibition in the two studies.
The lack of correlation between percent commission errors on the two go/no-go tasks and ratings on the CAARS and WURS is consistent with research demonstrating a divergence in cognitive, behavioral, and personality measures of impulsiveness (Gerbing, Ahadi, & Patton, 1987; White, et al., 1994). Performance on cognitive tests of impulsivity have often been associated with measures of intelligence (Cheung, Mitsis, & Halperin, 2004; White, et al., 1994), although not in the present study, but have generally not been associated with ratings and self-reports of state- and trait-like impulsive behavior (Gerbing, et al., 1987; White, et al., 1994). This pattern of inter-correlations among the measures may reflect the different time periods sampled by the instruments (e.g., single test session in cognitive tests versus behavior over days, weeks, etc. in rating scales) or the fact that cognitive, behavioral, and personality measures capture overlapping but different manifestations of the multidimensional construct of impulsiveness (Evenden, 1999).
The moderate correlations between behavioral inhibition measures across the emotional and non-emotional go/no-go tasks also make it clear that the two tasks do not measure exactly the same cognitive processes. The increased complexity of the face stimuli in the emotional task than the circle cues used in the non-emotional task more than likely engaged such additional cognitive processes as face recognition and emotion perception. Accordingly, participants had more difficulty discriminating between signal and noise trials (i.e., go and no-go trials) on the emotional than the non-emotional task and consistently made slower and less accurate responses on the former. Unfortunately, the inclusion of control conditions and/or stimuli (e.g., gender discrimination task with neutral faces) that might have enabled us to more fully explain the differences in performance on the two go/no-go tasks was beyond the scope of this study and awaits further testing.
The performance differences in response to happy and sad faces on the emotional go/no-go task clearly demonstrates the effect of emotional information in biasing behavioral inhibition (Campos, Mumme, Kermoian, & Campos, 1994). These findings are partially consistent with the results of a previous study in healthy adults that reported greater difficulty inhibiting responses to happy faces than fearful or neutral faces from the same stimulus set used in this study (Hare et al., 2005). However, that study reported no difference in RT in response to happy and neutral faces. In contrast, the present study found significantly faster responses to happy than sad faces, consistent with research demonstrating that healthy adults recognize facial expressions of positive emotions (e.g., happy) faster than expressions of neutral or negative emotions (e.g., sad, angry, and disgusted) (Grimshaw, Bulman-Fleming, & Ngo, 2004; Leppanen & Hietanen, 2004). Facial expressions of happiness are associated with positive affect (Otta, Lira, Delevati, Cesar, & Pires, 1994) and approach behavior (Johansson & Ronnberg, 1996). Thus, it is not surprising that participants had greater difficulty inhibiting responses to happy than sad faces and that signal detection analyses revealed a bias for happy faces in the current study. However, the positive correlation between age and RT in response to happy faces specifically indicates that this bias may diminish with adult experience. These results support the use of the emotional go/no-go task to test the emotional biasing of behavioral inhibition.
Gender differences in facial emotion recognition have been described by some studies (Erwin et al., 1992; McClure, 2000), but not others (Grimshaw et al., 2004). The present study found no gender differences in performance on either go/no-go task, but did find performance differences based on the gender of the face stimuli in the emotional task. Specifically, male and female participants both had greater sensitivity for sad than happy female faces, but not for male faces. These results contrast with previous findings that female subjects had greater sensitivity overall to emotional expressions in male than female faces and that male subjects were less sensitive to sad female faces in particular (Erwin, et al., 1992). The differences in these findings may reflect differences in the stimulus sets used in the studies (e.g., racially diverse versus Caucasian only, inclusion of neutral expressions). However, additional experiments to explain the interactions between subject and stimulus gender were unfortunately beyond the scope of this study. The generally good perceptual sensitivity for all of the face stimuli in the emotional task, together with the relatively small differences in sensitivity for the happy and sad female faces, argue against restricting future studies with this stimulus set to only male faces or female faces of either happy or sad expressions.
It must be noted that any conclusions regarding the emotional go/no-go task drawn from the present results are limited by the lack of data on the current mood state of participants. Recent research has extended the findings of mood-congruent response biases from psychiatric patients (Elliott, et al., 2002, 2004; Murphy, et al., 1999) to otherwise healthy individuals who are at risk for anxiety and mood disorders (Pine, et al., 2005). These findings raise the possibility that attentional biases in the participants in this study, who were screened for psychiatric disorders, but not for subclinical mood disturbances or risk for psychopathology, may account for the slight preference and sensitivity for happy faces.
5. Conclusion
In summary, the moderate convergence of performance measures across emotional and non-emotional versions of the same go/no-go task supports the construct validity of behavioral inhibition and suggests that the basic constructs of the original go/no-go task were preserved in the emotional adaptation. At the same time, an emotional bias for happy faces was clearly evident in the faster responses and greater commission errors for happy than sad faces on the emotional task. This double dissociation in performance measures on the emotional go/no-go task, with commission errors on no-go trials providing a measure of behavioral inhibition, and RT differences across go trials with cues of different emotional valences offering an index of emotional preference or bias, supports the use of the emotional go/no-go task to test behavioral inhibition in settings when emotional processing must be measured simultaneously. However, unexplored gender and mood effects on performance suggest that the emotional go/no-go task will continue to be more of a research tool than part of a standard clinical battery for the time being.
Acknowledgments
This research was supported by grants K01 MH070892, R01 MH60698, R01 MH068206, and R21 MH066360 from the National Institute of Mental Health. We would like to acknowledge the help and support of the students in the Developmental Neuropsychology Laboratory at Queens College. Development of the MacBrain Face Stimulus Set was overseen by Nim Tottenham and supported by the John D. and Catherine T. MacArthur Foundation Research Network on Early Experience and Brain Development.
Footnotes
Publisher's Disclaimer: This is a PDF file of an unedited manuscript that has been accepted for publication. As a service to our customers we are providing this early version of the manuscript. The manuscript will undergo copyediting, typesetting, and review of the resulting proof before it is published in its final citable form. Please note that during the production process errors may be discovered which could affect the content, and all legal disclaimers that apply to the journal pertain.
References
- Borgaro S, Pogge DL, DeLuca VA, Bilginer L, Stokes J, Harvey PD. Convergence of different versions of the continuous performance test: Clinical and scientific implications. Journal of Clinical and Experimental Neuropsychology. 2003;25:283–292. doi: 10.1076/jcen.25.2.283.13646. [DOI] [PubMed] [Google Scholar]
- Bunge SA, Dudukovic NM, Thomason ME, Vaidya CJ, Gabrielli JDE. Immature frontal lobe contributions to cognitive control in children: Evidence from fMRI. Neuron. 2002;33:301–311. doi: 10.1016/s0896-6273(01)00583-9. [DOI] [PMC free article] [PubMed] [Google Scholar]
- Campbell DT, Fiske DW. Convergent and discriminant validation by the multitraitmultimethod matrix. Psychological Bulletin. 1959;56:81–105. [PubMed] [Google Scholar]
- Campos JJ, Mumme DL, Kermoian R, Campos RG. A functionalist perspective on the nature of emotion. Monographs of the Society for Research in Child Development. 1994;59:284–303. [PubMed] [Google Scholar]
- Cheung AM, Mitsis EM, Halperin JM. The relationship of behavioral inhibition to executive functions in young adults. Journal of Clinical and Experimental Neuropsychology. 2004;26:393–404. doi: 10.1080/13803390490510103. [DOI] [PubMed] [Google Scholar]
- Conners CK. Conners’ rating scales - revised, technical manual. Toronto: Multi-Health Systems; 1997. [Google Scholar]
- Costantini AF, Hoving KL. The relationship of cognitive and motor response inhibition to age and IQ. Journal of Genetic Psychology. 1973;123:309–319. doi: 10.1080/00221325.1973.10532690. [DOI] [PubMed] [Google Scholar]
- Cronbach LJ, Meehl PE. Construct validity in psychological tests. Psychological Bulletin. 1955;52:281–302. doi: 10.1037/h0040957. [DOI] [PubMed] [Google Scholar]
- Drevets WC, Raichle ME. Reciprocal suppression of regional cerebral blood flow during emotional versus higher cognitive processes: Implications for interactions between emotion and cognition. Cognition and Emotion. 1998;12:353–385. [Google Scholar]
- Durston S, Thomas KM, Worden MS, Yang Y, Casey BJ. An fMRI study of the effect of preceding context on inhibition. NeuroImage. 2002a;16:449–453. doi: 10.1006/nimg.2002.1074. [DOI] [PubMed] [Google Scholar]
- Durston S, Thomas KM, Yang Y, Ulug AM, Zimmerman R, Casey BJ. A neural basis for development of inhibitory control. Developmental Science. 2002b;5:9–16. [Google Scholar]
- Eigsti IM, Zayas V, Mischel W, Shoda Y, Ayduk O, Dadlani MB, Davidson MC, Lawrence Aber J, Casey BJ. Predicting cognitive control from preschool to late adolescence and young adulthood. Psychological Sciences. 2006;17:478–484. doi: 10.1111/j.1467-9280.2006.01732.x. [DOI] [PubMed] [Google Scholar]
- Elliott R, Ogilvie A, Rubinsztein JS, Calderon G, Dolan RJ, Sahakian BJ. Abnormal ventral frontal response during performance of an affective go/no go task in patients with mania. Biological Psychiatry. 2004;55:1163–1170. doi: 10.1016/j.biopsych.2004.03.007. [DOI] [PubMed] [Google Scholar]
- Elliott R, Rubinsztein JS, Sahakian BJ, Dolan R. Selective attention to emotional stimuli in a verbal go/no-go task: An fMRI study. Neuroreport. 2000;11:139–1744. doi: 10.1097/00001756-200006050-00028. [DOI] [PubMed] [Google Scholar]
- Elliott R, Rubinsztein JS, Sahakian BJ, Dolan RJ. The neural basis of mood-congruent processing biases in depression. Archives of General Psychiatry. 2002;59:597–604. doi: 10.1001/archpsyc.59.7.597. [DOI] [PubMed] [Google Scholar]
- Erwin RJ, Gur RC, Gur RE, Skolnick B, Mawhinney-Hee M, Smailis J. Facial emotion discrimination: I. Task construction and behavioral findings in normal subjects. Psychiatry Research. 1992;42:231–240. doi: 10.1016/0165-1781(92)90115-j. [DOI] [PubMed] [Google Scholar]
- Evenden JL. Varieties of impulsivity. Psychopharmacology. 1999;146:348–361. doi: 10.1007/pl00005481. [DOI] [PubMed] [Google Scholar]
- Gerbing DW, Ahadi SA, Paton JH. Toward a conceptualization of impulsivity: Components across the behavioral and self-report domains. Multivariate Behavioral Research. 1987;22:357–379. doi: 10.1207/s15327906mbr2203_6. [DOI] [PubMed] [Google Scholar]
- Grimshaw GM, Bulman-Fleming MB, Ngo C. A signal-detection analysis of sex differences in the perception of emotional faces. Brain and Cognition. 2004;54:248–250. doi: 10.1016/j.bandc.2004.02.029. [DOI] [PubMed] [Google Scholar]
- Hare TA, Tottenham N, Davidson MC, Glover GH, Casey BJ. Contributions of amygdala and striatal activity in emotion regulation. Biological Psychiatry. 2005;57:624–632. doi: 10.1016/j.biopsych.2004.12.038. [DOI] [PubMed] [Google Scholar]
- Johansson K, Ronnberg J. Speech gestures and facial expression in speechreading. Scandinavian Journal of Psychology. 1996;37:132–139. doi: 10.1111/j.1467-9450.1996.tb00646.x. [DOI] [PubMed] [Google Scholar]
- Leppanen JM, Hietanen JK. Positive facial expressions are recognized faster than negative facial expressions, but why? Psychological Research. 2004;69:22–29. doi: 10.1007/s00426-003-0157-2. [DOI] [PubMed] [Google Scholar]
- Mathews A, McLeod C. Cognitive approaches to emotion and emotional disorders. Annual Review of Psychology. 1994;45:25–50. doi: 10.1146/annurev.ps.45.020194.000325. [DOI] [PubMed] [Google Scholar]
- McClure EB. A meta-analytic review of sex differences in facial expression processing and their development in infants, children, and adolescents. Psychological Bulletin. 2000;126:424–453. doi: 10.1037/0033-2909.126.3.424. [DOI] [PubMed] [Google Scholar]
- Mishkin M, Pribram KH. Analysis of the effects of frontal lesions in monkeys: I. Variations of delayed alternations. Journal of Comparative and Physiological Psychology. 1955;48:492–495. doi: 10.1037/h0040318. [DOI] [PubMed] [Google Scholar]
- Mostofsky SH, Schafer JGB, Abrams MT, Goldberg MC, Flower AA, Boyce A, Courtney SM, Calhoun VD, Kraut MA, Denckla MB, Pekar JJ. fMRI evidence that the neural basis of response inhibition is task-dependent. Cognitive Brain Research. 2003;17:419–430. doi: 10.1016/s0926-6410(03)00144-7. [DOI] [PubMed] [Google Scholar]
- Murphy FC, Sahakian BJ, Rubinsztein JS, Michael A, Rogers RD, Robbins TW, Paykel AS. Emotional bias and inhibitory control processes in mania and depression. Psychological Medicine. 1999;29:1307–1321. doi: 10.1017/s0033291799001233. [DOI] [PubMed] [Google Scholar]
- Otta E, Lira BB, Delevati NM, Cesar OP, Pires CS. The effect of smiling and of head tilting on person perception. Journal of Psychology. 1994;128:323–331. doi: 10.1080/00223980.1994.9712736. [DOI] [PubMed] [Google Scholar]
- Pine DS, Klein RG, Mannuzza S, Moulton JL, 3rd, Lissek S, Guardino M, Woldehawariat G. Face-emotion processing in offspring at risk for panic disorder. Journal of the American Academy of Child and Adolescent Psychiatry. 2005;44:664–672. doi: 10.1097/01.chi.0000162580.92029.f4. [DOI] [PubMed] [Google Scholar]
- Reynolds DM, Jeeves MA. A developmental study of hemisphere specialization for recognition effaces in normal subjects. Cortex. 1978;14:511–520. doi: 10.1016/s0010-9452(78)80026-4. [DOI] [PubMed] [Google Scholar]
- Schneider W, Eschman A, Zuccolotto A. E-Prime Reference Guide. Pittsburgh, PA: Psychology Software Tools Inc; 2002. [Google Scholar]
- Ward MF, Wender PM, Reimherr FW. The Wender Utah Rating Scale: an aid in the retrospective diagnosis of childhood attention deficit hyperactivity disorder. American Journal of Psychiatry. 1993;150:885–890. doi: 10.1176/ajp.150.6.885. [DOI] [PubMed] [Google Scholar]
- Wechsler D. Wechsler Abbreviated Scale of Intelligence. San Antonio: The Psychological Corporation; 1999. [Google Scholar]
- White JL, Moffitt TE, Caspi A, Bartusch DJ, Needles DJ, Stouthamer-Loeber M. Measuring impulsivity and examining its relationship to delinquency. Journal of Abnormal Psychology. 1994;103:192–205. doi: 10.1037//0021-843x.103.2.192. [DOI] [PubMed] [Google Scholar]
- White MJ. Response selection and visual search. Bulletin of the Psychonomic Society. 1981;18:201–202. [Google Scholar]