

Abstract
A combined quantum mechanical/molecular mechanical (QM/MM) potential function is used in a thermodynamic integration approach to calculate the pKa of residue 66 in two mutants (V66E, V66D) of Staphylococal nuclease relative to solution. Despite the similarity in chemical nature and experimentally measured pKa of the two buried titritable residues, the behaviors of the two mutants and the computed pKa values vary greatly in the simulations. For Glu66, the sidechain is consistently observed to spontaneously flip out from the protein interior during titration, and the overall protein structure remains stable throughout the simulations. The computed pKa shifts using conventional sampling techniques with multiple nanoseconds per λ window (Set A & B) are generally close to the experimental value, therefore indicating that large-scale conformational rearrangements are not as important for V66E as suggested by the recent study of Warshel and co-worker. For Asp66, by contrast, flipping of the shorter sidechain is not sufficient for getting adequate solvent stabilization of the ionized state. As a result, more complex behaviors such as partial unfolding of a nearby β-sheet region is observed, and the computed pKa shift is substantially higher than the experimental value unless Asp66 is biased to adopt the similar configurations as Glu66 in the V66E simulations. Collectively, these studies suggest that the lack of electronic polarization is not expected to be the dominant source of error in microscopic pKa shift calculations, while the need of enhanced sampling is more compelling for predicting the pKa of buried residues. Furthermore, the comparison between V66E and V66D also highlights that the microscopic interpretation of similar apparent pKa values and effective “dielectric constants” of proteins can vary greatly in terms of the residues that make key contributions and the scale of structural/hydration response to titration, the latter of which is difficult to predict a priori. Perturbative analyses of interactions that contribute to the titration free energy point to mutants that can be used to verify the microscopic mechanisms of titration in V66E/D SNase proteins.
1 Introduction
Buried ionizable residues in the interior of proteins play important functional roles in many biochemical processes such as catalysis, proton transport and proton-coupled-electron-transfer reactions. [1] This is consistent with the findings of a recent continuum electrostatics study [2] that a large fraction of buried titritable residues in proteins is ionized (e.g., 92% of the Arg, 86% of the Asp, 77% of the Glu, and 75% of the Lys). Clearly, for both fundamental and application purposes, it is important to be able to predict the pKa of these buried ionizable residues and understand factors that dictate their pKa values. This is generally more difficult to accomplish than for solvent accessible titritable groups [3–5] because titration of buried residues is likely coupled to significant structural response of the environment. [6]
A good example in this context is Staphylococcal nuclease (SNase). Recently Garcia-Moreno and coworkers have measured the pKa of buried residues in SNase using a series of mutagenesis studies [7–9]. One particular set of examples involve site 66, which is Val in the WT SNase but was substituted to Asp, Glu or Lys in different mutants. Since this site is in the buried hydrophobic interior, one expects that a titritable residue would experience a significantly shifted pKa to adopt the charge-neutral state. Although titration experiments confirmed the direction of the expected pKa shift, the magnitude of the pKa shift was much smaller than that predicted based on popular continuum electrostatic models. Specifically, the experimental pKa shift relative to solution for V66E, V66D and V66K was found to be 4.5, 4.4 and 4.8 pKa units, respectively. By comparison, the predicted pKa shifts using the standard Poisson-Boltzmann (PB) approach with a uniform dielectric constant of 4 for the protein are much larger (>14, see Fig. 7 in Ref. [7]). In fact, to reproduce the experimental pKa’s using PB calculations a dielectric constant of ~ 10 for the protein was found necessary [7]. The microscopic interpretation of such a high dielectric constant has not been firmly established and several proposals can be put forwarded. For example, it is possible that the titration of the buried residue is coupled to water penetration into the protein core. [10] This idea is consistent with the crystallographic structure of the V66E mutant at 100 K, [10] which showed the presence of internal water molecules hydrogen bonded to Glu66. However, no internal water is observed in the x-ray structure at 298 K, which can be explained by the high mobility of internal water at the room temperature as suggested by molecular dynamics simulations. [11] Furthermore, magnetic relaxation dispersions experiments with the V66E and V66K mutants found no evidence for the involvement of water penetration coupled to the titration of these internal ionizable groups. [8] Therefore, an alternative explanation for the apparent high dielectric constant is that the titration induces significant structural transitions in the protein. For the V66D mutant, the far UV-CD spectra indeed indicated the loss of α-helical content upon titration. [9] For the V66E and V66K mutants, however, the intrinsic fluorescence and near and far-UV CD signals suggested that the conformational change, if any, is very localized in nature; [7,8] in this regard, on-going NMR experiments might lead to new insights (Garcia-Moreno, private communication).
To gain a better microscopic understanding of the titration process, microscopic pKa simulations [12, 13] are better suited although the challenge is that a proper treatment of both electronic polarization and structural relaxation of the protein/solvent are likely needed for reproducing the experimental result. In this direction, Warshel and coworkers recently developed a novel overcharging scheme [14] that uses the charge of the ionizable residue as a parameter to drive partial unfolding of the protein. Using this method they were able to reproduce the experimental pKa shift for the V66E mutant to within 2 pKa units, provided that the electronic polarizability of the protein is taken into account. Although elegant, their study provided little information regarding the required length of sampling and, more importantly, the precise magnitude of the unfolding transition. Moreover, there has not been concrete experimental evidence for large-scale structural disruption associated with the titration of V66E and partial unfolding was observed only for V66D. Therefore, it is sensible to question whether there is an alternative microscopic explanation for the modest pKa shift of V66E and whether V66E and V66D have different microscopic origins for their apparently similar pKa values.
In this paper we use a free energy perturbation (FEP) based method with a QM/MM potential to calculate the pKa of Glu66 (V66E) and Asp66 (V66D) in the relevant Staphylococcal nuclease mutants. This protocol has been used in several recent studies from our group and has been shown to successfully reproduce the experimental pKa shifts of small molecules in solution and semi-buried ionizable residues in proteins such as the T4 lysozyme and carbonic anhydrase [15–17]. Strictly speaking, using a QM/MM potential does not offer any major advantage for relative pKa calculations when a small QM region (only the titritable group) is used as we do here; using a significantly larger QM region allows one to investigate the importance of electronic polarization in the immediate environment, which is an issue that attracted much attention recently [18,19] and our results will be reported separately (Yu and Cui, work in progress). The motivation of using a QM/MM rather than a MM potential here is largely due to the convenience of computational set-up and our general interest in establishing the reliability and limitation of QM/MM simulations; [15,16] as emphasized repeatedly in our [17, 20] and other’s studies, [21] the ability of reproducing pKa shifts serves as a stringent benchmark for QM/MM simulations of biomolecular systems, especially those involved in long-range proton transfers.
There are two main goals for this study. First, we hope to explore and compare the microscopic origins for the modest pKa shifts in the V66E and V66D mutants of SNase. Second, by carrying out standard MD simulations, we hope to establish the necessity of adopting enhanced sampling techniques for pKa calculations of buried residues; depending on the scale of structural transitions coupled to titration, which is difficult to predict a priori, it is possible that the need of enhanced sampling technique varies.
2 Computational Methods and Set-up
The basic simulation protocol here for pKa calculations is a free energy perturbation (FEP) based approach with a SCC-DFTB [22]/MM-GSBP potential. [23] Since this protocol has been presented in detail in several recent publications [15,16,24], we refer the readers to the original references and include only technical details for the specific systems studied here.
2.1 Simulation set-up
The x-ray structure of the hyperstable Δ+PHS/V66E (PDB code 1U9R) variant of SNASE at 2.1 Å resolution is used [8] as the starting atomic configuration for the V66E pKa calculations. To simplify the comparison, Glu66 in the Δ+PHS/V66E structure is computationally mutated into an aspartic acid (Asp66) to construct the V66D structure. Successive overlays of 25 Å water sphere is performed to solvate the protein, removing after each iteration all solvent molecules within 2.8 Å of any non-hydrogen protein atom. The added solvent molecules are relaxed at 300 K for 20 ps with all protein and crystallographic water molecules held fixed. The solvation layers beyond 18 Å are deleted, providing the final structure used as the starting point for the subsequent simulations.
The protein is partitioned into a 20 Å spherical inner region with 1558 protein atoms and 465 water molecules while the remaining portion of the system is in the outer region. The generalized solvent boundary potential (GSBP) developed by Roux and coworkers [25] is used to treat the effect of solvation and electrostatic interactions between the inner and outer region atoms [23]. In the GSBP calculations the static field due to protein charges in the outer region, , and the reaction field matrix, M, are evaluated with the linear Poisson-Boltzmann (PB) equation using a focussing scheme that places a 48 × 48 × 48 Å3 cube of fine grid (0.4 Å) into a larger 82 × 82 × 82 Å3 cube of coarse grid (1.6 Å). The inner region charge density is expressed using the first 20th-order spherical harmonics with a total of 400 basis functions. In the Poisson-Boltzmann calculations, the dielectric constant for the bulk solvent region (εw) is set to 80 while that of the protein in the outer region (εp) is set to 1. The protein solvent dielectric boundary is set using the optimized atomic Born radii of Roux and Nina [26] based on experimental solvation energies of small molecules.
In the SCC-DFTB/MM-GSBP pKa simulations, the inner region is further partitioned into Newtonian and Langevin regions. Atoms beyond 20 Å are fixed, those between 16 Å and 20 Å are treated with Langevin dynamics, while the rest are treated with the standard Newtonian dynamics. The protein atoms in the Langevin region are harmonically constrained with force constants determined from the crystallographic B-factors. All bonds involving hydrogen are constrained with the SHAKE algorithm [27] to allow a 2 fs timestep. Non-bonded interactions in the inner region sphere are treated with the extended electrostatics model where groups beyond 12 Å are treated using multipolar expansions. [28] The entire system is heated to 300 K and equilibrated for ~200 ps prior to any free energy simulations.
For the QM/MM partitioning of Glu66 and Asp66, the QM region includes the acetic-acid moiety of the respective side chains. As discussed in earlier publications [16, 29], one of the key issues in QM/MM simulations of processes with significant change in the QM charge distribution is the treatment of the QM/MM frontier. With regard to the SCC-DFTB method, the standard single link atom (SLA), where the partial charge of only the MM host atom is excluded from the QM/MM electrostatics leads to an error of ~ 10 kcal/mol in gas phase proton affinities compared to pure QM calculations and should be avoided. Other approaches such as zeroing out the charges on the entire MM host group (EXGR) or deleting the charge on the MM host atom and distributing it evenly over the remaining MM host group atoms (DIV) avoid spurious QM/MM electrostatic interactions and in general give better proton affinity values. For the QM/MM partitioning of Glu66 or Asp66 in the present calculations, we follow the EXGR scheme with the link atom added between Cβ and Cγ of the glutamic acid sidechain and between Cβ and Cγ of the aspartic acid sidechain. As shown by the solution simulations in Supporting Information, the EXGR scheme gives satisfactory results.
2.2 pKa Calculations
2.2.1 Methodology
The pKa calculations of Glu/Asp 66 are carried out using the FEP approach [30, 32] within the dual topology single coordinate (DTSC) scheme [15,16,33]. In this approach the dominant contribution to the total free energy of deprotonation is from the electrostatic free energy change (ΔGE–RCOO(H/D)) associated with converting the acidic proton to a dummy atom (D), i.e., the transformation from E-RCOOH to E-RCOOD, where E represents the protein and R-COOH is the tiratable acidic residue (Asp/Glu66 in the present case). The corresponding free energy derivative is given by,
| (1) |
which represents the QM/MM energy difference averaged for a specific coupling parameter λ using the same set of coordinates (XE–RCOO(H/D)) for both protonation states, E-RCOO(H/D). The total electrostatic free energy contribution (ΔGE–RCOO(H/D)) is determined by integrating the converged free energy derivatives (∂G/∂λ) over λ from 0 to 1.
Even though the absolute pKa of a residue can, in principle, be estimated using the above protocol, to do so the solvation free energy of a proton has to be taken into account. When considering “pKa shifts” relative to a reference molecule in solution the proton solvation term, which is difficult to measure or compute accurately, does not contribute. Therefore, we choose to compute pKa shift of Glu66/Asp66 in SNase relative to an acetic acid in solution (see Supporting Information), which also helps to cancel other contributions, such as the zero-point energy difference between the protonated and deprotonated states and van der Waals interactions involving the acidic proton. [15] The lack of explicit treatment of electronic polarization in the protein and solvent is also expected to partially cancel out in such pKa shift calculations, although the degree of cancellation remains an interesting topic that we will discuss in separate work (Yu and Cui, work in progress).
Since ΔGE–RCOO(H/D) is electrostatic in nature, one expects that the free energy derivative depends linearly on the coupling parameter λ. [34] Rigorously speaking, this is only true if there is no major structural transitions in the protein during the titration process, which can cause the distribution of “energy gap” (r.h.s. of Eq.1) to deviate from Gaussian and therefore non-linearity in the ∂ΔGE–RCOO(H/D)/∂λ − λ relation. [13, 35] Nevertheless, many previous studies found that the approximate linear relation holds even in the presence of distinct local structural rearrangements, [13,15,17] which is an important practical reason that only a modest number of λ windows need to be sampled despite the rather large range spanned by the free energy derivatives compared to kBT. Therefore, it is of interest to see if the linear relation holds for the potentially more complex SNase systems (see Figures).
2.2.2 Statistical Analysis
As discussed earlier, the titration process might be tightly coupled to significant structural reorganization of the protein/solvent environment. Therefore, it is crucial to carefully monitor the statistical and sampling errors and reproducibility of the microscopic pKa simulations. For this purpose, multiple independent pKa simulations have been performed for each mutant (V66E, V66D); some of the independent sets simply differ with the random seeds for the initial velocity assignment, while others differ in the initial protein structure (see Sect.3 for details). For each set of pKa simulation, the average free energy derivative value for a particular λ is determined using a block averaging scheme that uses statistical tools to identify the trend-free portion of the data, the average and the corresponding statistical error [36]. Specifically, the initial raw data set (Xi, i = 1, 2, ….) is coarse grained into blocks. To obtain the most appropriate coarse grained data set that is approximately normally distributed, four statistical tests are performed: (1) the Mann-Kendall test for lack of trend in the Mean for each block of data (x̄k, where k is the number of blocks); (2) the Mann-Kendall test for lack of trend in the V ariance for each block (Sk); (3) the Shapiro-Wilk test for normality of the mean (x̄k); (4) the Von-Neumann test for lack of positive correlation in the mean (x̄k). An iterative procedure is followed in which the length of the blocks and the length of the initial equilibrating region to be discarded are varied until the data pass all four tests. The final output is the equilibrated region of the data set, which is then used for calculating the average (< X >). Confidence limits on the average are assigned using the “Students t” test. An important point concerning the use of the above statistical procedure is that the number of blocks should be large enough for the statistical tests to achieve reasonable resolving power; we found a minimal of 24 blocks is sufficient.
The amount of simulation identified as the equilibrating phase and the number/size of blocks for the equilibrated data are summarized in Table 1, and the statistical average and error for different λ windows in different sets of simulations are summarized in Table 2. The amount of data excluded from meaningful ensemble average calculations includes as much as 3.7 ns, which highlights the importance of careful statistical analysis of the simulation data. The typical statistical error is on the order of 0.3–1.0 kcal/mol, although the error due to limited sampling can be more significant (see Sect.3).
Table 1.
Statistical analysis of pKa simulations for V66E and V66D SNase.a
| λ | Set A-V66E | Set B-V66E | Set C-V66E | Set D-V66E | ||||
|---|---|---|---|---|---|---|---|---|
| prod(equi) [ns] | t[ps](n[blocks]) | prod(equi) [ns] | t[ps](n[blocks]) | prod(equi) [ns] | t[ps](n[blocks]) | prod(equi) [ns] | t[ps](n[blocks]) | |
| 0.0 | 6.6(3.4) | 69(47) | 5.0(2.1) | 20(145) | 1.7(0.5) | 12(100) | 4.4(1.5) | 50(58) |
| 0.25 | 6.4(3.2) | 26(123) | 5.2(1.7) | 64(55) | 1.7(0.3) | 12(117) | 4.4(1.9) | 21(119) |
| 0.4 | 6.0(3.5) | 64(39) | 5.0(2.0) | 24(125) | - | - | 4.2(2.5) | 52(32) |
| 0.5 | - | - | - | - | 1.7(0.9) | 13(62) | - | - |
| 0.6 | 6.0(3.8) | 34(65) | 5.0(3.3) | 32(53) | - | - | 4.4(1.4) | 103(29) |
| 0.75 | 6.6(3.7) | 20(115) | 5.2(3.2) | 28(71) | 1.7(0.3) | 17(82) | 4.5(2.2) | 22(105) |
| 1.0 | 6.4(3.0) | 48(71) | 5.0(1.2) | 24(158) | 1.7(0.2) | 15(100) | 4.4(2.1) | 23(100) |
|
| ||||||||
| λ | Set A-V66D | Set B-V66D | Set C-V66D | Set D-V66D | ||||
| prod(equi) [ns] | t[ps](n[blocks]) | prod(equi) [ns] | t[ps](n[blocks]) | prod(equi) [ns] | t[ps](n[blocks]) | prod(equi) [ns] | t[ps](n[blocks]) | |
|
| ||||||||
| 0.0 | 8.1(3.9) | 43(97) | 4.3(3.0) | 39(33) | 4.2(1.7) | 68(38) | 4.2(2.4) | 22(82) |
| 0.25 | 8.0(4.0) | 61(66) | 4.3(3.0) | 18(72) | 4.0(1.5) | 60(42) | 4.0(1.8) | 65(34) |
| 0.4 | 4.2(2.8) | 29(48) | ||||||
| 0.5 | 8.4(4.5) | 153(26) | 4.3(3.3) | 26(38) | 4.1(2.2) | 70(27) | - | - |
| 0.6 | 4.3(2.9) | 44(32) | ||||||
| 0.75 | 8.1(3.1) | 65(78) | 4.3(3.4) | 13(69) | 4.2(2.5) | 60(28) | 4.2(2.8) | 30(47) |
| 1.0 | 8.0(4.4) | 11(327) | 4.3(2.2) | 53(40) | 4.2(0.6) | 60(56) | 4.1(1.2) | 22(131) |
For the protocols used, see Computational Methods and Set-up in the main text. “prod(equi)” gives the total amount of simulation time (in ns) and the segment identified as equilibration (in parentheses). “t[ps]” gives the size of the block (in ps) and “n[blocks]” gives the total number of blocks in the final free energy derivative calculations. For both V66E and V66D, Set A/B uses conventional sampling protocols with the X-ray structure as the starting structure for the λ = 0.0 window; other λ windows are carried out in a sequential manner. In Set C-V66E, the flipped out configuration of Glu66 from Set A-V66E is used as the starting coordinate for all λ windows; in both Set C-V66D and Set D-V66E, the partially unfolded structures sampled in Set A-V66D are used as the starting structure for all λ windows; in Set D-V66D, the last snapshot in each λ window of Set A-V66E is used as the starting coordinate for the corresponding λ window.
Table 2.
Free energy derivatives, ΔGE-RCOO(D/H) and pKa shifts from multiple sets of QM/MM-FEP simulations.a
| λ | Set A-V66E | Set B-V66E | Set C-V66E | Set D-V66E | Acetic acid (aq) |
|---|---|---|---|---|---|
| 0.0 | 219.1(1.0) | 220.3(0.4) | 212.7(0.6) | 222.4(0.4) | 212.5(0.3) |
| 0.25 | 186.9(0.6) | 182.0(0.9) | 172.5(0.4) | 182.7(0.3) | 173.3(0.2) |
| 0.4 | 164.1(0.6) | 165.4(0.2) | - | 169.8(1.0) | - |
| 0.5 | - | - | 135.4(0.4) | 136.2(0.5) | |
| 0.6 | 115.3(0.3) | 115.6(0.6) | - | 143.1(1.4) | - |
| 0.75 | 90.2(0.4) | 90.0(0.4) | 90.0(0.7) | 114.1(0.8) | 92.8(0.3) |
| 1.0 | 41.0(0.5) | 44.0(0.5) | 42.9(0.5) | 53.9(0.8) | 41.6(0.5) |
|
| |||||
| ΔGE-RCOO(D/H) | 136.1(0.99) | 136.2(0.99) | 130.7(0.99) | 147.7(0.97) | 131.7(0.99) |
| ΔpKa | 3.2 | 3.3 | −0.1 | 11.8 | |
|
| |||||
| λ | Set A-V66D | Set B-V66D | Set C-V66D | Set D-V66D | |
|
| |||||
| 0.0 | 229.4(0.6) | 229.6(0.5) | 218.5(1.3) | 207.4(0.5) | |
| 0.25 | 186.6(0.8) | 185.2(0.5) | 178.3(1.0) | 182.0(1.5) | |
| 0.4 | - | - | - | 163.5(0.8) | |
| 0.5 | 161.2(1.5) | 158.3(0.6) | 153.8(0.9) | - | |
| 0.6 | - | - | - | 116.7(0.4) | |
| 0.75 | 114.7(1.0) | 125.4(1.2) | 105.3(1.0) | 94.9(0.4) | |
| 1.0 | 52.9(0.6) | 48.1(0.9) | 53.5(0.9) | 46.9(0.3) | |
|
| |||||
| ΔGE-RCOO(D/H) | 149.9(0.98) | 149.3(0.96) | 141.9(0.99) | 136.0(0.99) | |
| ΔpKa | 13.3 | 12.8 | 7.5 | 3.2 | |
For the free energy derivatives, the value are in kcal/mol and the values in parentheses are statistical errors. For ΔGE-RCOO(D/H), which is computed based on the linear fit of the free energy derivatives and subsequent integration over λ, the value in parentheses is the R2 for the linear fit. The pKa shift (in pKa units) is relative to the acetic acid in solution, whose experimental pKa is 4.8 (CRC Handbook of Chemistry and Physics).
3 Results and Discussions
In the following we discuss the results of the SCC-DFTB/MM-FEP simulations, first for Glu66 titration in V66E and then Asp66 titration in V66D. The main questions of interest are: (i). can the SCC-DFTB/MM based protocol reproduce experimentally measured pKa shifts with the standard sampling technique, non-polarizable force field (CHARMM [37]) and how reproducible are the results? (ii). are there major structural transitions in the protein and/or solvent penetration coupled to the titration process? (iii). are the situations similar for V66E and V66D, given that very similar pKa shifts (4.5 vs. 4.4) have been measured and that the titritable groups (Glu vs. Asp) are very similar chemically?
3.1 Glu66 in the V66E-SNase
3.1.1 Structural response to Glu66 titration
Overall, the structure of the V66E mutant remains stable for all λ windows at the simulation time scale of ~ 6 ns (for each λ) in two independent sets of simulations (Set A & B). The backbone RMSD (see Fig. S1 in Supporting Information) remains below 1 Å for λ smaller than 0.5 and only increases slightly beyond 1 Å for larger λ windows where Glu66 has a significant net charge. In other words, there is no sign of major structural perturbations (such as local unfolding) caused by the ionization of Glu66.
At the sidechain scale, however, Glu66 is observed to flip out from its buried position in the hydrophobic core towards the protein surface for the partially (λ=0.6,0.75) and completely (λ=1.0) ionized states (Fig. 1). This is clearly illustrated by the time evolution of the χ1 dihedral angle (C:Cα:Cβ:Cγ), which changes from ≈155° to ≈55° in high-λ windows but remains ≈ ±155° in low-λ windows (Fig. 2). As the result of such a rotation the solvent accessible surface area (SASA) around Glu66 increases. As shown in Fig. 3a. the solvent accessibility of Glu66 is very low in the low λ windows (0.0–0.5), with SASA values around ~ 5 Å2, but increases significantly to around ~ 50 Å2 upon the χ1 transition in the high λ windows (0.75,0.6,1.0). We note that the similar sidechain rotation has also been observed in a previous MD simulation of the V66E mutant in the ionized state. [38]
Figure 1.
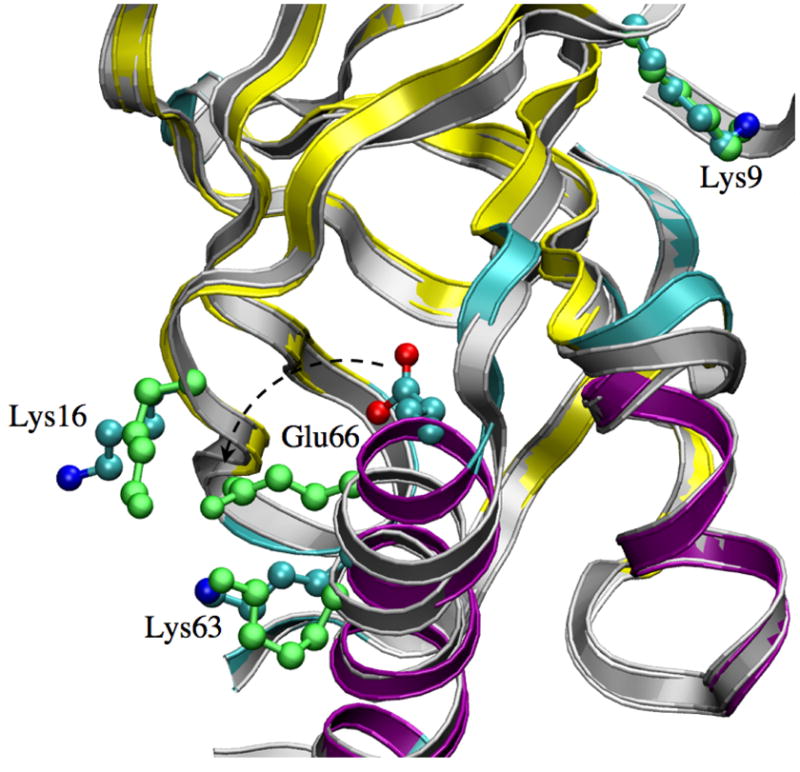
Structural features of the V66E SNase during pKa simulations (Set A-V66E). A snapshot in the λ = 1.0 window (in grey ribbon) is overlapped the X-ray structure (ribbon, color coded by secondary structure: purple: helix; cyan: turns; yellow: β-sheet). The sidechains of Glu66 and a number of important charged groups are shown in the CPK form; those colored by atom type are in the X-ray structure, and the green ones are for the λ = 1.0 snapshot. Note that Glu66 undergoes a rotation towards the protein surface.
Figure 2.
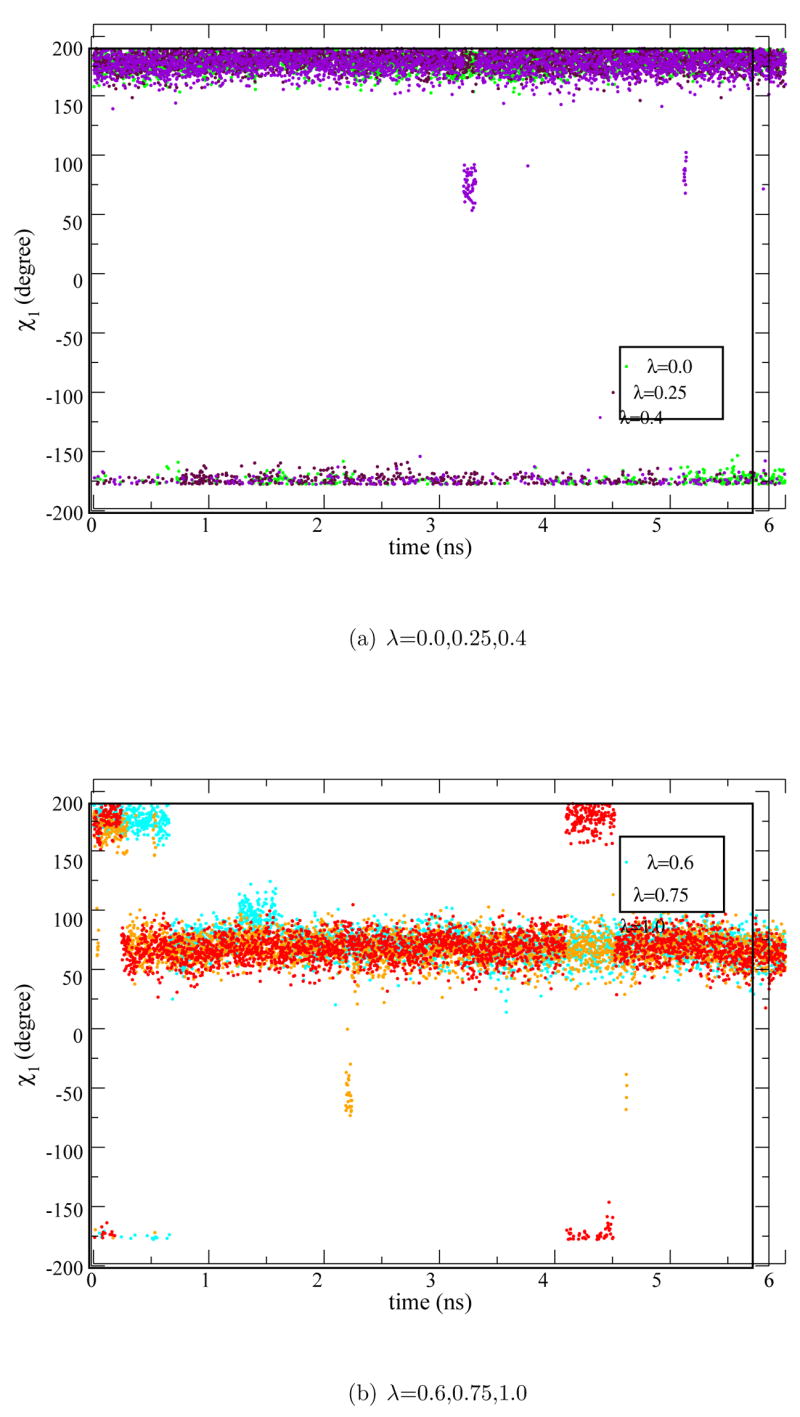
The χ1 dihedral angle for Glu66 during the SetA-V66E simulations. (a) λ = 0.0,0.25,0.4; (b) λ = 0.6,0.75,1.0.
Figure 3.

Solvent accessible surface area (SASA) for the titritable group in two sets of pKa simulations for the V66E mutant (Set A/D-V66E).
As another view of the water distribution near Glu66, both the g(r) and integrated number of water molecules are shown in Fig. 4a for the Set A simulations. For λ= 0.0, there is about 1–2 water molecules within the first solvation shell of the Glu66 sidechain, which is largely consistent with recent MD simulations of SNase using different x-ray structures and initial conditions. [11] For example, the multiple V66E simulations (with Glu66 protonated) in Ref. [11] found that the number of stable waters in the hydrophobic cavity vary between 0, 1, 2 and 3 with the waters capable of occupying three different hydration patterns. Among those, the results of Set A here best resembles the situation indicated by Fig. 3b of Ref. [11] For higher λ windows where Glu66 is flipped out, the number of water in the first solvation shell, as expected, increases to about 4 water molecules.
Figure 4.

Water distribution around the carboxylic oxygens in Glu66 in two sets of pKa simulations for the V66 mutant (Set A/D-V66E). The g(r) is the pair distribution function for water oxygen around the carboxylic oxygens in Glu66.
In addition to solvent exposure, Glu66 sidechain rotation is also accompanied by a small displacement of its parent helix and re-orientation of few other charged residues such as Lys16 and Lys63 (Fig. 1, also see Fig. S3 in the Supporting Information). Lys16 is located on the β-sheet opposite Glu66 and interacts with the Glu66-Lys63 ion-pair, coming to within salt bridge distances in λ=0.6,0.75,1.0. Such interactions play a major role in determining the pKa of Glu66 (see Sect.3.3).
3.1.2 pKa results
Altogether six intermediate states (λ=0.0, 0.25, 0.4,0.6, 0.75,1.0) are used to obtain the ∂G/∂λ values from FEP simulations. In each window, the data collected during the first ~ 200 ps of simulation is removed as part of the equilibration process, the remaining data is then subjected to statistical analysis to obtain the proper average ∂G/∂λ at each λ value. The discarded (equilibrating) regions contained anywhere from 3.0 ns to 3.7 ns (e.g., Set A in Table 1). Block sizes of 20 to 60 ps are used for the block averaging of raw data with the number of blocks varying between 35 to 144 (n ≥ 24). With these data, the statistical errors associated with the free energy derivatives are on the order of 0.3–1.0 kcal/mol (Table 2). In all cases, the linear dependence [13, 34] of the free energy derivatives on λ holds well with a correlation coefficient (R2) higher than 0.98 (see Fig. 4 for example).
Comparison of the free energy derivatives for Glu66 in V66E with the corresponding ∂G/∂λ values for an acetic acid in solution (Table 2) shows that for λ=1.0 the derivatives are very similar (41.0 vs. 41.6 kcal/mol) since in both cases the titritable group is well solvated by water. For low-λ (0.0, 0.25, 0.4) windows, the Glu66 sidechain remains buried in the hydrophobic core and therefore the free energy derivative values are substantially higher compared to solution values, reflecting the lack of sufficient stabilization for the ionized state in the protein interior. Integrating ∂G/∂λ over λ (Fig. 5a) gives a value of 136.1 kcal/mol, which, compared to the value of 131.7 kcal/mol for solution, leads to a pKa shift of 3.2 pKa units. This is in quite good an agreement with the experimental value of 4.5 pKa units.
Figure 5.

The free energy derivative (see Eq. 1 in text) as a function of λ for Set A-V66E and Set A-V66D simulations. The red lines are linear fits; the R2 values are given in parentheses.
With another independent set of simulations that start with the same protein structure but different random seeds for initial velocity assignment, flipping of the Glu66 sidechain towards the protein surface for the λ=0.60, 0.75 and 1.0 windows is also observed. Thus, not surprisingly, the predicted pKa shift (Table 2, Set B) is 3.3 pKa units, very similar to Set A; it is worth noting that the ∂G/∂λ values in some λ windows differ by about 1–4 kcal/mol between the two independent sets of simulations, which is substantially larger than the statistical uncertainty of the free energy derivative, reflecting the different phase space explored in the independent sets of simulations.
Based on the above two sets of simulations we argue that sidechain rotation of Glu66 occurs only upon titration and Glu66 preferentially resides in the hydrophobic core in the charge neutral state. To test this we initiate the third set of FEP simulations in which all λ windows are initiated with a structure where the Glu66 sidechain adopts the solvent exposed conformation; the Glu66 remains solvent exposed in the subsequent ~ 1.7 nanosecond simulations for all λ windows. As expected, such calculated ∂G/∂λ values are very similar to that of an acetic acid in solution, leading to a very small pKa shift of −0.1 pKa unit.
In summary, these results indicate that to explain the modest pKa shift observed for Glu66, there is no need to invoke large-scale structural transitions coupled to the titration process. This is because the sidechain of Glu66 is flexible and a simple rotation is sufficient to make the ionized sidechain solvent accessible and energetically stabilized. Starting from the x-ray structure where Glu66 is buried and (expected to be) charge neutral, the sidechain rotation upon titration is consistently found in two sets of independent simulations. Analysis of inter-residual interactions (see below Sect.3.3) indicates that the sidechain rotation is largely stabilized by solvation and the favorable electrostatic interaction between the charged Glu66 and two Lys residues (Lys63, Lys16); a few other charged residues also contribute to the modulation of the electric field that stabilizes the charged Glu66. On the other hand, starting with a solvent-exposed configuration, Glu66 remains solvent exposed in all λ windows at the ~ 1.7 nanosecond timescale, which indicates a significant entropic barrier to bury even a charge-neutral Glu66 and highlights the need of using enhanced sampling techniques even when the titration is coupled to conformational transitions at a relatively local scale.
3.2 Asp66 in the V66D-SNase
3.2.1 Structural response to Asp66 titration
Although Asp and Glu are very similar chemically, rather different behaviors are observed for the FEP simulations of V66D that start with the V66E X-ray structure. Unlike the V66E simulations where Glu66 rotates to become solvent stabilized upon ionization, no Asp66 sidechain rotation is observed in any λ windows for the Set A simulations (see Fig. S2 in Supporting Information) presumably reflecting the shorter sidechain length that decreases the flexibility of Asp66. Instead, the presence of a buried charge causes the V66D structure to suffer from significant perturbations as Asp66 becomes ionized (Fig. 6).
Figure 6.
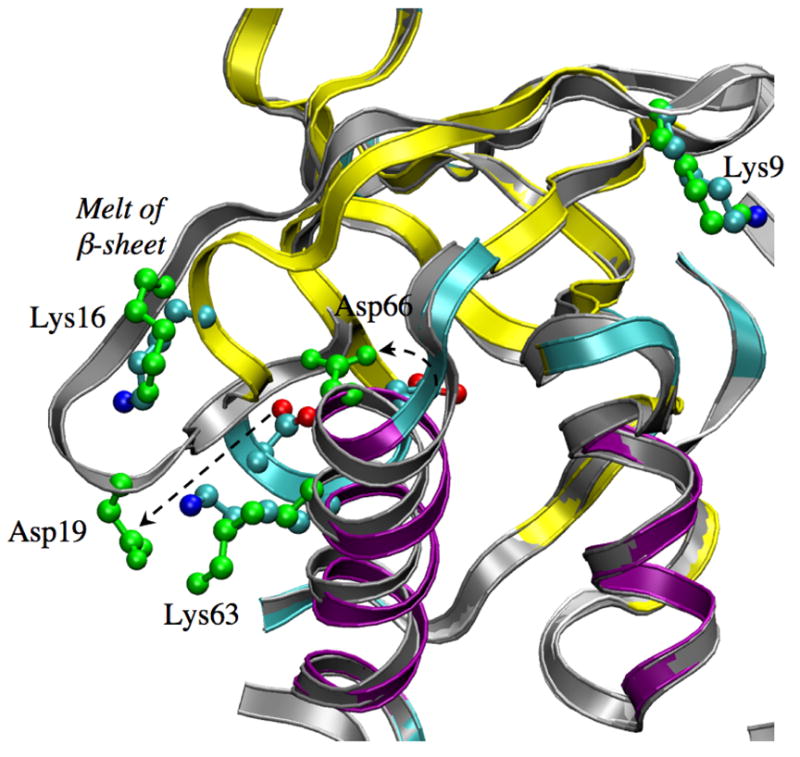
Similar to Fig. 1, but for Set A-V66D. Note the partial unfolding of a nearby β sheet. As a result, Asp19 forms a salt-bridge with Lys63. The displacement of Asp66 is rather modest.
As shown in Fig. 7, in all low-λ windows (<0.75) the sampled structures are stable and have small (< 1 Å) RMSD relative to the x-ray structure. For the λ=0.75 and 1.0 windows, significant drift in the RMSD is observed, especially for the fully ionized state (Fig. 7) where the backbone RMSD value increases abruptly around 4 ns due to the onset of partial unfolding. The unfolding involves largely the melting of a β sheet close to Asp66 (Fig. 6) and appears to be stabilized by the favorable salt bridge interactions between Asp19 and Lys63 (Fig. S4 in Supporting Information). Asp19 is located at the β turn and acts as a barrier to prevent waters from accessing the hydrophobic core around Asp66. The re-orientation of Asp19 upon melting of the β sheet allows bulk water to access the hydrophobic core such that the ionized Asp66 can be better stabilized. This is clearly illustrated by the SASA of different λ windows (Fig. 8a), which is very low (1–6 Å2) for λ=0.0, 0.25, 0.5 and substantially higher (10–40 Å2) for λ=0.75 and 1.0. The pair distribution function and integrated number of water molecules around Asp66 (Fig. 9a) also point to the same trend. Nevertheless, the amount of solvent exposure of the sidechain is smaller than that of Glu66 as evident from the SASA (Fig. 8a vs. 3a) plots.
Figure 7.
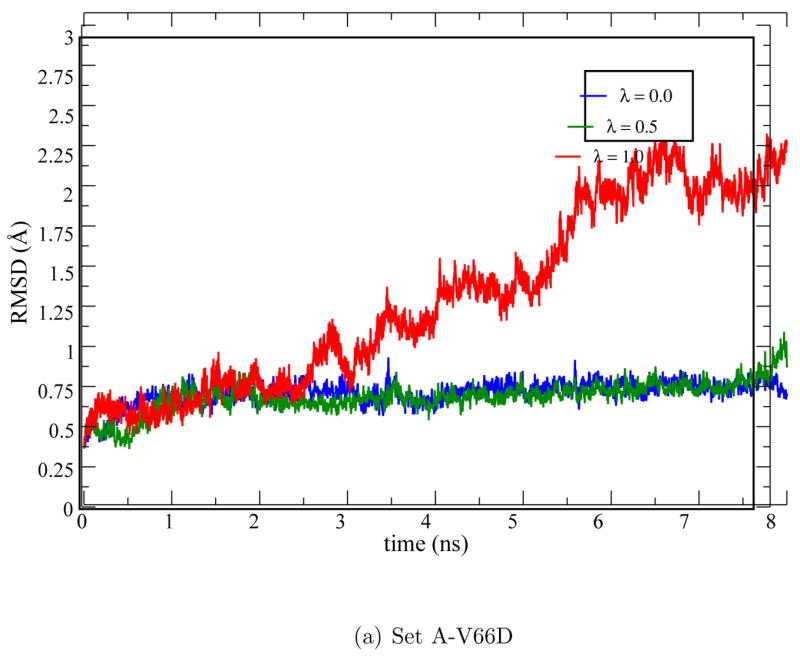
Backbone RMSD (in Å) for the V66D mutant during the pKa simulations (Set A-V66D).
Figure 8.
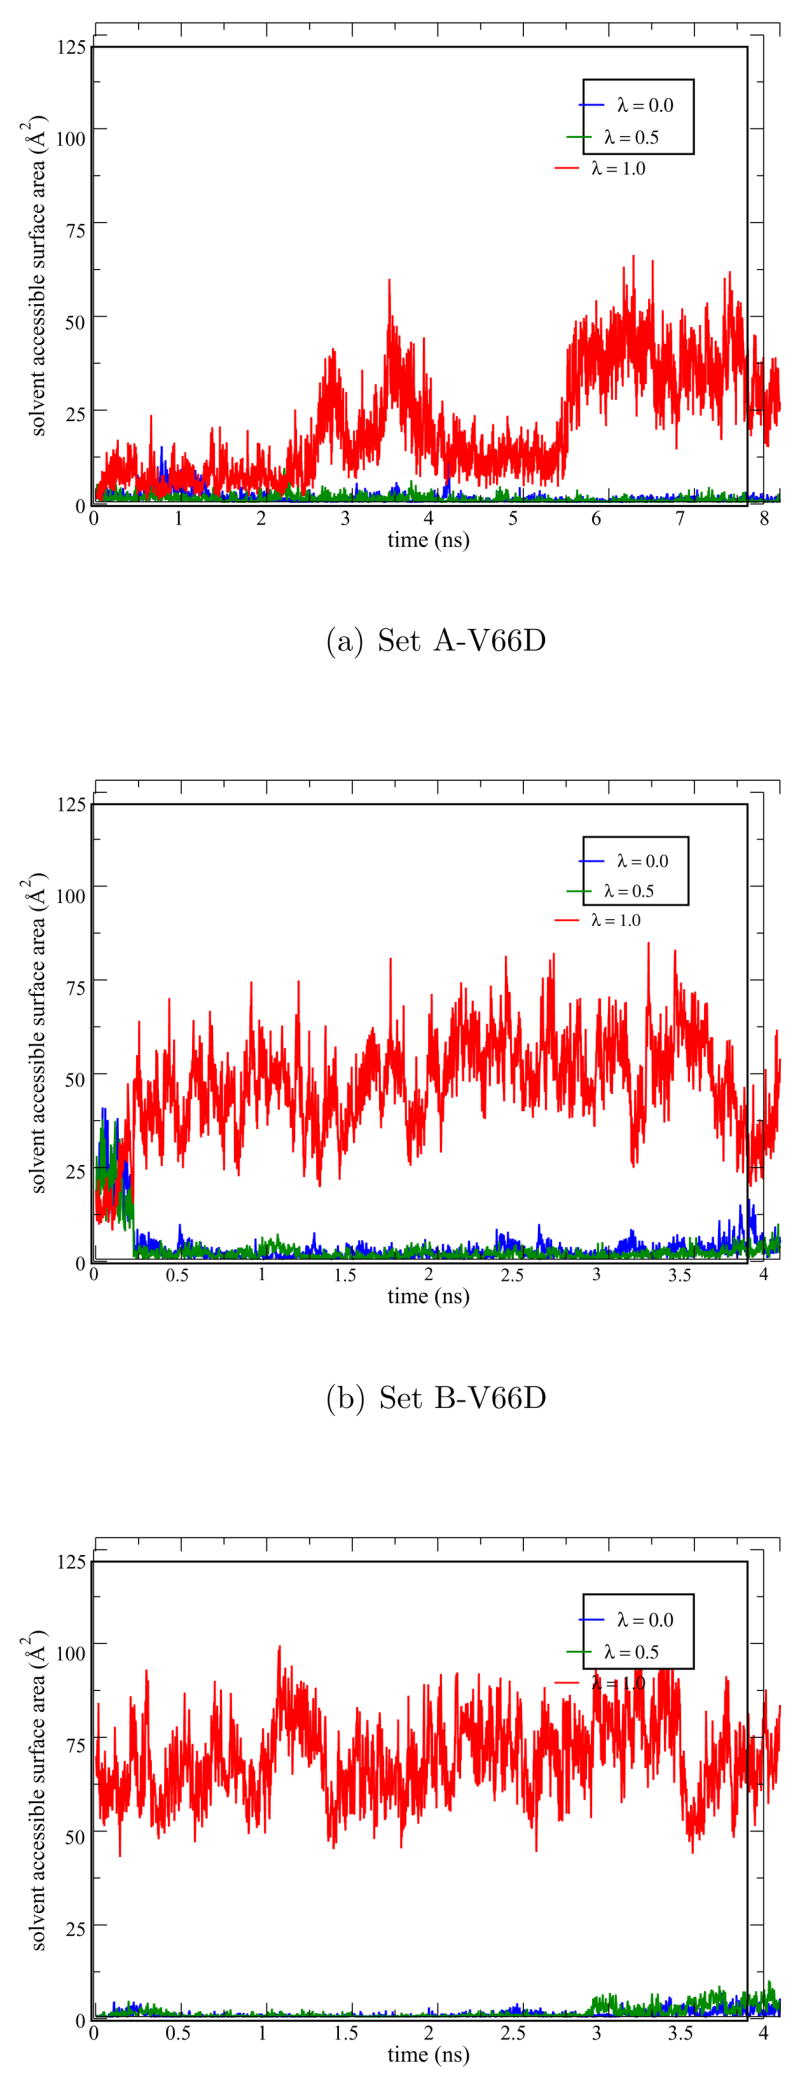
Solvent accessible surface area (SASA) for Asp66 in three sets of pKa simulations (Set A,B,D-V66D).
Figure 9.

Similar to Fig. 5, but for Asp 66 in Set A/D-V66D simulations.
To explore reproducibility of the pKa simulations, a second independent set of FEP calculations is carried out. In this Set B simulation, the same initial structure as in Set A is used and only the random seed for the initial velocity assignment is changed. Interestingly, instead of inducing unfolding, the titration of Asp66 in Set B causes the sidechain to flip out and become solvent exposed, similar to what has been observed in the V66E simulations; correspondingly, formation of the Asp19-Lys63 salt-bridge, which induces the partial unfolding in the Set A-V66D simulations, is no longer observed. Unlike the V66E simulations, however, Asp66 sidechain rotation in Set B-V66D is only observed for the λ=1.0 window (compare Fig. 8a and 8b for SASA) and the solvent exposed Asp66 only interacts strongly with Lys63 but not other Lys residues.
3.2.2 pKa results
For V66D, ∂G/∂λ values are calculated for λ=0.0, 0.25, 0.5,0.75,1.0 using FEP simulations with about ~ 8 ns of sampling for each window. After statistical analysis (Table 1, Set A), the discarded (equilibrating) regions contained about 3.1 ns to 4.5 ns of trajectory. Block sizes of 11 to 153 ps are used for block averaging of raw data with the number of blocks varying between 30 to 320 (n ≥ 24). Figure 5b shows a representative plot of ∂G/∂λ for different λ values (for Set A) and integration of ∂G/∂λ over λ leads to a pKa shift of 13.3, which is much larger than the experimental pKa shift of 4.4. Clearly, although partial unfolding of the protein and subsequent solvent penetration are seen for the λ= 1.0 window, the protein with an ionized Asp66 is only poorly stabilized especially for lower λ windows, leading to a significantly overestimated pKa shift. For example, comparison of ∂G/∂λ values for Asp66 (Table 2, Set A) with those for Glu66 clearly shows significant differences for λ=0.6, 0.75 and 1.0 windows. In Set B-V66D simulations, although Asp66 rotation is also observed upon ionization, such rotation occurs only in the λ= 1.0 window. As a result, the predicted pKa shift is also very large, 12.8 pKa units as compared to the experimental value of 4.4 pKa units.
The results so far illustrate that in response to the ionization of Asp/Glu66 the protein may undergo structural changes at both the sidechain (Glu66/Asp66) and mainchain (Asp66) scales. To explain the large pKa shifts calculated for Asp66, one may argue that they are due to insufficient sampling in the FEP simulations and if partial unfolding or sidechain rotation occurs in all windows the computed pKa would be much lower. To test this hypothesis we construct two additional sets of FEP simulations for V66D. In Set C, all λ states use the partially unfolded protein structures taken from the λ=1.0 window of the Set A-V66D simulation. Interestingly, the computed pKa shift remains very high, about 7.5 pKa units. In fact, if the similar set of partially unfolded structures are used for V66E, very high pKa shifts (11.8, Set D for V66E in Table 2) are also computed. Therefore, these results indicate that the partial unfolding and subsequent solvent penetration accessed in the nanosecond-scale MD simulations are not sufficient to stabilize the protein with an ionized Asp66/Glu66.
In Set D for V66D, structures are taken from the Set A-V66E simulations for all the λ windows (Glu66 is then replaced by Asp). As a result, the similar sets of sidechain configurations are sampled for the titritable group; i.e., the Asp66 sidechain is flipped out and solvent accessible for λ=0.6,0.75,1.0. As expected, the estimated pKa shift is 3.2 pKa units, which is close to both the V66E results (Set A and B) and the experimental value of 4.4; the close agreement between the V66E and V66D results confirms that the EXGR link-atom treatment [29] consistently applies to both Glu and Asp sidechains here (also see Supporting Information), excluding the possibility that the large deviations found in other sets of V66D simulations are due to link-atom treatment. Examination of the free energy derivatives (Table 2) and solvation (Fig. 8, 9) suggest that Asp66 is more solvent accessible in the Set D λ= 1.0 window, although the largest differences in the free energy derivatives between Set D and A occur for λ= 0.0 and 0.75. Clearly, solvation can’t be the only factor that dictate the different free energy derivatives and computed pKa values.
3.3 Dissecting electrostatic contributions
To better understand the correlation between the observed structural changes at different scales and the rather different computed pKa values (especially for Aps66 in V66D), perturbative analysis is carried out in which the electrostatic contribution to (Eq. 1) is analyzed systematically. Specifically, the contribution from a specific group i to is evaluated as,
| (2) |
where
| (3) |
Here is the electrostatic energy for the E-RCOO(H/D) state without the contribution from group i. Integration of over λ gives the perturbative contribution of group i to the pKa; it is a perturbative estimate because the original trajectories with the full electrostatic interactions are used in the equilibrium average. Previous studies [17] suggest that such perturbative analysis tends to overestimate the absolute magnitude of contributions, especially those from charged residues, but the relative trends are meaningful.
Figure 10a shows the perturbative results for the protein residues (those in the GSBP inner region, which include 94 residues) in the Set A-V66E simulation. Not surprisingly, large contributions come mainly from charged residues, such as Lys16, Lys63 and Glu67. Among those, some (e.g., Lys16, Lys63 in Fig. 1) undergo substantial displacements upon rotation of Glu66, while others (e.g. Glu67) makes major contributions by remaining close to Glu66 throughout the titration process. For Set B-V66E, which produces a very similar pKa value for Glu66 to Set A, the perturbative results are also very similar (Fig. S5a in the Supporting Information), highlighting the reproducibility of the analysis. For Set D-V66E, in which the partially unfolded structures from Set A-V66D simulations are used as the starting structure, a very large pKa shift of 11.8 is observed (Table 2). Perturbative analysis (Fig. 10b) indicates that the major difference from Set A-V66E comes from three lysine residues: Lys16, Lys63 and Lys9. Among them, Lys16 and Lys63 form salt-bridge interactions with Glu66 in high-λ windows in the Set A-V66E simulations, while no such interaction is observed in the Set D-V66E simulations due to the different sidechain conformation of Glu66 (see Fig. S3 in the Supporting Information); such differences in the interaction pattern expectedly lead to different contributions to the pKa of Glu66. Lys9, by contrast, is rather far from Glu66 and largely static during the simulations; therefore, its variable contribution to the Glu66-pKa is due purely to the different configurations of the Glu66 sidechain in different sets of simulations. Perturbative analysis indicates that solvation also plays a role, although the effect seems substantially smaller than the protein contributions; e.g., zeroing all charge interactions from water changes ΔGE–RCOO(H/D) between Set A/D-V66E by −5.7 kcal/mol (i.e., favoring Set D), while doing so for all inner-region protein residues changes ΔΔGE–RCOO(H/D) by +18.1 kcal/mol (i.e., favoring Set A).
Figure 10.

Perturbative analysis for protein contributions to the free energy of deprotonation (see Eq. 1–3 in main text) of Glu66/Asp 66 in different sets of simulations. In Set A-V66E and Set D-V66D, the titritable group is flipped towards the protein surface; in Set D-V66E and Set A-V66D, there is limited displacements of the titritable group but the nearby region is partially unfolded. In (a) and (c), positive (negative) values indicate unfavorable (favorable) contributions; (b): difference between Set D-V66E and Set A-V66E; (d): difference between Set A-V66D and Set D-V66D;
For V66D, the set D simulation is best compared to the Set A-V66E simulation. Indeed, the perturbative results for the protein contribution (Fig. 10c) closely resemble those for Set A-V66E (Fig. 10a), although the contributions from Lys16 and Lys63 are lower, which is somewhat expected due to the longer distances between these residues and the shorter Asp66 (vs. Glu66). Moreover, the differences between the sidechain-flipped (Set D-V66D, Set A-V66E) and the partially unfolded (Set A-V66D, Set D-V66E) simulations are also quite similar (Fig. 10b vs. 10d), with Lys16, Lys63, Asp95 and Lys9 making the major contributions. Other than the difference in the magnitude of contributions from Lys16 and Lys63, it is interesting to note that the behavior of Lys9 is rather different in the V66D and V66E cases. As mentioned above, Lys9 is rather static in all the simulations; thus the difference mainly reflects that the titritable sidechain adopts different conformations in the V66D and V66E simulations, even with similar starting configurations in the MD simulations. Moreover, perturbative analysis indicates that the large pKa difference in Set A/D-V66D simulations has relatively small net contribution from the protein residues (+2.5 kcal/mol, vs. +18.1 kcal/mol for V66E), while solvation plays a more significant role (+11.9 kcal/mol, vs. −5.7 kcal/mol for V66E). In other words, although the computed pKa difference between the two sets (sidechain-flipped vs. partially unfolded) is rather similar for V66D and V66E, the underlying molecular contribution are different and there is a protein/solvent compensation effect that presumably reflects the solvent response to different configurations of charge sidechains (including the titritable group).
These perturbative analyses suggest that Lys16, Lys63, Glu67 and Asp95 are most interesting residues that can be mutated in future experiments to probe their contributions to the pKa values of residue 66 and the corresponding titration mechanisms. The results will provide new insights into the energetic coupling between surface and internal residues in proteins.
4 Concluding Remarks
pKa predictions for buried residues are challenging because the titration process is likely coupled to significant structural transitions of both the protein and solvent. Methods that rely on continuum electrostatics have to capture such effects with a phenomenological dielectric constant, whose value is difficult to determine and interpret in a well-defined fashion for a heterogeneous system. [7–9] Microscopic simulations, therefore, are preferred in challenging cases although the quality of the results may depend critically on many factors, such as the description of electronic polarization of the protein interior and the proper sampling of structural transitions during titration. The purpose of this series of study is to identify the relative importance of these factors using SNase as an example, which is of fundamental value and may lead to effective pKa prediction methods for challenging cases. Certain insights from such analysis may also be applicable to the general discussion of factors that determine the accuracy of QM/MM simulations of reactive processes in biomolecules.
An interesting observation from the QM/MM-FEP simulations here is that the protein/solvent response to titration may differ substantially even for titritable groups of very similar chemical nature and apparent pKa values. Both Glu and Asp at the 66th position in the relevant SNase mutants have measured pKa around +4.4–4.5 units higher than the solution value, but the behaviors of the two pKa simulations are rather different.
With a sufficiently long sidechain, a simple rotation of Glu66 allows its ionized group to be stabilized by solvent and nearby charged residues (e.g., Lys16, Lys63); there is little disruption of the protein conformation throughout the simulations. Such rotation can be observed consistently in independent simulations in the ionization direction (Set A and B), although spontaneous burial of the neutral Glu66 seems kinetically more difficult (Set C). The computed pKa in both Set A and B are consistently close to the experimentally measured pKa shift, suggesting that such a local-scale structural change is close to the realistic behavior of SNase during titration. Indeed, there is so far no evidence for major structural changes during the ionization of the V66E mutant. The pKa of E66 is not as high as one would expect from simple electrostatic arguments because of a conformational change in the side chain. The observed pKa value thus reflects the free energy of deprotonating E66 inside the protein plus a free energy lowering due to adopting a side-chain conformation that exposes to the charged form to solvent. Thus, the apparent high protein dielectric constant needed to reproduce the observed pKa [7,10] is a mix of protein dieletric and solvent dielectric.
With merely one -CH2 unit shorter, a simple rotation of Asp66 does not lead to sufficient solvent stabilization of the ionized state. As a result, partial unfolding is observed in some windows for the charged state (Set A); interestingly, partial unfolding is observed for a β-sheet region in the simulations while UV-CD spectra seem to indicate unwinding of an α helical region. [9] Furthermore, even with such significant structural disruption or partial flip of the sidechain (Set B), the calculated pKa shift (~ +13) is significantly higher than the experimental shift of 4.4. By forcing the Asp66 sidechain to adopt similar configurations as Glu66 in the V66E simulations, a very reasonable pKa shift is obtained for V66D. Such “success” doesn’t mean that the behavior of Asp66 is indeed similar to Glu66 in reality because it remains difficult to confirm that sidechain flipping is the energetically preferred structural change during V66D titration. By contrast, these large variations in the computed pKa values strongly indicate that Asp66 has a much more complex behavior than Glu66 during the titration process. In other words, the apparently high protein dielectric constant for V66D [7,9] is expected to have a more complex microscopic origin than V66E.
We emphasize that although the differences between V66E and V66D, in hindsight, seem intuitive, they are not straightforward to predict a priori. Indeed, the recent study of Warshel et al. [14] emphasized the importance of both large-scale conformational transitions and including electronic polarization for reproducing the pKa of V66E, while we found that neither is as critical in our calculations for this particular mutant of SNase. As discussed in the Introduction, it is not surprising that some level of structural transitions are coupled to the titration of a buried residue, the challenge is to predict the nature and scale of the structural transitions and the corresponding free energy change, which are all reflected in the computed pKa value.
From the technical perspective, the agreement between the computed pKa for Glu66 (Sets A & B) and experiment suggests that, unlike the conclusions from several recent studies that employed limited conformational sampling, [18, 19] the lack of electronic polarization for the protein interior is unlikely a major source of error for pKa shift calculations, which is somewhat expected considering error cancellation; the generality of this statement is being tested in other systems. The need of employing enhanced sampling techniques in the free energy simulations, [39,40] on the other hand, seems much more compelling and can potentially make a very large impact on the computed pKa values. Multiple nanoseconds of simulations per λ window in the most straightforward thermodynamic integration framework, as done here, are sufficient only if the structural response is very local in nature and the involvement of multiple hydration states [11] is not severe. To be efficient, such enhanced sampling technique needs to focus on structural transitions (both protein and solvent) tightly coupled to titration. In this regard, combining an interesting over-charging scheme [14] with Hamiltonian Replica Exchange [41,42] should be a viable choice; this is being investigated and the results will be reported separately.
Supplementary Material
Supporting Information
Additional studies of pKa calculations of amino acids in solution using the SCC-DFTB/MM-GSBP approach are included, which are useful for further exploring the impact of link-atom schemes and choice of reference for pKa shift calculations. Figures for additional analysis of the V66E/V66D-SNase results are also included. This material is available free of charge via the Internet at http://pubs.acs.org.
Acknowledgments
The research discussed here have been partially supported from the National Science Foundation (CHEM-CAREER-0348649) and the National Institutes of Health (R01-GM071428-01). N.G. acknowledges Junjun Yu for providing some relevant data for solution simulations cited in the Supporting Information. Q.C. also acknowledges a Research Fellowship from the Alfred P. Sloan Foundation. Computational resources from the National Center for Supercomputing Applications at the University of Illinois are greatly appreciated. Q.C. thanks Prof. B. Garcia-Moreno for the encouragement to work on the SNase system and for discussions.
References and Notes
- 1.Fersht A. Structure and Mechanism in Protein Science: A Guide to Enzyme Catalysis and Protein Folding. W.H. Freeman and Company; 1999. [Google Scholar]
- 2.Kim J, Mao J, Gunner MR. Are acidic and basic groups in buried proteins predicted to be ionized? J Mol Biol. 2005;348:1283–1298. doi: 10.1016/j.jmb.2005.03.051. [DOI] [PubMed] [Google Scholar]
- 3.Yang A, Gunner MR, Sampogna R, Sharp K, Honig B. On the calculation of pkas in proteins. Proteins: Struct, Funct, and Genet. 1993;15:252–265. doi: 10.1002/prot.340150304. [DOI] [PubMed] [Google Scholar]
- 4.Antosiewicz J, McCammon JA, Gilson MK. Prediction of ph-dependence properties of proteins. J Mol Biol. 1994;238:415–436. doi: 10.1006/jmbi.1994.1301. [DOI] [PubMed] [Google Scholar]
- 5.Schultz CN, Warshel A. What are the dielectric constants of proteins and how to validate electrostatic models? Proteins. 2001;44:400. doi: 10.1002/prot.1106. [DOI] [PubMed] [Google Scholar]
- 6.Sham YY, Chu ZT, Warshel A. Consistent calculations of pKa ‘s of ionizable residues in proteins: Semi-microscopic and microscopic approaches. Proteins: Struct, Funct, and Genet. 2001;44:400–417. [Google Scholar]
- 7.Fitch CA, Karp DA, Lee KK, Stites WE, Lattman EE, García-Moreno E B. Experimental pka values of buried residues: analysis with continuum methods and role of water penetration. Biophys J. 2002;82:3289–3304. doi: 10.1016/s0006-3495(02)75670-1. [DOI] [PMC free article] [PubMed] [Google Scholar]
- 8.Denisov VP, Schlessman JL, Halle B, García-Moreno E B. Stabilization of internal charges in a protein: water penetration or conformational change? Biophys J. 2004;87(3):3982–3994. doi: 10.1529/biophysj.104.048454. [DOI] [PMC free article] [PubMed] [Google Scholar]
- 9.Karp DA, Gittis AG, Stahley MR, Fitch CA, Stites WE, García-Moreno E B. High apparent dielectric constant inside a protein reflects structural reorganization coupled to the ionization of an internal Asp. Biophys J. 2007;92:2041–53. doi: 10.1529/biophysj.106.090266. [DOI] [PMC free article] [PubMed] [Google Scholar]
- 10.Dwyer J, Gittis A, Karp DA, Lattman EE, Spencer D, Stites W, García-Morenoc E B. High apparent dielectric constants in the interior of a protein reflect water penetration. Biophys J. 2000;79:1610–1620. doi: 10.1016/S0006-3495(00)76411-3. [DOI] [PMC free article] [PubMed] [Google Scholar]
- 11.Damjanovic A, Schlessman JL, Fitch CA, García AE, García-Moreno E B. Role of flexibility and polarity as determinants of the hydration of internal cavities and pockets in proteins. Biophys J. 2007;93:2791–804. doi: 10.1529/biophysj.107.104182. [DOI] [PMC free article] [PubMed] [Google Scholar]
- 12.Warshel A, Russell ST. Calculations of electrostatic interactions in biological systems and in solutions. Quart Rev Biophys. 1984;17:283. doi: 10.1017/s0033583500005333. [DOI] [PubMed] [Google Scholar]
- 13.Simonson T, Carlsson J, Case DA. Proton binding to proteins: pka calculations with explicit and implicit solvent models. J Am Chem Soc. 2004;126:4167. doi: 10.1021/ja039788m. [DOI] [PubMed] [Google Scholar]
- 14.Kato M, Warshel A. Using a charging coordinate in studies of ionozation induced partial unfolding. J Phys Chem B. 2006;110:11566–11570. doi: 10.1021/jp061190o. [DOI] [PubMed] [Google Scholar]
- 15.Riccardi D, Schaefer P, Cui Q. pka calculations in solution and proteins with QM/MM free energy perturbation simulations. J Phys Chem B. 2005;109:17715–17733. doi: 10.1021/jp0517192. [DOI] [PubMed] [Google Scholar]
- 16.Riccardi D, Schaefer P, Yang Y, Yu H, Ghosh N, Prat-Resina X, König Peter, Li G, Xu D, Guo H, Elstner M, Cui Qiang. Development of effective quantum mechanical/molecular mechanical (QM/MM) methods for complex biological processes (Feature Article) J Phys Chem B. 2006;110:6458–6469. doi: 10.1021/jp056361o. [DOI] [PubMed] [Google Scholar]
- 17.Riccardi D, Cui Q. pka analysis for the zinc-bound water in human carbonic anhydrase ii: benchmark for “multi-scale” QM/MM simulations and mechanistic implications. J Phys Chem A. 2007;111:5703–5711. doi: 10.1021/jp070699w. [DOI] [PubMed] [Google Scholar]
- 18.Jensen JH, Li H, Robertson AD, Molina PA. Prediction and rationalization of protein pka values using QM and QM/MM methods. J Phys Chem A. 2005;109:6634–6643. doi: 10.1021/jp051922x. [DOI] [PubMed] [Google Scholar]
- 19.MacDermaid CM, Kaminski GA. Electrostatic polarization is crucial for reproducing pka shifts of carboxylic residues in turkey ovomucoid third domain. J Phys Chem B. 2007;111:9036–9044. doi: 10.1021/jp071284d. [DOI] [PubMed] [Google Scholar]
- 20.Riccardi D, König P, Prat-Resina X, Yu H, Elstner M, Frauenheim T, Cui Q. “proton holes” in long-range proton transfer reactions in solution and enzymes: A theoretical analysis. J Am Chem Soc. 2006;128:16302–16311. doi: 10.1021/ja065451j. [DOI] [PMC free article] [PubMed] [Google Scholar]
- 21.Kato M, Pisliakov AV, Warshel A. The barrier for proton transport in aqauporins as a challenge for electrostatic models: The role of protein relaxation in mutational calculations. Proteins: Struct Funct Bioinfor. 2006;64:829–844. doi: 10.1002/prot.21012. [DOI] [PubMed] [Google Scholar]
- 22.Elstner M, Porezag D, Jungnickel G, Elsner J, Haugk M, Frauenheim T, Suhai S, Seifert G. Self-consistent-charge density-functional tight-binding method for simulations of complex materials properties. Phys Rev B. 1998;58:7260. [Google Scholar]
- 23.Schaefer P, Riccardi D, Cui Q. Reliable treatment of electrostatics in combined qm/mm simulation of macromolecules. J Chem Phys. 2005;123:014905. doi: 10.1063/1.1940047. [DOI] [PubMed] [Google Scholar]
- 24.Li G, Cui Q. pka calculations with QM/MM free energy perturbations. J Phys Chem B. 2003;107:14521–14528. [Google Scholar]
- 25.Im W, Bernéche S, Roux B. Generalized solvent boundary potential for computer simulations. J Chem Phys. 2001;114(7):2924–2937. [Google Scholar]
- 26.Nina M, Roux B. Atomic radii for continuum electrostatics calculations based on molecular dynamics free energy simulations. J Phys Chem B. 1997;101:5239–5248. [Google Scholar]
- 27.Rychaert JP, Ciccotti G, Berendsen HJ. Numerical integration of the cartesian equations of motion of a system with constraints: molecular dynamics of n-alkanes. J Comput Phys. 1977;23:327–341. [Google Scholar]
- 28.Stote R, Karplus SDJM. On the treatment of electrostatics interactions in biomolecular simulations. J Chim Phys. 2419;88 [Google Scholar]
- 29.Koenig P, Hoffmann M, Frauenheim T, Cui Q. A critical evaluation of different QM/MM frontier treatments with SCC-DFTB as the QM method. J Phys Chem B. :109. doi: 10.1021/jp0442347. [DOI] [PubMed] [Google Scholar]
- 30.Straatsma TP, McCammon JA. Computational alchemy. Annu Rev Phys Chem. 1992;43:407–435. [Google Scholar]
- 31.Kollman P. Free energy calculations. Chem Rev. 1993;93:2395–2417. [Google Scholar]
- 32.Simonson T, Archontis G, Karplus M. Free energy simulations come of age: Protein-ligand recognition. Acc Chem Res. 2002;35:430–437. doi: 10.1021/ar010030m. [DOI] [PubMed] [Google Scholar]
- 33.Li G, Cui Q. pka calculations with QM/MM free energy perturbations. J Phys Chem B. 2003;107:14521. [Google Scholar]
- 34.Simonson T. Gaussian fluctuations and linear response in an electron-transfer protein. Proc Acad Natl Sci USA. 2002;99:6544–6549. doi: 10.1073/pnas.082657099. [DOI] [PMC free article] [PubMed] [Google Scholar]
- 35.Levy R, Belhadj M, Kitchen D. Gaussian fluctuation formula for electrostatic free energy changes. J Chem Phys. 1991;95:3627–3633. [Google Scholar]
- 36.Schiferl KS, Wallace DC. Statistical errors in molecular dynamics averages. J Chem Phys. 1985;83:5203–5209. [Google Scholar]
- 37.MacKerell AD, Jr, et al. All-atom empirical potential for molecular modeling and dynamics studies of proteins. J Phys Chem B. 1998;102:3586–3616. doi: 10.1021/jp973084f. [DOI] [PubMed] [Google Scholar]
- 38.Damjanovic ELA, Garcia-Moreno E B, Garcia AE. Molecular dynamics study of water penetration in staphylococcal nuclease. Proteins: Struct, Funct, and Bioinf. 2005;60:433– 449. doi: 10.1002/prot.20486. [DOI] [PubMed] [Google Scholar]
- 39.Li HZ, Fajer M, Yang W. Simulated scaling method for localized enhanced sampling and simultaneous “alchemical” free energy simulations: A general method for molecular mechanical, quantum mechanical, and quantum mechanical/molecular mechanical simulations. J Chem Phys. 2007;126:024106. doi: 10.1063/1.2424700. [DOI] [PubMed] [Google Scholar]
- 40.Li HZ, Yang W. Sampling enhancement for the quantum mechanical potential based molecular dynamics simulations: A general algorithm and its extension for free energy calculation on rugged energy surface. J Chem Phys. 2007;126:114104. doi: 10.1063/1.2710790. [DOI] [PubMed] [Google Scholar]
- 41.Fukunishi H, Watanabe O, Takada S. On the hamiltonian replica exchange method for efficient sampling of biomolecular systems: Application to protein structure prediction. J Chem Phys. 2002;116:9058–9067. [Google Scholar]
- 42.Kwak W, Hansmann UH. Efficient sampling of protein structures by model hopping. Phys Rev Lett. 2005;95:138102–138104. doi: 10.1103/PhysRevLett.95.138102. [DOI] [PMC free article] [PubMed] [Google Scholar]
Associated Data
This section collects any data citations, data availability statements, or supplementary materials included in this article.
Supplementary Materials
Supporting Information
Additional studies of pKa calculations of amino acids in solution using the SCC-DFTB/MM-GSBP approach are included, which are useful for further exploring the impact of link-atom schemes and choice of reference for pKa shift calculations. Figures for additional analysis of the V66E/V66D-SNase results are also included. This material is available free of charge via the Internet at http://pubs.acs.org.