Abstract
We developed a technique for performing quantitative phase reconstructions from differential phase contrast images obtained using a configured detector in a scanning transmission X-ray microscope geometry. The technique uses geometric optics to describe the interaction of the X-ray beam with the specimen, which allows interpretation of the measured intensities in terms of the derivative of the phase thickness. Integration of the resulting directional derivatives is performed using a Fourier integration technique. We demonstrate the approach by reconstructing simulated measurements of a 0.5-µm-diameter gold sphere at 7-keV photon energy.
Keywords: Differential phase contrast, Configured detector, Phase retrieval, STXM
1. Introduction
X-ray imaging techniques have long capitalised on absorption as the main form of contrast. Only more recently have phase-contrast techniques, depending instead on the real component δ of the refractive index, gained popularity; see for example Refs. [1–7].
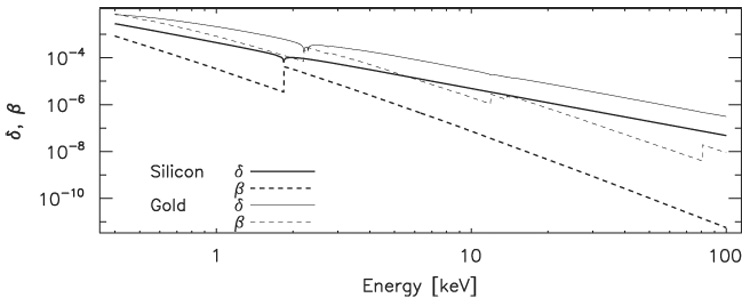
Fig. 1 presents the real and imaginary components of the complex refractive index n = 1 – δ – iβ for silicon and gold at X-ray energies between 0.5 and 100 keV, covering the intermediate and high-energy X-ray ranges [8]. Although the level of contrast realised during an experiment is not necessarily proportional to δ and β, we use these to indicate the energy trend of these parameters and generally relate them to the achievable contrast level.
Fig. 1.

δ (solid lines) and β (dashed lines) for silicon (heavy lines) and gold (thin lines), for energies between 0.5 and 100 keV, determined using FFAST [8]. δ ∝ E−2, whereas β ∝ E−4 (approximately, away from absorption edges), and so phase-based techniques have a significant advantage as X-ray energy increases. Phase contrast is clearly strong for silicon at all energies; less appreciated is the fact that phase contrast is also strong for heavy metals such as gold across most of the X-ray energy range.
For a low-Z material such as silicon, δ is one-half to four orders of magnitude greater than β over this energy range, therefore this material is well suited to investigation using phase-contrast techniques. The figure also indicates that phase-contrast methods are suitable for studies of heavy metals such as gold across most of this energy range, with the possible exception of the neighbourhood of absorption edges, where absorption effects may become significant.
A number of recent articles have reported using the transmitted intensity in scanning transmission X-ray microscope (STXM) geometries to obtain differential phase contrast (DPC) images. These experimenters have used a variety of detector designs, including a fast-readout, low-pixel density charge-coupled device (CCD) detector [9,10] and an optimised silicon-diode detector [11,12]. In this article we present simulated results that assume only a quadrant detector. We use a refractive model of the interaction of the X-ray beam with the specimen, interpreting the measured intensities as horizontal and vertical components of the beam deflection, and thence as orthogonal components of the value of the gradient of the phase thickness ∇(δt) of the illuminated specimen.
2. The geometrical interpretation
In the STXM, X-rays are focused onto a specimen, typically using a zone-plate lens. When a diffractive optic is used, a combination of central stop and order-sorting aperture is typically employed to prevent undesired diffraction orders from reaching the specimen. As the selected amplitude propagates beyond the focal plane it diverges again, and the intensity distribution in the far field forms an image of the zone plate with central stop. It is interesting to note that the numerical aperture (NA) of the objective lens is typically of order 5 mrad, the specimen surface angles are typically of order 1 rad, and the beam deflection angles are typically of order 1 µrad for intermediate and high-energy X-rays. The three angular scales associated with this geometry are extraordinarily well spaced over six orders of magnitude.
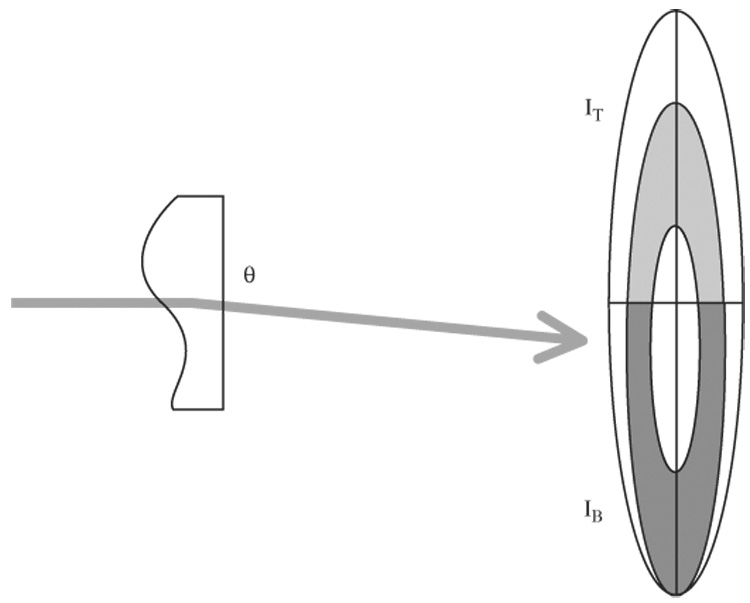
Fig. 2 shows the geometrical optics interpretation that we use to relate the deflection of the beam at the detector plane to the differential phase thickness ∇(δt). Within the framework of the geometrical model the vertical component of the DPC signal is given by [13]
| (1) |
where IT and IB are the counts recorded in the top and bottom halves of the detector, fZP is the focal length of the zone plate, RZP and RCS are the radii of the zone plate and the central stop, respectively, and ∇V(δt) is the vertical component of the derivative of the phase thickness δt. An expression for the horizontal component is similarly derived.
Fig. 2.

Illustration of the geometrical model of the interaction of the beam with the specimen, and interpretation of the resulting DPC images. The beam is refracted at the specimen, resulting in a net angular deflection. We relate this angular deflection to a shift of the centre-of-mass of the intensity in the detector plane. The vertical component of the angular deflection of the beam shown here is quantified using IT and IB.
3. Reconstruction
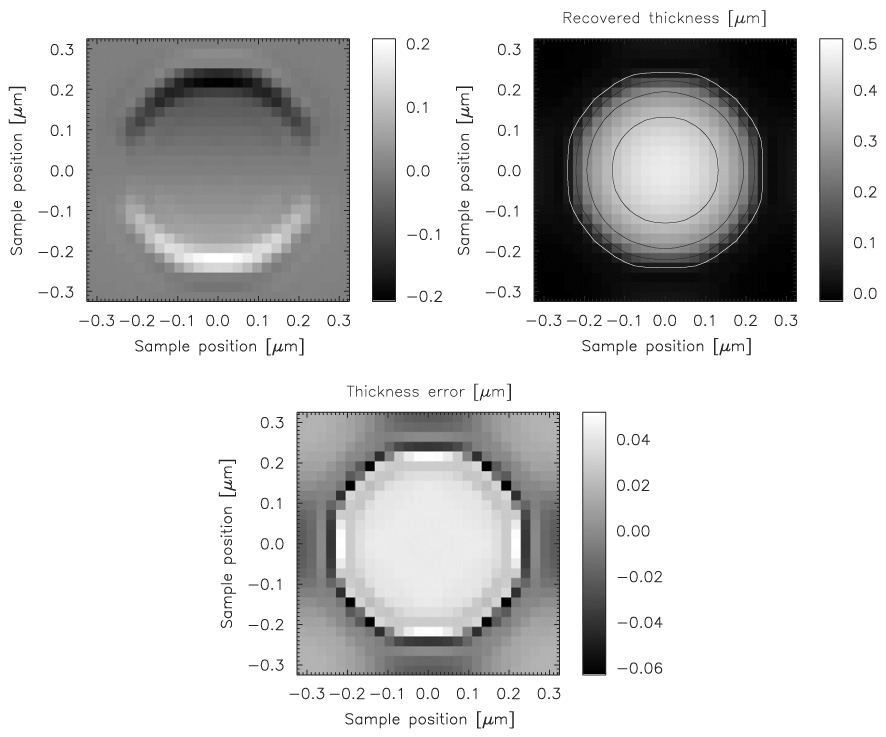
We reconstructed the phase thickness δt from the resulting ∇V(δt) and ∇H(δt) images using a Fourier integration technique [7,14]. Fig. 3 presents simulated values of the vertical component of the DPC signal (Eq. 1), the recovered thickness, and the difference between the input and recovered thicknesses. The simulated object was a 0.5-µm-diameter gold sphere and the x-ray energy was chosen to be 27 keV. The reconstruction is in good agreement with the input, with peak differences below about 10% of the maximum object thickness. The average thickness error is around 0.02 µm. Although the technique generally determines the phase thickness δt, we are able to show results in terms of thickness because δ is known.
Fig. 3.

Results of reconstructing simulated DPC STXM measurement of a 0.5-µm-diameter gold sphere calculated for 27 keV x-rays. [Left] Vertical component of the DPC signal, as described by Eq. (1), [Centre] reconstructed thickness and [Right] differences from the input thickness of the reconstruction. The absolute thickness obtained from the reconstruction is in excellent agreement with the input values, with peak differences below about 10% of the maximum specimen thickness.
4. Conclusion
We have shown that DPC images obtained in a STXM geometry can be interpreted to provide quantitative knowledge of the differential phase thickness ∇(δt). Our further simulations indicate that the technique can be applied to investigations of a wide variety of materials and over a wide range of X-ray energies.
Acknowledgments
Use of the Advanced Photon Source was supported by the U.S. Department of Energy, Office of Science, Office of Basic Energy Sciences, under Contract No. DE-AC02-06CH11357.
References
- 1.Bonse U, Hart M. Appl. Phys. Lett. 1965;6(8):155. [Google Scholar]
- 2.Snigirev A, Snigireva I, Kohn V, Kuznetsov S, Schelokov I. Rev. Sci. Instrum. 1995;66(12):5486. [Google Scholar]
- 3.Nugent K, Gureyev T, Cookson D, Paganin D, Barnea Z. Phys. Rev. Lett. 1996;77(14):2961. doi: 10.1103/PhysRevLett.77.2961. [DOI] [PubMed] [Google Scholar]
- 4.Paganin D, Nugent KA. Phys. Rev. Lett. 1998;80(12):2586. [Google Scholar]
- 5.Allman B, McMahon P, Tiller J, Nugent K, Paganin D, Barty A, McNulty I, Frigo S, Wang Y, Retsch C. J. Opt. Soc. Am. A. 2000;17(10):1732. doi: 10.1364/josaa.17.001732. [DOI] [PubMed] [Google Scholar]
- 6.Pfeiffer F, Kottler C, Bunk O, David C. Phys. Rev. Lett. 2007;98(10):108105. doi: 10.1103/PhysRevLett.98.108105. [DOI] [PubMed] [Google Scholar]
- 7.Kottler C, David C, Pfeiffer F, Bunk O. Opt. Express. 2007;15(3):1175. doi: 10.1364/oe.15.001175. [DOI] [PubMed] [Google Scholar]
- 8.Chantler C, Olsen K, Dragoset R, Kishore A, Kotochigova S. Z.D.S. 2005 〈 http://physics.nist.gov/PhysRefData/FFast/Text/cover.html〉.
- 9.Morrison G, Eaton W, Barrett R, Charalambous P. J. Phys. IV France. 2003;104:547. [Google Scholar]
- 10.Gianoncelli A, Morrison G, Kaulich B, Bacescu D, Kovac J. Appl. Phys. Lett. 2006;89(251117):1. [Google Scholar]
- 11.Feser M, Hornberger B, Jacobsen C, De Geronimo G, Rehak P, Holl P, Strüder L. Nucl. Instr. and Meth. A. 2006;565:841. [Google Scholar]
- 12.Hornberger B, Feser M, Jacobsen C. Ultramicroscopy. 2007;107:644. doi: 10.1016/j.ultramic.2006.12.006. [DOI] [PubMed] [Google Scholar]
- 13.de Jonge M, Vogt S, Legnini D, McNulty I, Paterson D, Hornberger B, Holzner C, Jacobsen C. submitted. 2007 doi: 10.1016/j.nima.2007.08.111. [DOI] [PMC free article] [PubMed] [Google Scholar]
- 14.Arnison M, Larkin K, Sheppard C, Smith N, Cogswell C. J. Microsc. 2004;214(1):7. doi: 10.1111/j.0022-2720.2004.01293.x. [DOI] [PubMed] [Google Scholar]


