

Abstract
We are evaluating PCT imaging in conjunction with NIR-dye labeled Herceptin antibody for noninvasive assessment of HER2 expression in tumors. Herceptin was labeled with Alexa Fluor-750 amine reactive dye for characterization of photoacoustic and fluorescence signals. Measurements were performed in solution and after incubation in cultured cell lines that were positive or negative in expression of HER2. The dye to antibody ratio was controlled to achieve a broad range of degree of labeling (DOL = 2 to 15). Photoacoustic signal intensity of Herceptin-dye conjugates in solution increased with increasing over the entire DOL range studied. In contrast, fluorescence exhibited significant quenching for higher DOL. In vitro PCT imaging of the labeled HER2 (+) and HER2 (−) cells revealed the targeting specificity of the NIR-dye labeled Herceptin. In HER2 (+) cells lines, photoacoustic signal intensity gradually increased with increasing DOL and with increasing number of cells. These results demonstrate that PCT-based measurement of HER2 receptor binding using NIR-dye labeled Herceptin is feasible. The absence of a quenching effect with increased DOL advantages this method over traditional methods based on fluorescence measurement.
INTRODUCTION
Recently, there has been a growing interest in photoacoustic computed tomography (PCT) imaging (1–8). It is a noninvasive imaging modality capable for obtaining both structural and functional information in biological tissues. In PCT, short pulses of stimulating radiation (e.g. laser or radiowaves) are differentially absorbed in tissue, resulting in a subsequent thermal expansion and ultrasonic emission. The ultrasonic signals are measured by use of a wide-band ultrasonic transducers. Photoacoustic signals thus obtained are free from the deleterious effects of optical scattering in biological tissue. The imaging depth in tissue exceeds standard optical imaging techniques, and systems can be designed to achieve excellent spatial resolution throughout a 3-D volume. Over the last ten years, the technology has advanced from relative obscurity to demonstration levels for a variety of applications including breast imaging, animal brain imaging (9, 10). A natural extension of imaging the intrinsic optical contrast of tissue is to demonstrate the ability of photoacoustic imaging to detect contrast agents based on optically absorbing dyes that exhibit well defined absorption peaks in the near infrared (NIR). The ultimate goal of this work is to develop a NIR-dye based, target-specific contrast agent that can be used as a PCT probe for cancer imaging.
The HER2 gene is among those most frequently altered in human cancer (11, 12). HER2 encodes a 185 K Da protein that resides on the surface of the cell and has receptor tyrosine kinase activity. The receptor, which is a member EGFR family, is expressed on the cell membrane of a variety of epithelial cell types, and through the binding of specific factors, regulates aspects of cell growth and division. The level of gene amplification is correlated with protein expression (13, 14). While HER2 is expressed in normal cells and several types of cancers, it is of particular interest in breast cancer (15). It has elevated levels in 25–30% of breast cancers, and is linked to unfavorable prognosis, shorter relapse time and low survival rate (11). A breakthrough in the treatment of metastatic breast cancer occurred with the FDA’s approval of Herceptin (Genentech, South San Francisco, CA) in 1998. Herceptin is a humanized antibody that has a high binding affinity to the HER2 cell surface receptor. Binding of Herceptin to HER2 prevents the binding of the growth factors to the receptor, resulting in tumor growth inhibition. Herceptin is an excellent candidate for the development of a photoacoustic molecular probe because of its clinical relevance, and because there is currently not an imaging methodology available for clinicians to image HER2 binding in humans (16, 17). However, the low HER2 receptor density limits the concentration of bound molecular probe, requiring a highly sensitive imaging system for detection. A second complication is the difficulty of identifying a suitable contrast agent for the monoclonal antibody.
NIR-dyes of labeled Herceptin molecular probe may increase the localized optical absorption at their point of localization in tissue. When NIR-dyes absorb light energy, electrons within the molecules jump to excited states and then promptly dissipate this energy in two prominent ways. A nonradiative pathway produces heat and subsequent thermal expansion in tissue, giving rise to the photoacoustic signal. The second path is a radiative (emission) pathway, known as fluorescence (18). Simple energy conservation considerations suggest that what is not released as heat must be released as light (fluorescence): the more fluorescent the sample, the smaller the photoacoustic waveform (19).
The fraction of the absorbed light energy that is reradiated as fluorescence is termed as fluorescence quantum yield (QY). Often the fluorescence QY for NIR fluorescing dyes is very low, especially in the near infrared. For example, the fluorescence QY for cyanine dyes that fluoresce within the optical imaging window is typically 10–15% (20). The remaining 85–90% of the absorbed energy is available for the photoacoustic waveform. If we increase the number of dye molecules per antibody (generally known as degree of labeling, DOL) to greater than 3, the fluorescence QY of the attached dye molecule will decrease further because of its self-quenching behavior in the excited state (21, 22).
As Herceptin is a large molecule (185 K Da), it was anticipated that cell uptake would not be affected significantly if it is conjugated with several dye molecules. The NIR dyes with very low fluorescence QY appeared to be a good choice for PCT. By labeling Herceptin with several NIR-dye molecules, a large NIR absorption may be achieved with less fluorescence. Thus, we hypothesized that NIR-dye labeled Herceptin would be a suitable probe to detect breast cancer by PCT7. Herein we report the preparation and evaluation of Herceptin-dye conjugates with a broad range of DOLs as PCT probes for HER2 expressing breast cancer.
MATERIALS AND METHODS
Reagents
The amine-reactive dyes Alexa Fluor 750 (AF750) and AF647 were obtained as a dry powder from Invitrogen. One mg of the dye was dissolved in 200 μL of anhydrous DMSO (Sigma St. Louis. MO) under reduced light conditions and stored at −80°C. Herceptin antibody was obtained from Genentech (South San Francisco, CA).
Preparation of Herceptin-dye Conjugates
All steps were performed under reduced light conditions. Covalent conjugation reactions contained 5 mg/mL Herceptin and various molar ratios of AF750 in 0.1 M bicarbonate buffer, pH 8.5. Reaction volume was ~200 μL. Conjugation was initiated by addition of AF-750, followed by agitation (without frothing) for 2 h at RT. Dye-labeled Herceptin was purified by size-exclusion chromatography in Sephadex G-25 using (0.1M) bicarbonate buffer as eluent. Purity of the probe was checked by discontinuous phase gel-electrophoresis technique using a solution of free dye as standard. The degree of labeling (DOL) and the concentration of the conjugated Herceptin (mg/mL) were estimated using the extinction coefficients of Herceptin (ε280nm = 225,000 M−1 cm−1) and AF750 (ε749nm = 240,000 M−1 cm−1) in 0.1 M bicarbonate buffer, with correction for the 4.0% of measured absorbance at 280 nm due to AF750:
Herceptin-AF647 conjugates were prepared in similar way. DOL and concentration of conjugated Herceptin were estimated using the extinction coefficient of AF647 (ε650nm = 239,000 M−1 cm−1 ) in 0.1 M bicarbonate buffer, with correction for the 3.0% of measured absorbance at 280 nm due to AF647.
Instrumentation for probe imaging in solution
A protocol was developed to image AF-750 dye and dye-herceptin conjugates in solution. The imaging system was the Photoacoustic Spectrometry System (PASS) developed by OptoSonics, Indianapolis. Figure 1 shows the schematic diagram and imaging setup for the PASS system. The transducer array (custom 5.0 MHz, 128-element, Imasonic, France) was oriented vertically. The sample solution was held within a thin-walled FEP tube (Zeus, South Carolina, ID = 2.2 mm), and placed vertically in front of the array. The optical fiber was mounted so that excitation light entered the side of tank through a transparent glass window and hit the sample tube. The fiber output was first collimated with a lens and then reduced in intensity with a 12% neutral density (ND) filter thereby delivering a fluence of 6.2 mJ/cm2 to the sample, which is about an order of magnitude greater than the fluence used typically in our fluorescence imaging device. Mylar film (0.002″ aluminized PET, >99% reflectance), was placed in front of the array to protect it from scattered light. The imaging tank was filled with water to provide an acoustic path. The imaging field of view (FOV) was roughly a cube with side length of 6 mm.
Figure 1.

(a) Schematic diagram of PCT measurement of the probe in solution; (b) Instrument for PCT imaging of the probe in solution
The first step in the reconstruction process is to compute the first temporal derivatives of the incident pressure waveforms pr(t) from each of the 128 signals p’r(t) recorded with the linear array. In practice, we do not measure pr(t) directly, because the impulse response of the transducers used to record the thermoacoustic pressure was not a delta function. What we measure instead is :
| (1) |
where ir(t) is the impulse response of the transducer at position r and “*” denotes convolution. We then compute in a single filtering step:
| (2) |
where Ir(ω) and P’r(ω) are the Fourier transforms of the transducer impulse responses and signals recorded by each transducer element, respectively, and r denotes the spatial locations at which each of the 128 pressure signals were recorded. The apodizing function was used to bandwidth limit the signal to ωc; in this case ωc = 8 MHz. The last step in the reconstruction process is to backproject each of the computed using Eq. 2 over circular paths of radii τr(x,y.z)*vs, where τr(x,y.z) are the transit times for acoustic waves to travel from each volume element (x,y.z) to each detector location r, and vs is the velocity of sound.
Dual-wavelength subtraction was used to remove reconstruction artifacts. Data were acquired at 32 evenly spaced angles by rotating the sample tube. Images were obtained at each angle at 745 and 810 nm. Four laser (Vibrant NIR OPOTEK, www.optek.com) pulses were averaged together at each wavelength to reduce the noise. A custom-designed laser output monitor used a reflective window to extract a small percentage of the laser light for measurement with an integrating sphere and photodiode. This allowed compensation for the variation of the laser output with wavelength and number of pulses. The image at 810 nm was subtracted from the 745 image with an experimentally determined scaling factor (k) based on measurements of the photoacoustic contrast of the DMSO buffer and the plastic holder at each wave-length. For these experiments, k was fixed to a value of 1.4, at which nearly all of the extraneous signals were removed as verified by analysis of the weighted PCT difference image in the absence of labeled cells. In vivo measurements would require a different scaling factor to account for the presence of hemoglobin. The measured resolution of the system was about 0.18 mm, significantly lower resolution than the reconstruction voxel size of 0.05 mm. For this reason, adjacent slices of the reconstructed image were averaged together before making quantitative measurements. A region-of-interest (ROI) tool was used to select a region in the center of the tube of the subtracted XY-slice image (Figure 2) and record the average and standard deviation values. Sample optical densities measured before and after the photoacoustic experiments were found to be the same, indicating that no photobleaching had occurred during photoexcitation.
Figure 2.

Representative PCT images of the Herceptin-AF750 conjugate in solution
Instrumentation for Cell Measurements
Figure 3 shows the imaging tank for the PCT-LIN system. The linear transducer array was mounted below the bottom of the clear PVC sample holder and oriented vertically upward. The optical fiber was mounted to the top of the sample holder assembly to deliver the laser directly down through the sample. The fiber output was first collimated and reduced in intensity with a 12% ND filter before reaching the sample. Mylar film in front of the array protected it from the direct beam. The sample holder assembly was positioned so the tip of the holder was at the region of greatest sensitivity, approximately 2 cm from the array face, as shown in Figure 3. The tank was filled with water to a level just below the sample holder. Figure 4 shows a detail of the sample holder assembly. The clear PVC sample holder had a thickness of approximately 0.02 inches at the tip. It had a low optical absorption and gave a minimal photoacoustic signal in the NIR wavelengths. The diameter of the tip was less than 2 mm and the available sample volume was 100–150 μL. Figure 4(a) shows the exploded view of the assembly. The sample holder was suspended in the assembly so that no structural pieces were within the imaging field of view. The sample holder was conical and self-centering in the bottom aperture of the assembly. The cylindrical section was placed in the assembly after the sample holder and locked with a set screw to fix the holder in place.
Figure 3.

(a) Schematic diagram for PCT imaging of cells; (b) Instrument for PCT cell imaging
Figure 4.
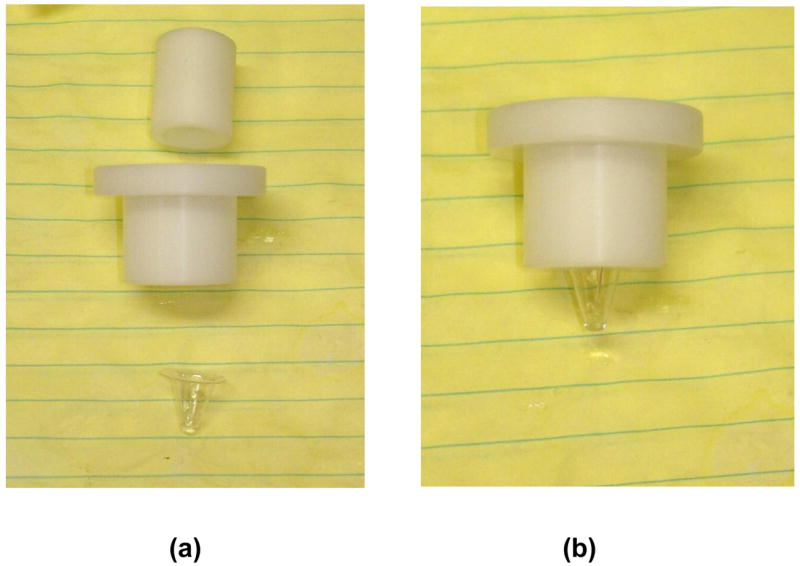
Sample holder assemblies for cell imaging
We investigated two different techniques to resolve the signal of interest from the competing signals from artifacts and background sources. The first was dual-wavelength subtraction as previously described. The second was blank subtraction, whereby the sample holder was emptied, filled with buffer, imaged again and the resultant image subtracted from the cell-filled image. In principle, the blank subtraction yielded a subtraction with somewhat higher signal, but it was sensitive to repositioning errors. In practice, we obtained the most robust results using the dual-wavelength technique.
Relative Quantum Yields (rQY)
Relative fluorescence quantum yields (rQY-fl) or fluorescence per fluorophore of each dye-antibody conjugate were determined in comparison to that of the corresponding free dye, which was assumed to be 1. Fluorescence emission spectra were obtained from the samples of matched absorbance at the excitation wavelength (710 nm), and the integrated signals were normalized to that of the free dye to calculate rQY-fl. Absorbance was measured with an independent laboratory UV-Vis spectrophotometer (Varian Cary 50, Palo Alto, CA). Fluorescence was measured with a Cary-Eclipse fluorimeter for AF750 conjugates.
In a similar way, the relative photoacoustic quantum yields (rQY-PA) or acoustic signal intensity per dye of each conjugate were determined by PASS in comparison to that of the corresponding free dye, which was assumed to be 1. Acoustic signals were obtained from the samples of matched absorbance at the excitation wavelength (745 nm for AF-750 conjugates) using photoacoustic instruments developed by OptoSonics Inc. Signals thus obtained were normalized to that of the free dye to calculate relative photoacoustic QY.
Fluorescence Measurement by Flow Cytometry
Fluorescence of the labeled HER2(+) cells was measured by flow cytometry. A direct comparison of fluorescence and photoacoustic signal could not be made using AF750-labeled Herceptin because the flow cytometer (FACS Calibur) could not operate at wavelengths exceeding 635 nm. For this reason, Herceptin was conjugated with AF647 dye in equivalent labeling conditions to those used for AF750. Approximately 0.5 × 10⁶ of breast cancer cells were incubated with ~50 μg probe (Herceptin-AF647) at 37ºC for 1.5 hr. After labeling, cells were washed out three times by PBS, then the labeled cells were suspended in ~500 μL of PBS for flow cytometry measurements. Three measurements were made at each DOL. Suspension of corresponding unlabeled cells was used as control.
Cell-binding Measurements by PCT
Both HER2 positive (MCF-7 and BT-474) and Her-2 negative (MCF-7-PC-DMA and MDA-MB-231) cell lines were utilized for binding of the dye-Herceptin conjugates following standard cell culture protocols. Cells were maintained at 37ºC and 5% CO2 in a humidified atmosphere. Approximately 0.5 × 10⁶ of breast cancer cells were incubated with ~50 μg probe (Herceptin-AF 750) at 37ºC for 1.5 hr. After labeling, cells were washed out three times by PBS, then the labeled cells were suspended in PBS. Cells were counted in a Beckman Coulter cell counting machine before transferring to the sample holder. Finally, the cells were pelleted to the bottom of the sample holder by centrifugation.
For the AF-750-Herceptin-labeled cells, a 0.1 M solution of sodium bicarbonate in 25% DMSO was used. The labeled cells were transferred to the PCT sample holder so that the entire population could be contained in 100 μL of appropriate buffer. The sample was then centrifuged at 4000 rpm for 10 minutes. The cells formed a small layer at the tip of the holder. The sample holder was carefully placed in the assembly using the provided tool and one side of the holder was marked to designate this orientation as 6 o’clock. The cylinder was inserted and locked in place. It was then placed in the imaging tank and rotated to align the index marks.
Images were acquired for the sample at 745 and 810 nm with 32 laser pulses per image. Then the 810 nm image was subtracted from the 745 nm image with an experimentally determined scaling factor (k) based on the varying absorption of the DMSO buffer (about 1.2 for PVC in 25% DMSO buffer). Nearly all of the extraneous signals were removed. The holder assembly was removed carefully by loosening the screw and rotating the sample holder by 90° (3 o’clock) and two more images were obtained and subtracted as before. The same procedure was followed for the orientations at 180° (12 o’clock) and 270º (9 o’clock) from the initial position. We found no significant evidence of photobleaching of the sample for these 4 orientations. The ROI tool was used to take a small, thin ROI at the tip of the holder that corresponded to the layer of cells and the maximum value of photoacoustic intensities were measured. All four measurements from the different orientations were averaged together.
RESULTS AND DISCUSSION
After reactions of AF-750 or AF-647 with Herceptin, the products were isolated by gel filtration to a purity ≥98%. Increasing the dye to Herceptin molar ratio in the conjugation reaction over the range of 2–21:1 resulted in increasing actual dye to antibody ratios, or degree of labeling (DOL), of 1-13:1 (Figure 5). A representative UV-Vis spectrum of Herceptin-dye conjugate is shown in Figure 6.
Figure 5.

The dye (AF750) to protein (Herceptin) molar labeling ratio was measured at various dyes to protein molar mixing ratios
Figure 6.

Representative uv-vis spectrum of Herceptin-AF750 conjugate (DOL 7) in 0.1 M bicarbonate buffer.
In solution imaging of the probe, 25% DMSO in bicarbonate buffer was used to minimize the micro-bubble formation. Dye absorption maxima were at 745 nm, so the image obtained at this wave-length was due to dye and background (sample holder, micro-bubbles etc.). At 810 nm, dye absorption was negligible; images obtained at this wavelength were indicative of the background. Corrected images of dye absorption were obtained by subtracting 810 nm image from the corresponding 745 nm images. For both solution and cell-binding measurements the lambda subtraction technique worked effectively to eliminate background variation including micro-bubbles from the image.
In cell-binding measurements, cells were packed to form a thin layer at the bottom of the sample holder by centrifuging using a hanging bucket rotor. Loose packing produced low quality images. The sample holder could accommodate up to 0.3 million cells at the bottom to form a uniform layer. If the number exceeded 0.3 million, the layer became thicker and the acoustic signal did not scale with the number of cells.
rQY-fl vs. rQY-PA of AF750-Herceptin Conjugates
As the DOL increased, the fluorescence of any single fluorophore decreased when compared with free AF750 in solution. Comparative measurement between free Alexa Fluor dye molecules and Herceptin-Alexa Fluor conjugates in solution showed that with increasing DOL from 1 to 13, fluorescence intensity per dye (rQY-fl) gradually decreased (up to ~70%). Measurement of corresponding photoacoustic signal intensity (rQY-PA) per dye produced meaningful results. Though the data showed considerable noise, we observed that rQY-PA was gradually increased (up to ~25%) with increase in DOL (Figure 7). It is suggested that increased heat generated due to fluorescence quenching is the source of increased photoacoustic signal intensity per dye molecule.
Figure 7.

Per dye photoacoustic and per dye fluorescence signal intensity comparison with increase in DOL of Herceptin-AF750 conjugates
Receptor specificity of the probe by PCT
HER2 positive (BT-474 and MCF-7) and HER2 negative (MCF-7-PC-DMA and MDA-MB-231) cell lines were incubated with Herceptin-dye conjugates (DOL 5). Approximately 0.2 × 10⁶ of cells of each cell line was used for cell imaging by PCT. In addition, blank samples, for which cells were not exposed to the probe were imaged.
Figure 8 shows representative images of blank and labeled cell lines. Only HER2 positive cell lines gave high intensity acoustic images. Signal intensity of HER2 negative cell lines was similar to corresponding unlabeled cells
Figure 8.
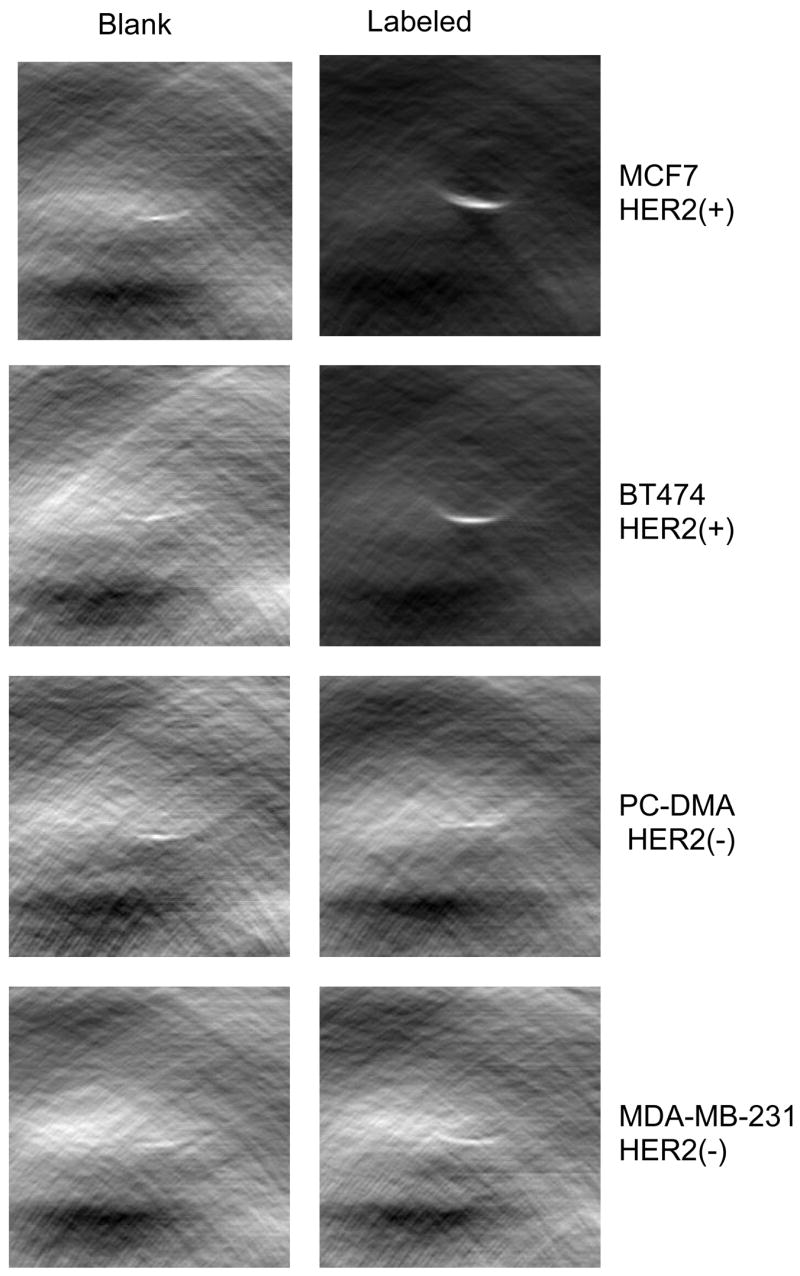
PCT images of HER2 positive and HER2 negative cell lines
In a blocking experiment HER2 positive (BT-474 and MCF-7) cells were at first incubated with unlabeled Herceptin for 1 hr. at 37 °C, then equal amount of Herceptin-dye conjugate (DOL 5) was added and incubated again for another 1.5 hr.
PCT image intensities (Fig 9) showed that unlabeled Herceptin blocked >95% of the Herceptin-dye conjugate binding to the HER2 positive cells, demonstrating the specificity of labeled Herceptin binding to HER2.
Figure 9.
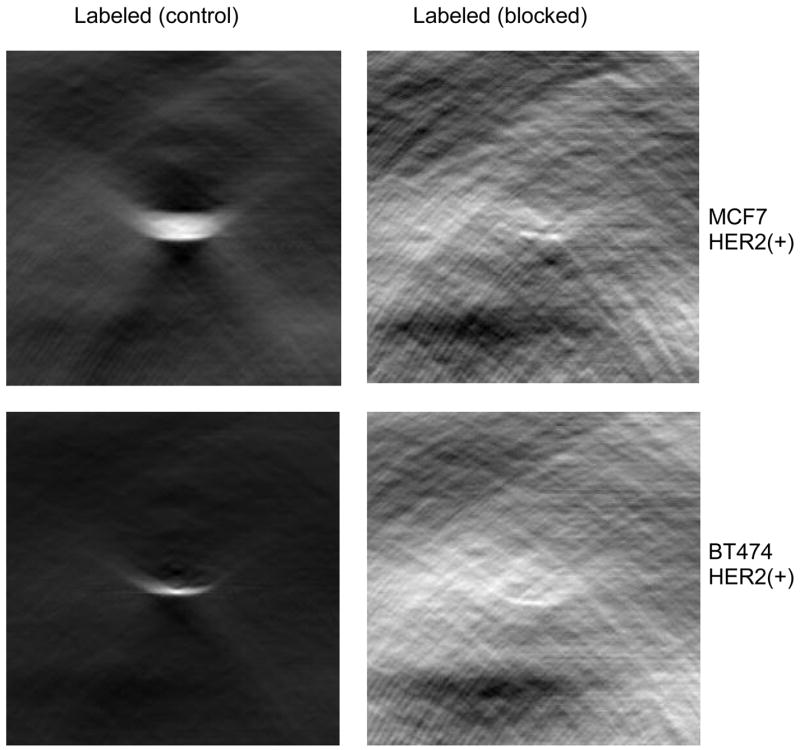
PCT images of unblocked and blocked HER2 (+) cells
PCT imaging of HER2 positive cells
In order to evaluate NIR-dye labeled Herceptin as a PCT probe, HER2 positive cell lines were incubated with Herceptin-dye conjugates having different DOL, followed by PCT imaging. Equal numbers of cells (0.2 × 10⁶) were used to determine the variation of acoustic signal intensity with increase in DOL of the probe. In Figure 10, cell imaging of MCF7 cells are shown. After subtraction of the PCT intensity corresponding to a sample with no probe (blank), signal intensity increased with increasing DOL (Fig. 11). In contrast to this finding fluorescence signal intensity from cells generally decreases for DOL greater than 3 (21–23). There was a slight upward exponential trend of the intensity vs. DOL plots (Fig. 11), indicating the tendency toward increase in photoacoustic signal intensity per dye (Fig. 7) as DOL is increased. The results also indicate that cell uptake of the probe does not appear to suffer from saturation effects at the HER2 receptors.
Figure 10.

Representative PCT images of MCF7 HER2 positive cell lines at different DOL at constant no. of cells (0.2 × 10⁶)
Figure 11.

DOL vs. peak photoacoustic signal intensity (arb. unit) of PCT images obtained by using ROI tool. Plot (a) is for MCF7 and plot (b) is for BT474 cell lines labeled with Herceptin-AF750 conjugates.
Acoustic signal intensity was also varied with number of cells per sample while keeping DOL constant. The acoustic signal gradually increased with the number of cells up to of 0.3 million (Fig. 12). Because of the narrow sample holder tip, when the number of cells exceeded 0.3 million, the cell layer became substantially thicker. The resultant signal plateaued because the layer was no longer contained within a thickness equivalent to the spatial resolution of the PCT system, i.e. 0.2 mm. This was verified by analyzing the apparent thickness of the PCT image of the cells. Experiments in the two HER2 positive cell lines yielded similar results.
Figure 12.

Change of PCT signal intensity with no. of cells at constant DOL: plot (a) BT474 HER2(+), DOL 6 and plot (b) MCF7 HER2(+), DOL 4.5
The uncertainties of the PCT signals shown in Figures 11 and 12 were derived from 4 measurements made at different orientations for each sample. The signal was clearly dependent on the orientation the holder. For example, orientations at 6 and 12 o’clock gave similar PCT signal values, as did 3 and 9 o’clock orientations, but the two groups were distinct. The dependence on orientation was a function of the position relative to the linear array. For larger number of cells in the tube (Figure 12), the distinction of PCT signal between two groups became larger because the cells were less uniformly deposited on the bottom. We could typically see the layer creeping up one side of the tube as the number of cells increased. Our solution to this problem was to measure at 4 orientations and take average the measurements.
Fluorescence and PCT signal vs. DOL of HER2(+) cells
In order to compare PCT signal with fluorescence signal of the cells labeled by Herceptin-dye conjugates we performed flow cytometry experiment to determine the fluorescence intensity per labeled cell. Because the flow cytometer (FACS Calibur) could not excite beyond 635 nm, AF647 was substituted for AF750 as labeling dye. AF647 and AF750 are almost equivalent in terms of their molecular wt. and molar extinction coefficient. The flow cytometry data (Fig. 13) for both cell lines indicated that fluorescence signal intensity reached a plateau higher DOL values, whereas PCT signal intensity (Fig. 11) increased with DOL over the entire DOL range.
Figure 13.

Fluorescence vs. DOL of HER(+) cells labeled with Herceptin- AF647 conjugates obtained by flow cytometry.
CONCLUSION
From this in-vitro study, we have successfully demonstrated potential for NIR-dye labeled Herceptin to be used as a PCT probe for breast cancer. A large PCT signal with respect to control (cells with no probe) was obtained by labeling Herceptin with several dye molecules per molecule of protein. Unlike fluorescence, the photoacoustic signal gradually increased with increasing DOL of the dye. Moreover, it was shown that cellular binding to HER2 positive cell lines was maintained with increase in DOL of the dye over the range of 2 to 13. In vivo and in vitro studies with different low-fluorescence QY dyes are underway. It is believed that this labeling and detection scheme will be applicable to a broad class of biomolecules.
Before this technique can be translated to clinical applications, we will have to deal with two issues: obtaining sufficient SNR at depths of 2 – 3 cm in the breast, and accounting for hemodynamic variation within tumors. Phantom experiments suggest that we can detect dye concentrations in the 50 – 100 nM range at a depth of 30 mm. The confounding issues of hemodynamic variability can be mitigated to a large degree by choosing a differential pair of wavelengths that are 20 – 40 nm apart and straddle the falling edge of the dye absorption curve. In this case, the differential dye signal is maximized, while the differential hemoglobin signal is minimized. Work is ongoing to quantify these properties in greater detail.
Acknowledgments
Authors are thankful to Dr. Kathy D. Miller for providing breast cancer cell lines. This work is supported by National Institutes of Health: R01-CA108620 and R44-CA114839
References
- 1.Kiser WL, Jr, Reinecke D, DeGrado T, Bhattacharyya S, Kruger RA. Photoacoustic Molecular Imaging. Proc SPIE. 2007;6437:21–27. [Google Scholar]
- 2.Bhattacharyya S, Wang S, Reinecke D, Kiser WL, Jr, Kruger RA, DeGrado TR. Evaluation of NIR-Dye Labeled Herceptin as a Thermoacoustic Computed Tomography (TCT) Probe for HER-2 Expression in Breast Cancer. AMI/SMI Meeting Providence (Abstract) 2007 [Google Scholar]
- 3.Kaufmann BA, Lindner JR. Molecular Imaging with Targeted Contrast Ultrasound. Curr Opin Biotechnol. 2007;18:11–16. doi: 10.1016/j.copbio.2007.01.004. [DOI] [PubMed] [Google Scholar]
- 4.Song KH, Stoica G, Wang LHV. In-vivo Three Dimensional Photoacoustic Imaging of Blood Vessels in Tissue. Opt Lett. 2006;23:648–650. doi: 10.1364/ol.23.000648. [DOI] [PubMed] [Google Scholar]
- 5.Klibanov AL. Ligand-Carrying Gas-Filled Microbubbles: Ultrasound Contrast Agents for Targeted Molecular Imaging. Bioconjugate Chemistry. 2005;16:9–17. doi: 10.1021/bc049898y. [DOI] [PubMed] [Google Scholar]
- 6.Bloch SH, Dayton PA, Ferrara KW. Targeted Imaging Using Ultrasound Contrast Agents. Progress and Opportunities for Clinical and Research Applications. IEEE Eng Med Biol Mag. 2004;23:18–29. doi: 10.1109/memb.2004.1360405. [DOI] [PubMed] [Google Scholar]
- 7.Oraesky A, Karabutov A, Solomatin VS, Savateeva EV, Andreev VG, Gatalica Z, Singh H, Fleming RYD. Laser Optoacoustic Imaging of Breast Cancer In vivo. Proc SPIE. 2001;4256:12–22. [Google Scholar]
- 8.Kruger RA, Kiser WL, Jr, Reinecke DR, Kruger GA, Eisenhart RL. Thermoacoustic Computed Tomography of the Breast at 434 MHz. Proc IEEE, MTT-S. 1999:591–594. [Google Scholar]
- 9.Xu Y, Wang LH. Rhesus Monkey Brain Imaging Through Intact Skull with Thermoacoustic Tomography. IEEE Transactions on Ultrasonics Ferroelectrics and Frequency Control. 2006;53(3):542–548. doi: 10.1109/tuffc.2006.1610562. [DOI] [PubMed] [Google Scholar]
- 10.Wang X, Xie X, Ku G, Stoica G, Wang LH. Non Invasive Imaging of Hemoglobin Concentration and Oxygenation in the Rat Brain Using High-resolution Photoacoustic Tomography. Journal of Biomedical Optics. 2006;11(2):024015. doi: 10.1117/1.2192804. [DOI] [PubMed] [Google Scholar]
- 11.Wang SC, Zhang L, Hortobagyi GN, Hung MC. Targeting Her-2: Recent Developments and Future Directions for Breast Cancer Patients. Seminars in Oncology. 2001 December;28(6 Suppl 18):21–29. doi: 10.1053/sonc.2001.29724. [DOI] [PubMed] [Google Scholar]
- 12.Hynes NE, Stern DF. The Biology of erB-2/neu/Her-2 and it’s Role in Cancer. Biochimica et Biophysica Acta. 1994;1198:165–184. doi: 10.1016/0304-419x(94)90012-4. [DOI] [PubMed] [Google Scholar]
- 13.Slamon DJ, Clark GM, Wong SG, Levin WJ, Ullrich A, McGuire WL. Human Breast Cancer: Correlation of Relapse and Survival with Amplification of Her2/neu Oncogene. Science. 1987;235:177–182. doi: 10.1126/science.3798106. [DOI] [PubMed] [Google Scholar]
- 14.Venter DJ, Tuzi NL, Kumar S, Gullick WJ. Overexpression of the c-erbB-2 Oncoprotein in Human Breast carcinomas; Immunohistological Assessment Correlates with Gene Amplification. Lancet. 1987;2:69–72. doi: 10.1016/s0140-6736(87)92736-x. [DOI] [PubMed] [Google Scholar]
- 15.Yarden Y. Biology of Her2 and It’s Importance in Breast Cancer. Oncology. 2001;61(suppl 2):1–13. doi: 10.1159/000055396. [DOI] [PubMed] [Google Scholar]
- 16.Nelson NJ. Experts Debate value of Her2 Testing Methods. Journal of the National Cancer Institute. 2000 Feb. 16;92(4) doi: 10.1093/jnci/92.4.292. [DOI] [PubMed] [Google Scholar]
- 17.Van de Vijver M. Emerging Technologies for Her2 Testing. Oncology. 2002;63(suppl 1):33–38. doi: 10.1159/000066199. [DOI] [PubMed] [Google Scholar]
- 18.Kohen E, Santus R, Hirschberg JG. Fluorescence Probes in Oncology. Chapter 2 London: Imperial College Press; 2002. [Google Scholar]
- 19.Kurian E, Prendergast FG, Small JR. Photoacoustic Analysis of Proteins: Volumetric Signals and Fluorescence Quantum Yields. Biophysical Journal. 1997;73:466–476. doi: 10.1016/S0006-3495(97)78085-8. [DOI] [PMC free article] [PubMed] [Google Scholar]
- 20.Licha K, Riefke B, Ebert B, Grontzinger C. Cyanine Dyes as Contrast Agents in Biomedical Optical Imaging. Acta Radio. 2002;9(suppl 2):S320–S322. doi: 10.1016/s1076-6332(03)80216-7. [DOI] [PubMed] [Google Scholar]
- 21.Steinberg TH, Nyhus JK, Aggeler B, Leong L, Greenfield L. Functional Labeling of in vivo Imaging Optical Probes. Poster presentation at Society of Molecular Imaging annual meeting; Hawaii. 2006. [Google Scholar]
- 22.Berlier JE, Rothe A, Buller G, Bradford J, Gray DR, Filanoski BJ, Telford WG, Yue S, Liu J, Cheung CY, Chang W, Hirsch JD, Beechem JM, Haugland RP, Haugland RP. Quantitative Comparison of Long-Wavelength Alexa Fluor Dyes to Cy Dyes: Fluorescence of the Dyes and Their Bioconjugates. The Journal of Histochemistry and Cytochemistry. 2003;51(12):1699–1712. doi: 10.1177/002215540305101214. [DOI] [PubMed] [Google Scholar]
- 23.Ohnishi S, Lomnes SJ, Laurance RG, Gogbashian A, Mariani G, Frangioni JV. Organic Alternative to Quantum Dots for Intraoperative Near-Infrared Fluorescent Sentinel Lymph Node Mapping. Molecular Imaging. 2005;4(3):172–181. doi: 10.1162/15353500200505127. [DOI] [PubMed] [Google Scholar]