

Abstract
BACKGROUND
In men with prostate cancer, gonadotropin-releasing hormone (GnRH) agonists increase fat mass, decrease insulin sensitivity, and increase triglycerides, features that are shared with metabolic syndrome. To the authors’ knowledge, however, less is known regarding the effects of GnRH agonists on other attributes of the metabolic syndrome.
METHODS
In an open-label prospective study, 26 men with recurrent or locally advanced prostate cancer were treated with leuprolide for 12 months. Outcomes included changes in blood pressure, body composition, lipids, adipocytokines, and C-reactive protein.
RESULTS
The mean weight, body mass index, and waist circumference increased significantly from baseline to Month 12 (P < .001 for each comparison). Fat mass increased by 11.2% ± 1.5% (P < .001) and the percentage lean body mass decreased by 3.6% ± 0.5% (P < .001). The total abdominal fat area increased by 16.5% ± 2.6% (P < .001), with the accumulation of subcutaneous fat accounting for 94% of the observed increase. The waist-to-hip ratio and blood pressure did not change significantly. Serum high-density lipoprotein (HDL) cholesterol concentrations increased significantly (P = .002). Serum adiponectin levels increased by 36.4 ± 5.9% from baseline to Month 3 and remained significantly elevated through Month 12 (P < .001). Resistin and C-reactive protein levels did not change significantly.
CONCLUSIONS
The term metabolic syndrome does not appear to adequately describe the effects of GnRH agonists in men with prostate cancer. In contrast to the metabolic syndrome, GnRH agonists increase subcutaneous fat mass, HDL cholesterol, and adiponectin, and do not alter the waist-to-hip ratio, blood pressure, or C-reactive protein level.
Keywords: prostate cancer, metabolic syndrome, gonadotropin-releasing hormone, metabolic changes
In men with prostate cancer, gonadotropin-releasing hormone (GnRH) agonists are associated with a greater risk of incident diabetes, coronary heart disease, and hospital admission for myocardial infarction.1 Several mechanisms may contribute to the greater risk for diabetes and cardiovascular disease during GnRH agonist therapy. GnRH agonists increase fat mass and decrease lean body mass.2–4 GnRH agonists increase fasting plasma insulin levels5,6 and decrease insulin sensitivity.7 GnRH agonists also increase serum levels of cholesterol and triglycerides.3,6,8
The term ‘metabolic syndrome’ refers to a clustering of specific cardiovascular disease risk factors whose pathophysiology appears related to insulin resistance.9,10 The National Cholesterol Education Program’s Adult Treatment Panel (ATP III) and World Health Organization (WHO) have defined the metabolic syndrome using distinct but related criteria (Table 1).11,12 Other organizations have presented similar but not identical definitions. A recent cross-sectional study reported a higher prevalence of the metabolic syndrome (as defined by the National Cholesterol Education Program’s ATP III) in 18 men receiving a GnRH agonist compared with age-matched control groups of untreated men with prostate cancer and men without prostate cancer.13 Although prospective studies have consistently demonstrated that GnRH agonists increase fat mass, decrease insulin sensitivity, and increase triglycerides, to our knowledge less is known regarding the effects of GnRH agonists on other components of the metabolic syndrome including waist circumference, waist-to-hip ratio, and blood pressure. Similarly, little is known concerning the effects of GnRH agonists on other features of the metabolic syndrome including characteristic alterations in fat distribution, adipocytokines, and markers of inflammation.
TABLE 1.
Definitions of Metabolic Syndrome for Men
ATP III definition (≥3 of the following)
|
| WHO definition
Diabetes, IFG, IGT, or insulin resistance (assessed by clamp studies) and at least 2 of the following criteria:
|
ATP III indicates the National Cholesterol Education Program’s Adult Treatment Panel; HDL, high-density lipoprotein; WHO, World Health Organization; IFG, impaired fasting glucose; IGT, impaired glucose tolerance.
To better characterize the metabolic effects of GnRH agonists in men with prostate cancer, we prospectively evaluated changes in body composition, cross-sectional fat areas, and blood pressure during androgen deprivation therapy with a GnRH agonist. We also prospectively evaluated changes in lipids, adipocytokines, and C-reactive protein. Our results suggest that the term metabolic syndrome neither adequately or accurately describes the metabolic effects of GnRH agonist in men with prostate cancer.
MATERIALS AND METHODS
Subjects
Subjects in these analyses were participants in a previously reported randomized controlled trial to compare the effects of leuprolide monotherapy with bicalutamide monotherapy on bone mineral density and body composition in men with recurrent or locally advanced prostate cancer.14 We restricted the current analyses to the 26 subjects assigned to leuprolide monotherapy because the intention of this evaluation was to evaluate the metabolic effects of standard androgen deprivation therapy with a GnRH agonist. Except for changes in weight and percentage fat mass from baseline to Month 12, none of these prospective results has been reported previously.
Subjects with locally advanced or recurrent prostate cancer were recruited between May 2000 and May 2002. Men with bone metastases detected by radionuclide bone scan were excluded. Men with a Karnofsky performance status < 90, a history of hypogonadism, a history of growth hormone or anabolic steroid use, Paget disease, hyperthyroidism, Cushing disease, hyperprolactinemia, chronic liver disease, corrected serum calcium < 8.4 mg/dL or > 10.6 mg/dL, or serum creatinine concentration > 2.0 mg/dL (177 μmol/L) were also excluded. Men with prior neoadjuvant or adjuvant hormone therapy were included if the interval between completion of treatment and study entry was > 1 year. Men were excluded if they had received bisphosphonate, calcitonin, or glucocorticoid therapy, or suppressive doses of thyroxine within 1 year.
Study Design
After the baseline visit, all 26 subjects received leuprolide 3-month depot (Lupron Depot; TAP Pharmaceuticals, Deerfield, Ill) (at a dose of 22.5 mg intramuscularly every 3 months) for 12 months. Subjects also received bicalutamide (Casodex; AstraZeneca, London, UK) (50 mg by mouth daily) for 1 month to prevent the potential disease flare associated with the initial leuprolide administration. All subjects received calcium carbonate (500 mg daily), and a daily multivitamin containing 400 IU of vitamin D.
Subjects were evaluated at the Mallinckrodt General Clinical Research Center at Massachusetts General Hospital at baseline, 3 months, 6 months, 9 months, and 12 months. A serum sample was obtained at each visit and stored at −80°C. Body composition was measured by dual energy X-ray absorptiometry at baseline, 6 months, and 12 months. Cross-sectional areas of the abdomen were measured by quantitative computed tomography at baseline and at 12 months. The Institutional Review Board of the Harvard Cancer Center approved the study. All subjects provided written informed consent. The study sponsors played no role in the study design;, in the collection, analysis, and interpretation of the data; or in writing of this report.
Outcomes
A research bionutritionist performed anthropomorphic measurements. Fasting subjects were weighed wearing a hospital gown and no shoes. Body weight was measured to the nearest 0.1 kg using a digital platform scale (Blue Bell BioMedical Model 500; SR Instruments, Tonawanda, NY). Height was measured to the nearest 0.1 cm using a wall-mounted stadiometer. Waist and hip circumference were also measured to the nearest 0.1 cm.
Lean mass and fat mass were determined by dual energy X-ray absorptiometry with a Hologic QDR 4500A densitometer (Hologic, Waltham, Mass; software version 11.2).
Cross-sectional areas of the abdomen, abdominal subcutaneous fat, and intra-abdominal fat at the level of the L4 vertebra were determined by quantitative computed tomography (GE Model I scanner; General Electric Medical Systems, Milwaukee, Wis) as described previously.3 Briefly, the total abdominal area was determined from an outline of the torso using image analysis software (General Electric Advantage Windows Workstation, version 2.0). Two contours were identified: the body perimeter and deep fascia that delineates the back and abdominal wall musculature. The abdominal subcutaneous fat area was defined as the area between the 2 contours. Intra-abdominal fat was defined as the area within the inner contour comprising all pixels with attenuation coefficients between −50 and −250 Hounsfield U.
Plasma adiponectin was measured using a quantitative sandwich enzyme immunoassay with a sensitivity of 0.246 ng/mL and intraassay and interassay coefficients of variation of 2.5% to 4.7% and 5.8% to 6.9%, respectively (R&D Systems, Minneapolis, Minn). Resistin was measured using a quantitative sandwich enzyme immunoassay with a sensitivity of 0.026 ng/mL and intraassay and interassay coefficients of variation of 3.8% to 5.3% and 7.8% to 9.2%, respectively (R&D Systems). Serum cholesterol, low-density lipoprotein (LDL) cholesterol, high-density lipoprotein (HDL) cholesterol, and trigylceride concentrations were measured by colorimetric enzymatic assays on an automated clinical chemistry analyzer with intra-assay and interassay coefficients of variation of 0.8% to 1.5% and 1.7% to 2.6%, respectively (Roche Diagnostics/Boehringer Mannheim, Indianapolis, Ind). C-reactive protein was measured by ultra-sensitive immunoassay (Roche Diagnostics/Equal Diagnostics, Exton, Pa).
Statistical Analyses
Changes in serum concentrations of lipids, adipocytokines, and C-reactive protein were evaluated using repeated measures analysis of covariance.15 Longitudinal changes between baseline and 12-month values for the other outcome measures were examined using a 2-sided Student t test for paired data. Statistical analyses were performed using SAS statistical software (version 8.1; SAS Institute, Cary, NC). Baseline values were reported as the mean ± standard deviation. Changes in outcomes were reported as the mean ± standard error. All P values were 2-sided and values < .05 were considered statistically significant.
RESULTS
Baseline Characteristics
Twenty-six men completed the baseline evaluation and initiated treatment with leuprolide. Table 2 summarizes the baseline characteristics of the subjects. All 26 subjects completed the study. All subjects are included in these analyses, including 2 subjects who discontinued leuprolide after 6 months because of adverse effects. One subject had diabetes at study entry; no subject was diagnosed with diabetes during the study.
TABLE 2.
Baseline Characteristics
| Characteristic | Value* | Normal range |
|---|---|---|
| Age, y | 65 ± 10 | |
| Race, % | ||
| Non-Hispanic white | 84 | |
| Non-Hispanic black | 8 | |
| Hispanic | 4 | |
| Asian | 4 | |
| Prevalent diabetes (%) | 4 | |
| BMI, kg/m2 | 27.1 ± 3.4 | |
| Blood pressure, mmHg | ||
| Systolic | 138 ± 4 | |
| Diastolic | 78 ± 2 | |
| Fat mass, % | 25.1 ± 4.8 | |
| Total cholesterol, mg/dL† | 208 ± 46 | |
| HDL cholesterol, mg/dL† | 45 ± 10 | |
| LDL cholesterol, mg/dL† | 120 ± 36 | |
| Triglycerides, mg/dL‡ | 164 ± 79 | |
| Adiponectin, ng/mL | 7.0 ± 3.4 | |
| Resistin, ng/mL | 12.2 ± 8.5 | |
| C-reactive protein, mg/L | 1.9 ± 1.8 | |
| Testosterone, ng/dL§ | 372 ± 128 | 270–1070 |
| Estradiol, pg/mL|| | 22 ± 9 | 10–50 |
BMI indicates body mass index; HDL, high-density lipoprotein; LDL, low-density lipoprotein.
Values are shown as the mean ± standard deviation.
To convert cholesterol from mg/dL to mmol/L, multiply by 0.0259.
To convert triglycerides from mg/dL to mmol/L, multiply by 0.0113.
To convert testosterone from ng/dL to nmol/L, multiply by 0.0347.
To convert estradiol from pg/mL to pmol/L, multiply by 3.671.
Body Composition
At baseline, the mean weight of the patients was 83.3 ± 2.1 kg and the mean body mass index (BMI) was 27.1 ± 0.7 kg/m2. Seventeen men (69%) were categorized as overweight (BMI of 25.0–29.9 kg/m2) or obese (BMI of ≥30 kg/m2). Weight and BMI increased by 3.1% ± 0.9% from baseline to Month 12 (P = .003 for each comparison) (Fig. 1A). Approximately two-thirds (66%) of the observed weight gain was apparent at 6 months.
FIGURE 1.
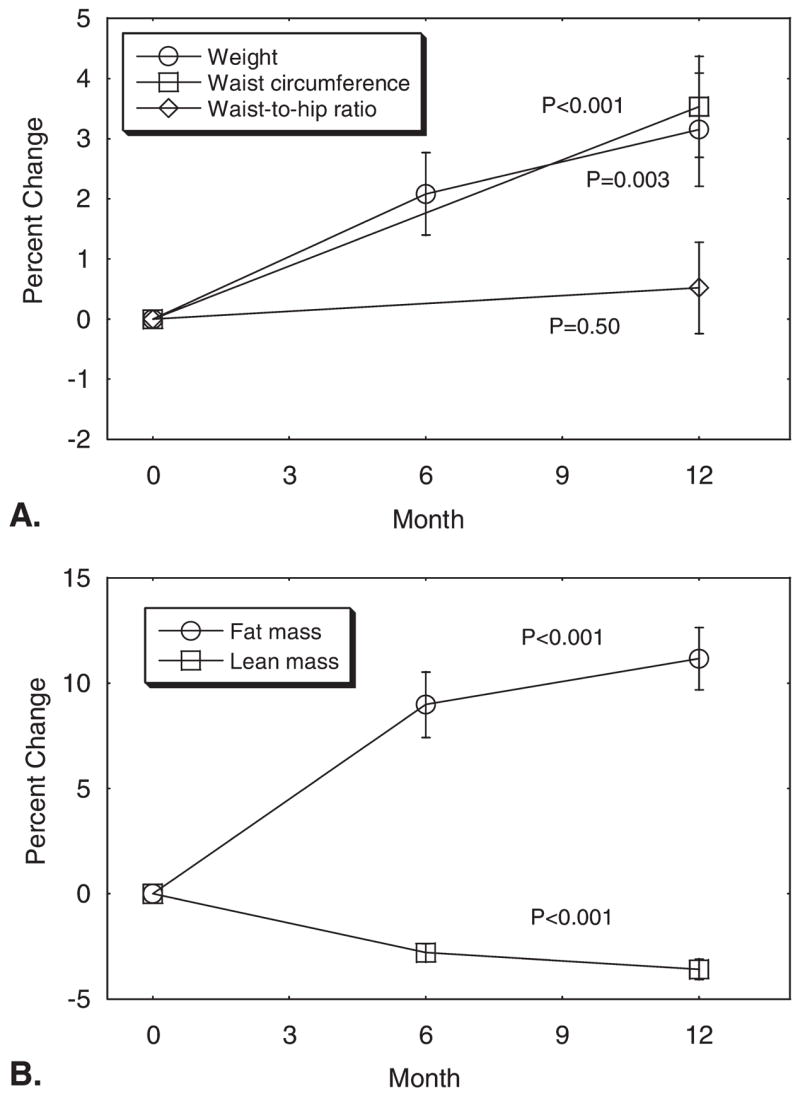
(A) Mean (± standard error) changes in weight, waist circumference, and waist-to-hip ratio and (B) lean body mass and fat mass during leuprolide therapy for prostate cancer. P values were for comparison of Month 12 with baseline.
At baseline, the mean waist circumference was 99.5 ± 1.9 cm, the mean hip circumference was 104.4 ± 1.3 cm, and the mean waist-to-hip ratio was 0.95 ± 0.01. Eight men (31%) had a waist circumference > 100 cm and 21 men (84%) had a waist-to-hip ratio > 0.90. From baseline to Month 12, the mean waist circumference and hip circumferences increased by 3.5% ± 0.8% (P < .001) and 2.9% ± 0.8% (P = .001), respectively (Fig. 1B). The mean waist-to-hip ratio did not change significantly (P = .50).
From baseline to Month 12, the percentage fat mass increased by 11.2% ± 1.5% (P < .001) and the percentage lean body mass decreased by 3.6 ± 0.5% (P < .001) (Fig. 1C). Approximately 80% of the observed changes in the fat and lean mass were evident at 6 months.
Cross-sectional area of the abdomen as assessed by computed tomography scan increased by 7.9% ± 1.5% from baseline to Month 12 (P < .001) (Table 2). The total abdominal fat area increased by 16.5 ± 2.6% (P <. 001); accumulation of subcutaneous fat accounted for 94% of the observed increase in abdominal fat area.
Blood Pressure
The mean systolic and diastolic blood pressures at baseline were 138 ± 4 mm Hg and 78 ± 2 mm Hg, respectively. At Month 12, the mean systolic and diastolic blood pressures were 134 ± 4 mm Hg and 77 ± 2 mm Hg (P > .05 for each comparison with baseline).
Lipids
At baseline, the mean fasting serum levels of HDL cholesterol and triglycerides were 45 ± 10 mg/dL (1.2 ± 0.3 mmol/L) and 213 ± 181 mg/dL (2.4 ± 2.0 mmol/L), respectively. Nine men (35%) had serum HDL cholesterol levels < 1.0 mmol/L and 13 men (50%) had serum triglycerides ≥1.7 mmol/L at baseline. Serum HDL cholesterol (P = .002) and LDL cholesterol (P = .03) increased significantly. HDL cholesterol increased by 9.7% ± 3.6% from baseline to Month 3 and remained elevated above baseline throughout the study. Triglyceride concentrations increased 19.4% ± 9.7% from baseline to Month 12 (P = .39) (Fig. 2A).
FIGURE 2.
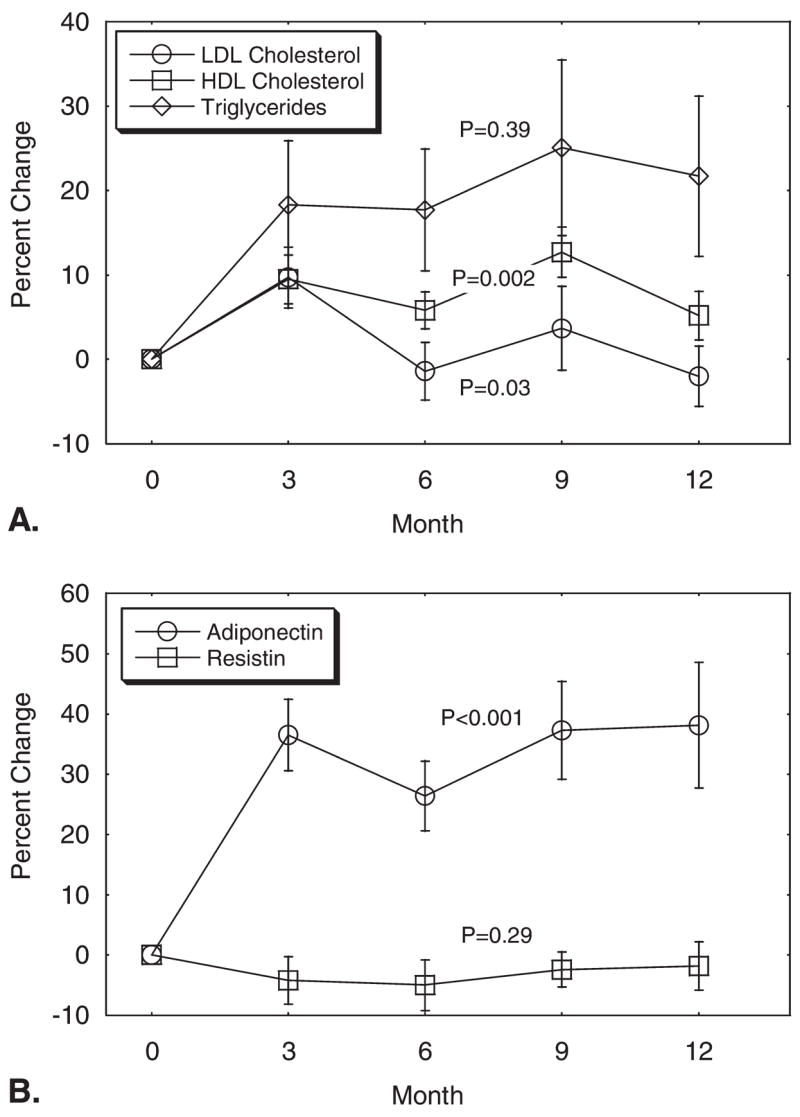
(A) Mean (± standard error) changes in lipids and (B) adipocytokines during leuprolide therapy for prostate cancer. P values were derived from repeated-measures analysis of covariance. LDL indicates low-density lipoprotein; HDL, high-density lipoprotein.
Adiopocytokines and C-reactive Protein
Serum adiponectin levels increased significantly (P < .001); adiponectin levels increased by 36.4% ± 5.9% from baseline to Month 3 and then remained elevated through Month 12 (Fig. 2B). In contrast, serum resistin levels did not change significantly (P = .29) (Fig. 2B). Serum C-reactive protein levels also did not change significantly (P = 0.75) (Fig. 3).
FIGURE 3.
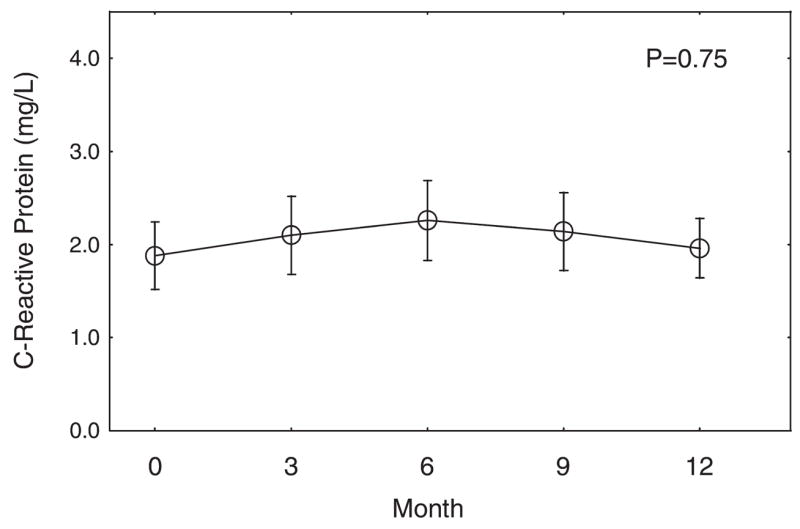
Mean (± standard error) changes in C-reactive protein during leuprolide therapy for prostate cancer. The P value was derived from repeated-measures analysis of covariance.
DISCUSSION
In this prospective study of men with locally advanced or recurrent prostate cancer, androgen deprivation therapy with leuprolide increased waist circumference and tended to increase serum triglycerides, changes that are consistent with components of the ATP III and/or WHO definitions of the metabolic syndrome. In contrast to the metabolic syndrome, however, leuprolide significantly increased HDL cholesterol and did not significantly alter the waist-to-hip ratio or blood pressure. Taken together, these results suggest GnRH agonists result in a pattern of metabolic alterations that are distinct from the metabolic syndrome.
Several other observations from the current study also appear to distinguish the metabolic phenotype of GnRH agonist-treated men from the classic metabolic syndrome. First, leuprolide preferentially increased subcutaneous fat mass in our subjects, whereas the visceral fat accumulation is more closely associated with the metabolic syndrome.16 Second, leuprolide was found to significantly increase adiponectin levels but cross-sectional studies have reported that low adiponectin levels are associated with features of the metabolic syndrome.17 Third, leuprolide did not significantly alter C-reactive protein levels, whereas the metabolic syndrome is associated with elevation of C-reactive protein and other markers of inflammation.18
Other prospective studies have reported that GnRH agonists significantly increase fat mass2–4 and increase fasting plasma insulin,5,6 a marker of insulin resistance, in men with prostate cancer. Another prospective study of nondiabetic men with prostate cancer demonstrated that short-term treatment with a GnRH agonist significantly decreased insulin sensitivity and increased glycated hemoglobin.7 Consistent with these results, a large population-based study demonstrated that GnRH agonists are associated with a greater risk of incident diabetes in men with prostate cancer.1 Thus, although GnRH agonists are associated with obesity and insulin resistance, central components of the metabolic syndrome, the composite definition(s) of the metabolic syndrome do not appear to effectively characterize the metabolic phenotype of men treated with a GnRH agonist. The current study did not include testing for diabetes and/or insulin sensitivity, although such additional information would not alter our conclusions regarding the other features of the metabolic syndrome.
The observation that GnRH agonist treatment increases adiponectin levels is in agreement with a previous study of younger men without prostate cancer. In a prospective study of 28 healthy men ages 18 to 35 years, treatment with a GnRH agonist increased serum adiponectin levels by 49% after 21 days.19 In cross-sectional studies, low adiponectin levels have been found to be associated with features of the metabolic syndrome, including obesity, hypertension, low HDL cholesterol levels, high triglyceride levels, and insulin resistance.17 The correlation between adiponectin and cardiovascular disease risk is controversial. Low adiponectin levels are associated with prevalent cardiovascular disease.20–22 Some but not all prospective studies of healthy individuals have reported that higher adiponectin levels are associated with a decreased risk of incident myocardial infarction in men and women.23–26 In contrast, a recent prospective study reported that higher adiponectin levels are associated with greater cardiovascular mortality in men.26 Further research is needed to evaluate the correlation between adiponectin levels and cardiovascular outcomes in men receiving GnRH agonists for the treatment of prostate cancer.
Similar to the estimated 74% prevalence of overweight and obesity reported in U.S. men aged ≥60 years,27 69% of our subjects had a baseline BMI > 25 kg/m2. Consistent with the high prevalence of overweight and obesity, many of our subjects also had > 1 components of the metabolic syndrome at baseline. Although our subjects appear to be representative of the general population of older U.S. men, somewhat different results might be observed in prospective studies of men with a normal BMI. Our study prospectively evaluated 26 subjects for 12 months. Larger studies with longer follow-up might reveal small but statistically significant change(s) in the waist-to-hip ratio, blood pressure, or C-reactive protein levels that were not apparent in our prospective study. The observation that GnRH agonists significantly increase HDL cholesterol and adiponectin levels and preferentially increase subcutaneous fat, changes that are contrary to the metabolic syndrome, however, suggest that larger studies with longer follow-up are unlikely to alter our conclusion that metabolic phenotype of men treated with GnRH agonists is substantially different from the classic metabolic syndrome. All subjects received bicalutamide for the first 4 weeks to block the potential flare associated with initial GnRH agonist treatment and this treatment may have contributed to the observed metabolic changes. The current study did not have a no-treatment control and some of the observed changes may have also resulted from normal aging.
The practical use of the composite definition(s) of the metabolic syndrome centers on its potential value as a risk factor for cardiovascular disease. However, the metabolic syndrome is imprecisely defined and appears to have limited independent value as a marker of cardiovascular disease risk.28,29 Given these limitations and the distinct metabolic changes described in the current prospective study, we recommend that clinicians evaluate and treat individual cardiovascular disease risk factors without regard for whether a prostate cancer survivor meets the criteria for diagnosis of metabolic syndrome. In addition, future research should focus on understanding the clinical implications of the distinct pattern of metabolic changes associated with GnRH agonist therapy in prostate cancer survivors.
In summary, the classic metabolic syndrome is characterized by visceral obesity, insulin resistance, low HDL cholesterol, high triglycerides, elevated C-reactive protein, and low adiponectin levels. In men with prostate cancer, GnRH agonists increase fat mass and waist circumference, decrease insulin sensitivity, and increase serum triglycerides. However, in contrast to the metabolic syndrome, GnRH agonists preferentially increase subcutaneous fat, increase HDL cholesterol and adiponectin levels, and do not change the waist-to-hip ratio, blood pressure, or C-reactive protein levels. Additional research is necessary to better characterize the metabolic effects of GnRH agonist treatment in men with prostate cancer and to understand the implications for cardiovascular disease risk.
Acknowledgments
Supported by grants from the National Institutes of Health (R21 CA101353-01, K24 CA121990-01A1, and GCRC M01-RR-01066) and Prostate Cancer Foundation.
We thank the dedicated staff of Mallinckrodt General Clinical Research Center.
References
- 1.Keating NL, O’Malley AJ, Smith MR. Diabetes and cardiovascular disease during androgen deprivation for prostate cancer. J Clin Oncol. 2006;24:4448–4456. doi: 10.1200/JCO.2006.06.2497. [DOI] [PubMed] [Google Scholar]
- 2.Tayek JA, Heber D, Byerley LO, Steiner B, Rajfer J, Swerdloff RS. Nutritional and metabolic effects of gonadotropin-releasing hormone agonist treatment for prostate cancer. Metabolism. 1990;39:1314–1319. doi: 10.1016/0026-0495(90)90190-n. [DOI] [PubMed] [Google Scholar]
- 3.Smith MR, Finkelstein JS, McGovern FJ, et al. Changes in body composition during androgen deprivation therapy for prostate cancer. J Clin Endocrinol Metab. 2002;87:599–603. doi: 10.1210/jcem.87.2.8299. [DOI] [PubMed] [Google Scholar]
- 4.Berruti A, Dogliotti L, Terrone C, et al. Changes in bone mineral density, lean body mass and fat content as measured by dual energy X-ray absorptiometry in patients with prostate cancer without apparent bone metastases given androgen deprivation therapy. J Urol. 2002;167:2361–2367. discussion,2367. [PubMed] [Google Scholar]
- 5.Smith JC, Bennett S, Evans LM, et al. The effects of induced hypogonadism on arterial stiffness, body composition, and metabolic parameters in males with prostate cancer. J Clin Endocrinol Metab. 2001;86:4261–4267. doi: 10.1210/jcem.86.9.7851. [DOI] [PubMed] [Google Scholar]
- 6.Dockery F, Bulpitt CJ, Agarwal S, Donaldson M, Rajkumar C. Testosterone suppression in men with prostate cancer leads to an increase in arterial stiffness and hyperinsulinaemia. Clin Sci (Lond) 2003;104:195–201. doi: 10.1042/CS20020209. [DOI] [PubMed] [Google Scholar]
- 7.Smith MR, Lee H, Nathan DM. Insulin sensitivity during combined androgen blockade for prostate cancer. J Clin Endocrinol Metab. 2006;91:1305–1308. doi: 10.1210/jc.2005-2507. [DOI] [PubMed] [Google Scholar]
- 8.Eri LM, Urdal P, Bechensteen AG. Effects of the luteinizing hormone-releasing hormone agonist leuprolide on lipoproteins, fibrinogen and plasminogen activator inhibitor in patients with benign prostatic hyperplasia. J Urol. 1995;154:100–104. [PubMed] [Google Scholar]
- 9.Reaven GM. Banting lecture 1988. Role of insulin resistance in human disease. Diabetes. 1988;37:1595–1607. doi: 10.2337/diab.37.12.1595. [DOI] [PubMed] [Google Scholar]
- 10.Reaven GM. The insulin resistance syndrome: definition and dietary approaches to treatment. Annu Rev Nutr. 2005;25:391–406. doi: 10.1146/annurev.nutr.24.012003.132155. [DOI] [PubMed] [Google Scholar]
- 11.Expert Panel on Detection, Evaluation, and Treatment of High Blood Cholesterol in Adults. Executive Summary of the Third Report of the National Cholesterol Education Program (NCEP) Expert Panel on Detection, Evaluation, and Treatment of High Blood Cholesterol in Adults (Adult Treatment Panel III) JAMA. 2001;285:2486–2497. doi: 10.1001/jama.285.19.2486. [DOI] [PubMed] [Google Scholar]
- 12.World Health Organization. Definition, Diagnosis, and Classification of Diabetes Mellitus and Its Complications: Report of a WHO Consultation. Geneva: World Health Organization; 1999. [Google Scholar]
- 13.Braga-Basaria M, Dobs AS, Muller DC, et al. Metabolic syndrome in men with prostate cancer undergoing long-term androgen-deprivation therapy. J Clin Oncol. 2006;24:3979–3983. doi: 10.1200/JCO.2006.05.9741. [DOI] [PubMed] [Google Scholar]
- 14.Smith MR, Goode M, Zietman AL, McGovern FJ, Lee H, Finkelstein JS. Bicalutamide monotherapy versus leuprolide monotherapy for prostate cancer: effects on bone mineral density and body composition. J Clin Oncol. 2004;22:2546–2553. doi: 10.1200/JCO.2004.01.174. [DOI] [PubMed] [Google Scholar]
- 15.Littell RC, Milliken GA, Stroup WW, Wolfinger RD. SAS Systems for Mixed Models. Cary, NC: SAS Institute; 1996. [Google Scholar]
- 16.Fox CS, Massaro JM, Hoffmann U, et al. Abdominal visceral and subcutaneous adipose tissue compartments. Association with metabolic risk factors in the Framingham Heart Study. Circulation. 2007;116:39–48. doi: 10.1161/CIRCULATIONAHA.106.675355. [DOI] [PubMed] [Google Scholar]
- 17.Trujillo ME, Scherer PE. Adiponectin—journey from an adipocyte secretory protein to biomarker of the metabolic syndrome. J Intern Med. 2005;257:167–175. doi: 10.1111/j.1365-2796.2004.01426.x. [DOI] [PubMed] [Google Scholar]
- 18.Haffner SM. The metabolic syndrome: inflammation, diabetes mellitus, and cardiovascular disease. Am J Cardiol. 2006;97:3A–11A. doi: 10.1016/j.amjcard.2005.11.010. [DOI] [PubMed] [Google Scholar]
- 19.Page ST, Herbst KL, Amory JK, et al. Testosterone administration suppresses adiponectin levels in men. J Androl. 2005;26:85–92. [PubMed] [Google Scholar]
- 20.Hotta K, Funahashi T, Arita Y, et al. Plasma concentrations of a novel, adipose-specific protein, adiponectin, in type 2 diabetic patients. Arterioscler Thromb Vasc Biol. 2000;20:1595–1599. doi: 10.1161/01.atv.20.6.1595. [DOI] [PubMed] [Google Scholar]
- 21.Kumada M, Kihara S, Sumitsuji S, et al. Association of hypoadiponectinemia with coronary artery disease in men. Arterioscler Thromb Vasc Biol. 2003;23:85–89. doi: 10.1161/01.atv.0000048856.22331.50. [DOI] [PubMed] [Google Scholar]
- 22.Rothenbacher D, Brenner H, Marz W, Koenig W. Adiponectin, risk of coronary heart disease and correlations with cardiovascular risk markers. Eur Heart J. 2005;26:1640–1646. doi: 10.1093/eurheartj/ehi340. [DOI] [PubMed] [Google Scholar]
- 23.Pischon T, Girman CJ, Hotamisligil GS, Rifai N, Hu FB, Rimm EB. Plasma adiponectin levels and risk of myocardial infarction in men. JAMA. 2004;291:1730–1737. doi: 10.1001/jama.291.14.1730. [DOI] [PubMed] [Google Scholar]
- 24.Lindsay RS, Resnick HE, Zhu J, et al. Adiponectin and coronary heart disease: the Strong Heart Study. Arterioscler Thromb Vasc Biol. 2005;25:e15–e16. doi: 10.1161/01.ATV.0000153090.21990.8c. [DOI] [PubMed] [Google Scholar]
- 25.Lawlor DA, Davey Smith G, Ebrahim S, Thompson C, Sattar N. Plasma adiponectin levels are associated with insulin resistance, but do not predict future risk of coronary heart disease in women. J Clin Endocrinol Metab. 2005;90:5677–5683. doi: 10.1210/jc.2005-0825. [DOI] [PubMed] [Google Scholar]
- 26.Laughlin GA, Barrett-Connor E, May S, Langenberg C. Association of adiponectin with coronary heart disease and mortality: the Rancho Bernardo study. Am J Epidemiol. 2007;165:164–174. doi: 10.1093/aje/kwk001. [DOI] [PMC free article] [PubMed] [Google Scholar]
- 27.Hedley AA, Ogden CL, Johnson CL, Carroll MD, Curtin LR, Flegal KM. Prevalence of overweight and obesity among US children, adolescents, and adults, 1999–2002. JAMA. 2004;291:2847–2850. doi: 10.1001/jama.291.23.2847. [DOI] [PubMed] [Google Scholar]
- 28.Kahn R, Buse J, Ferrannini E, Stern M. The metabolic syndrome: time for a critical appraisal: joint statement from the American Diabetes Association and the European Association for the Study of Diabetes. Diabetes Care. 2005;28:2289–2304. doi: 10.2337/diacare.28.9.2289. [DOI] [PubMed] [Google Scholar]
- 29.Ferrannini E. Metabolic syndrome: a solution in search of a problem. J Clin Endocrinol Metab. 2007;92:396–398. doi: 10.1210/jc.2006-0944. [DOI] [PubMed] [Google Scholar]