

Abstract
Background
Complex dynamic changes in body composition, dietary intake, energy expenditure, and macronutrient oxidation occur during infant growth. Although previous investigators have focused on energy requirements for normal growth, little is known about the dynamic coordination of macronutrient balance.
Objective
Our objective was to develop a mathematical model of the dynamic relations between diet, macronutrient oxidation, and energy expenditure during normal infant growth.
Design
We developed a mathematical model that integrates longitudinal data on changes of body composition and carbon dioxide production determined with the doubly labeled water method to calculate both energy intake requirements and macronutrient oxidation rates during normal infant growth.
Results
The calculated fat oxidation rate was initially <20 kcal · kg-1 · d-1, despite the consumption of >60 kcal · kg-1 · d-1 of dietary fat. This discrepancy was maintained until ≈ 6 mo, after which fat intake was only slightly greater than fat oxidation. Nonfat oxidation closely followed nonfat dietary intake for the duration of the period studied. Model calculations of the energy intake requirements for normal growth were slightly lower than previous estimates. The calculations were robust to variations of body weight, body composition, and diet composition input data, but depended sensitively on variations of carbon dioxide production data.
Conclusions
Our model presents a dynamic picture of how macronutrient oxidation adapts in concert with dietary changes and energy expenditure to give rise to normal tissue deposition. The model integrates a variety of data in a self-consistent way, simulating the complex metabolic adaptations occurring during normal growth while extracting important physiologic information from the data that would otherwise be unavailable.
Keywords: Macronutrients, infant growth, body composition, oxidation rates, mathematical model, doubly labeled water
INTRODUCTION
Infant growth is an extraordinarily complex process involving dynamic changes in body weight, body composition, energy expenditure, and macronutrient intake. After birth, breastfed infants receive a diet that has a relatively high fat content and is dramatically different from the nutritional environment of the fetus (1). Body fat accumulates very quickly in the first few months after birth, but growth of lean body mass subsequently becomes the biggest contributor to weight gain (2). Such changes require complex coordination of substrate utilization to achieve the macronutrient imbalances responsible for tissue deposition during normal growth.
Experimental determination of how macronutrient oxidation rates adapt during normal infant growth is difficult. A comprehensive study of substrate utilization during growth would require 24-h indirect calorimetry measurements at regular intervals while trying to approximate free-living conditions—a task that is far from straightforward to achieve in infancy and early child-hood (3). Recently, our group described a quantitative mathematical relation between body-composition changes and the adaptations of daily macronutrient oxidation rates required to generate these body-composition changes (4). From this relation, food intake and energy expenditure dynamics during adult overfeeding and underfeeding were used to calculate longitudinal body composition and macronutrient oxidation dynamics. The results of that study suggest that it should be possible to similarly relate macronutrient oxidation rates, body composition, food intake, and energy expenditure in growing infants.
Previously, Butte et al (5-7) used measurements of body composition and estimates of 24-h respiratory quotient (RQ) and daily carbon dioxide production rates, measured with the doubly labeled water method, to calculate energy intake requirements for infants at isolated time points over the first 2 y of life. Here, we used a mathematical model to integrate the same data continuously in time to calculate the energy intake, total energy expenditure, and, for the first time, 24-h RQ and macronutrient oxidation rates that must have occurred to generate the observed rates of fat and lean tissue deposition. The mathematical model ensured that the fates of macronutrients were accounted for continuously in time. Furthermore, the model was used to examine the sensitivity of the calculations to realistic uncertainties in the longitudinal input data.
METHODS
We sought to develop a mathematical model of infant growth that integrated body-composition and doubly labeled water data during positive energy balance. Specifically, we aimed to calculate continuous estimates of 1) total energy expenditure dynamics directly by using measurements, 2) energy intake requirements for normal growth 3) the 24-h RQ, and 4) dynamic changes in macronutrient oxidation rates responsible for the macronutrient imbalances leading to the tissue deposition rates observed during normal growth. Published data from breastfed boys from the recent study by Butte et al (5-7) were used as an exemplary case, although any comparable data set may be used in the model.
A schematic outline of the model is shown in Figure 1. The model inputs consist of the data provided by the experiments conducted by Butte et al, whereas the model outputs are those variables calculated by the model. A tabulated list of the experimental data, model parameters, and variables is provided in Table 1. As indicated in Table 1, the model contains 9 parameters in addition to the inputs and outputs indicated in Figure 1. There are no free parameters in the model, as the values of all 9 parameters are provided by the literature.
FIGURE 1.

Schematic diagram of model. The 4 components on the left—carbon dioxide production , % fat in diet, body weight (BW), and lean mass versus fat mass curve (L vs F)—are inputs to the model. The 4 components on the right—energy intake (EI), total energy expenditure (TEE), oxidation rates of fat and other substrates, and respiratory quotient (RQ)—are outputs of the model.
TABLE 1.
Summary of model components 1
| Symbol | Name | Status | Value (source) |
|---|---|---|---|
| F | Body fat mass | Butte et al data2 | Figure 2 (5) |
| L | Lean body mass | Butte et al data2 | Figure 2 (5) |
| ρL | Energy density of lean mass changes | Butte et al data | Figure A1 (7) |
| Daily carbon dioxide production rate | Butte et al data | Figure A2 (6) | |
| A | Respiratory quotient for fat | Parameter | 0.7 (8) |
| B | Respiratory quotient for protein | Parameter | 0.83 (8) |
| C | Respiratory quotient for carbohydrate | Parameter | 1.0 (8) |
| α | Weir equation parameter | Parameter | 1.25 kcal/L (9) |
| β | Weir equation parameter | Parameter | 3.76 kcal/L (9) |
| γ | Weir equation parameter | Parameter | -1.09 kcal/L (9) |
| fP | Fraction of energy expenditure rate accounted for by protein oxidation | Parameter | 0.1 (10) |
| ρF | Energy density of fat mass changes | Parameter | 9440 kcal/kg (11) |
| ρP | Energy density of protein mass changes | Parameter | 4700 kcal/kg (11) |
| E | Total energy expenditure rate | Model variable | Calculated by model |
| fF | Fraction of energy expenditure rate accounted for by fat oxidation | Model variable | Calculated by model |
| IF | Metabolizable intake rate of fat | Model variable | Calculated by model |
| IL | Combined metabolizable intake rates of protein and carbohydrate | Model variable | Calculated by model |
| Effective energy density of lean mass changes | Model variable | Calculated by model | |
| K | Model variable | Calculated by model | |
| g | K dL/dF | Model variable | Calculated by model |
| RQ | Respiratory quotient | Model variable | Calculated by model |
The model consists of data provided by Butte et al, parameters whose values are specified according to the values shown, and variables whose values are calculated by the model during simulation.
F and L are used by the model through the F vs L curve illustrated in Figure 2B. When simulating how body weight changes with time, however, F and L are free variables calculated by the model.
The mathematical details linking the model inputs and outputs are contained in Appendix A. The model equations were solved through an optimization procedure, with the algorithm seeking to find the energy intake and expenditure rates as well as the fat and nonfat oxidation rates that minimize the difference between the simulated and observed body-weight and body-composition changes during normal growth while simultaneously ensuring that these variables were consistent with the data obtained by Butte et al. The optimization procedure is discussed in detail in Appendix A.
The model inputs, which were obtained directly from the experimental data of Butte et al (5-7), are illustrated in Figure 2. To facilitate calculation of the model outputs continuously through time rather than at discrete time points, the experimental data were fit by using smoothing splines (shown as the solid lines in Figure 2).
FIGURE 2.

Experimental data (×) and corresponding smoothing spline fits (solid lines) used as inputs to the model. A: Carbon dioxide production data measured by Butte et al. The data are from Table 2 of reference 6. It should be noted that Butte et al only reported values from 3 mo of age onward; we therefore extrapolated these values to estimate a value of at 15 d of age. B: Percentage of energy intake from fat during the growth of male breastfed infants. The values were calculated from Table 3 of reference 7, assuming energy densities for fat, protein, and carbohydrate of 9440 kcal/kg, 4700 kcal/kg, and 4180 kcal/kg, respectively. C: Average body weight of male breastfed infants during the first 2 y of growth. The data are from Table 1 of reference 5. D: Lean mass plotted as a function of fat mass in growing male infants. The data for lean and fat mass are from Table 2 of reference 5.
To ensure that the composition of the calculated dietary intake (Figure 2B) was representative of the average diet of a growing infant, we assumed that the relative proportions of the fat and nonfat contents of the diet were the same as those in Butte et al’s study. That is, we did not specify how many calories the infant consumed (this was calculated by the model), but we did constrain the infant to consume a diet consisting of x% fat and (100 - x) % nonfat, with the value of x changing with time according to the data provided by Butte et al for the breastfed boys (7). We assumed that the diets had adequate high-quality protein and that their micronutrient content was complete.
RESULTS
Energy intake requirements and total energy expenditure
The calculated energy intake requirements for an average male breastfed infant are depicted as dashed curves in Figure 3A and 3B. Total energy expenditure, calculated by using Equation A13 (Appendix A) and based on the data from Butte et al, is shown as solid curves. As suggested in Figure 3, A and B, after an initial period of ≈6 mo, during which there was a large positive energy balance, energy expenditure tracked intake very closely. The initial phase of positive energy balance corresponded with the period of the greatest rate of growth during the first 2 y of life (Figure 2C) and with the period of the greatest rate of body fat accumulation.
FIGURE 3.

Energy requirements, energy expenditure, and substrate oxidation rates during growth. A: Model calculations of energy requirements (dashed line) and total energy expenditure (solid line) for the first 2 y of life. Also shown are the energy requirements proposed by Butte et al (×) (6) and the energy requirements recommended by the FAO/WHO/UNU expert consultations in 1985 (+) (12) and in 2004 (□) (13) for reference. B: The same data as in panel A, except that the data are plotted per kilogram of body weight. C: Calculated fat and combined carbohydrate and protein (ie, nonfat) intakes (dashed lines) and corresponding oxidation rates (solid lines) during growth. D: The same data as in panel C, except that the data are plotted per kilogram of body weight.
Also shown in Figure 3, A and B, are the recommended energy requirements suggested by Butte et al (indicated by the symbol ×). As illustrated in Figure 3A, the recommended energy requirements calculated by Butte et al, which match the 2004 FAO/WHO/UNU recommendations for growing infants very well (indicated by the symbol □) (13), are slightly higher than the energy requirements calculated by our model. All of these estimated energy requirements are significantly lower than the 1985 FAO/WHO/UNU recommendations for growing infants (indicated by the symbol +) (12).
Macronutrient intake and oxidation rates
The calculated fat and nonfat intake rates are depicted as dashed curves in Figure 3, C and D. These simulations indicated that breastfed male infants ingest fat at an approximately constant absolute rate during the first 2 y of life. However, the fat oxidation rate is initially very low and the majority of the fat consumed by the infants is stored in the body during this period of growth. Over time, the fat oxidation rate plateaus below 300 kcal/d, whereas the nonfat oxidation rate gradually grows to ≈700 kcal/d at 2 y of age as the nonfat proportion of the diet increases.
Fat oxidation fraction and respiratory quotient
The fraction of energy expenditure derived from fat oxidation during the first 2 y of life is shown in Figure 4A. Although the fat oxidation rate is initially very low, fat oxidation comprises ≈25% of total substrate oxidation just after birth. The fat oxidation fraction then rises to almost 45% at ≈4 mo of age, after which it drops approximately linearly back to 25% over the remainder of the period studied.
FIGURE 4.

A: Fat oxidation fraction during infant growth, as calculated by the model. B: Calculated 24-h respiratory quotient (solid line). Also shown are the respiratory quotients assumed by Butte et al for their calculations of total energy expenditure (×). Data for the assumed respiratory quotients are from reference 6.
The solid curve in Figure 4B illustrates the time course of the calculated 24-h RQ required to match the body-composition and dynamics measured by Butte et al. Also shown are the RQ values assumed by Butte et al to calculate total energy expenditure in their study (indicated by the symbol ×) (6). As indicated in Figure 4B, the RQ values assumed by Butte et al, based on food quotient estimates, are different from the values calculated by our model. Despite these differences, the predicted time course of total energy expenditure did not differ greatly from the total energy expenditure calculated by Butte et al using the estimated RQ values (data not shown).
Model sensitivity
As indicated in Table 1, the model uses experimental data as input. Given the reported variability of the experimental data, we explored the sensitivity of the calculated energy intake, total energy expenditure, and 24-h RQ to variation in the time course of the 4 model inputs indicated in Figure 1: 1) , 2) fat content of the diet, 3) body weight, and 4) body-composition curve. The variability (ie, the SD) in data was reported previously by Butte et al (6), as was the variability in body weight and lean and fat masses (5).
Three different curves for each set of input data were studied. The first set of curves studied, corresponding to the variation in , is shown in Figure 5A. The mean is shown as a solid line, whereas the time courses of one SD below and one SD above the mean are shown as dashed and dashed-dotted curves, respectively.
FIGURE 5.

Sensitivity of the model to variations in the time course of carbon dioxide production rate. A: Mean (solid line) and shifted carbon dioxide production rate curves. The dashed curve is approximately one SD below the mean, whereas the dashed-dotted curve is approximately one SD above the mean. B-D: Effects of shifting the carbon dioxide production rate curve on calculated total energy expenditure (B), energy intake (C), and 24-h respiratory quotient (D).
The effect of shifting the curve on total energy expenditure and energy intake is shown in Figure 5, B and C, respectively. A shift in the data to one SD below the mean resulted in a large drop in both the calculated total energy expenditure and the energy intake, whereas a shift in the data above the mean had the opposite effect. A shift in the curve also had a significant effect on 4-5 mo of life, as illustrated in Figure 5D. After these early differences, the RQ dynamics for the shifted curves were practically identical to those of the mean data for the remainder of the period studied.
The mean and shifted curves for the fat content of the diet are shown in Figure 6A. Here, the data are shifted so that the fat content is either 10% lower (dashed curve) or higher (dashed-dotted curve) compared with the mean data over the entire time course. In this case, varying the fat content of the diet had almost no effect on the calculated total energy intake or energy expenditure (Figure 6, B and C). Altering the fat content of the diet did, however, have a significant effect on the 24-h RQ (Figure 6D). Lowering the fat content of the diet caused an increase in the 24-h RQ, with the opposite changes occurring in response to an increase in the fat content of the diet.
FIGURE 6.

Sensitivity of the model to variations in the fat content of the diet. A: Mean (solid line) and shifted curves depicting the fat content of the diet. The dashed curve is 10% below the mean, whereas the dashed-dotted curve is 10% above the mean. B-D: Effects of altering the fat content of the diet on calculated total energy expenditure (B), energy intake (C), and 24-h respiratory quotient (D).
The effects of shifting the body-weight curve away from the mean are shown in Figure 7. The dashed curve in panel A represents a shift of one SD below the mean, whereas the dashed-dotted curves represent a shift of one SD above the mean. As indicated in panels B through D, variation in the body-weight and body-composition curves had very little effect on the calculated energy intake, total energy expenditure, and 24-h RQ.
FIGURE 7.

Sensitivity of the model to variations in the time course of body weight. A: Mean (solid line) and shifted body-weight curves. The dashed curve is approximately one SD below the mean, whereas the dashed-dotted curve is approximately one SD above the mean. B-D: Effects of shifting the body-weight curve on calculated total energy expenditure (B), energy intake (C), and 24-h respiratory quotient (D).
The effects of shifting the body-composition curve are shown in Figure 8. The dashed curves in Figure 8 indicate a shift of the body-composition curve of one SD down and to the right, whereas the dashed-dotted curves represent a shift of one SD up and to the left. As indicated in panels B through D, variation in the body-composition curves similarly had very little effect on the calculated energy intake, total energy expenditure, and 24-h RQ.
FIGURE 8.

Sensitivity of the model to variations in the body-composition curve. A: Mean (solid line) and shifted body-composition curves. The dashed curve is approximately one SD below and to the right of the mean, whereas the dashed-dotted curve is approximately one SD above and to the left of the mean. B-D: Effects of shifting the body-composition curve on calculated total energy expenditure (B), energy intake (C), and 24-h respiratory quotient.
DISCUSSION
Our mathematical model of infant macronutrient balance presents a continuous dynamic picture of the complex interactions of macronutrient intake, oxidation, and body composition that occur during normal growth. The model was used to integrate a variety of experimental data from the longitudinal study of Butte et al (5-7), and, for the first time, calculated the dynamic changes in macronutrient oxidation rates and the changes in 24-h RQ that would be required to consistently integrate the body composition, diet composition, and daily average data obtained by Butte et al.
Our model predicted that breastfed boys undergo significant dynamic adaptations of fuel selection over the first 2 y of life. Despite a very high initial percentage of dietary fat, oxidation of fat is greatly suppressed and only gradually increases after birth, whereas nonfat oxidation closely follows intake over the entire period. These substrate oxidation dynamics are reflected in the time course of the calculated 24-h RQ, where the low initial level of fat oxidation is manifested as a high initial RQ that is followed by a drop over time as relatively more fat is burned.
The physiologic mechanisms underlying these changes in substrate utilization are not specified by our model and deserve further investigation. Because the nutritional environment of the developing fetus is determined primarily by a high rate of glucose transfer across the placenta (14), it is possible that the gestational period has endowed the newborn with a low capacity for fat oxidation and a high capacity for de novo lipogenesis (which can appear as a low fat oxidation via indirect calorimetry). Alternatively, the magnitude of positive energy balance during postnatal development may itself regulate substrate utilization, suppressing fat oxidation through an insulin-related mechanism. Indeed, whereas insulin concentrations have been observed to dramatically fall over the first 48 h after birth (15), insulin remains 2.5-fold higher 48 h after birth than 1 y after birth (16).
Because the rate of weight gain is driven by an imbalance between energy intake and expenditure, it is necessary to know the time course of total energy expenditure to use the body-composition changes to calculate energy intake. The doubly labeled water method is the gold standard method for assessing free-living energy expenditure, but this method requires an estimate of the 24-h RQ to translate the measured rate into total energy expenditure (17). Butte et al previously assumed that the RQ could be estimated on the basis of diet composition along with corrections for body-composition change determined from previous cross-sectional data (2, 6, 17). However, the assumed cross-sectional body-composition data (2) had previously been shown to significantly differ from Butte et al’s longitudinal measurements, especially during the first year of life (5). Therefore, the previous assumptions used to estimate the 24-h RQ, and thereby determine the total energy expenditure, were not self-consistent.
Our model, on the other hand, calculated the 24-h RQ that was required to be consistent with the body-composition, diet composition, and data obtained by Butte et al, thereby bypassing the need to provide RQ estimates to calculate total energy expenditure. The model predicted energy intake requirements that were slightly lower than the previous estimates of Butte et al (6) as well as the 2004 FAO/WHO/UNU recommendations for growing infants (13) and were significantly lower than previous estimates (12). Nevertheless, the fact that our new estimates for the energy intake requirements are similar to those of Butte et al suggests that the assumed RQ values used in that study, although different from our calculated values, had little effect on the calculated total energy expenditure (18, 19).
It should be noted that there is a paucity of longitudinal data on 24-h RQs for growing infants. Much of the available RQ data relates to very-low-birth-weight and preterm infants (20-25), with only limited data available for full-term infants (26, 27). Although the lack of available data precludes a direct comparison between simulation and experiment, our simulations provide experimentally testable predictions for how RQ would be expected to vary during infancy. Furthermore, the ability of our model to extract information about RQ exemplifies how mathematical modeling may be used to obtain information from experimental data that would otherwise be missed.
The experimental data obtained by Butte et al was reported in the literature as mean values and corresponding SDs because the data resulted from measurements of 76 different infants (5-7). Given that the model uses these data as inputs, we investigated whether the variability of the data influenced the model outputs. We calculated energy intake, total energy expenditure, and 24-h RQ dynamics in response to variations in the time courses of , percentage fat content of the diet, body weight, and body-composition curves compared with their mean values.
We found that fairly large changes in the percentage fat content of the diet, body weight, or body-composition curves had little effect on the calculated energy intake or the total energy expenditure. Changing the percentage fat content of the diet did, however, markedly alter the 24-h RQ dynamics, whereas shifting the body weight and body-composition curves had practically no effect on the RQ dynamics. Shifting the rate curve generated a significant change in the energy dynamics and in the initial dynamics of the calculated 24-h RQ.
In summary, our study demonstrates the utility of integrating experimental data through a mathematical model to extract physiologic information that would otherwise not be available. As we have shown, the model can be used to determine how variability in the experimental measurements (ie, the model inputs) influences the calculated values of interest (ie, the model outputs)—a task that would be prohibitively tedious without the aid of a mathematical model.
APPENDIX A
Macronutrient balance model
Our model is based on a previous mathematical model of macronutrient balance that relates body-composition dynamics to macronutrient intake and oxidation rates in adults (1). Consider the following equations that describe macronutrient balance:
| (A1) |
| (A2) |
where E is total energy expenditure, F is body fat mass, IF is the metabolizable intake rate of fat, L is lean body mass, IL is the sum of the metabolizable intake rates of protein and carbohydrate, and ρF and ρL are the energy densities of F and L, respectively. fF is the fraction of the energy expenditure rate accounted for by fat oxidation. In other words, fFE is the fat oxidation rate and (1 - fF)E is the sum of the oxidation rates of carbohydrate and protein. Equation A1 simply states that the rate of change of energy stored in the body as fat results from differences between fat intake and oxidation rates. Equation A2 is a similar equation for the combination of carbohydrate and protein balances and their effect on the rate of change of energy stored in the body as lean mass. Because glycogen comprises a small fraction of lean body mass, the energy content of L is typically attributed to body protein alone (2).
Energy density of lean mass
It is reasonable to assume that the energy density of body fat, ρF, is a constant, and does not change during development. However, it has been observed that the protein content of lean body mass changes during early stages of growth (3, 4), which means that ρL is not constant. To account for the changing composition of lean body mass, we introduced an effective energy density of lean mass changes, denoted , by expanding the left side of Equation A2 using the product rule:
| (A3) |
Rearranging Equation A3 gives the following equation for as a function of L:
| (A4) |
We used the average body-composition data provided by Butte et al (4) to first determineρL as a function of lean mass. Specifically, we assumed that the energy content of lean mass was provided solely by the protein content of the lean mass. The percentage protein content of lean mass in growing infants (4) was used to calculate the energy density of lean mass (ρL) at any given age by dividing the energy content supplied by protein (assuming an energy density of protein of 4700 kcal/kg; see Table 1) by the total lean mass at that age.
The values for ρL calculated from the data using this method and the line of best fit used in our model are shown in Figure A1A. Using Equation A4, we then computed the effective energy density of lean mass changes, , as shown in Figure A1B. As evident in Figure A1, is an increasing function of lean mass that is always greater than the absolute energy density of the lean body mass.
With this modification, Equations A1 and A2 can be rewritten as follows:
| (A5) |
| (A6) |
Body-composition dynamics
In their current form, Equations A5 and A6 treat L and F independently. However, the data from Butte et al determine an empirical relation between L and F for an average growing infant that can be used to constrain the dynamics of our model (4). The average body-composition curve relating L and F for breastfed infant boys is shown in Figure 2B. During growth, the infant moves along this curve as both L and F increase. Because L is a smooth function of F, its derivative dL/dF is a well-defined function of F.
To incorporate this empirical relation between L and F into the model, we divided Equation A6 by Equation A5 and rearranged terms to find the fat oxidation rate, fFE, and nonfat oxidation rate (1 - fF)E:
| (A7) |
| (A8) |
where . Equations A7 and A8 calculate how the macronutrient oxidation rates adapt to changes in diet, energy expenditure, and lean and fat mass; dL/dF was calculated at any given fat mass from the slope of the curve in Figure 2B. In other words, these equations ensure that macronutrient oxidation rates adapt appropriately to give rise to a normal body composition relation during growth.
With the use of Equations A7 and A8, we can rewrite Equations A5 and A6 in their final form:
| (A9) |
| (A10) |
Equations A9 and A10 ensure that the body-composition changes by moving along the curve depicted in Figure 2B. However, the rate of movement along this curve, and the corresponding rate of change of body weight, cannot be determined until both the total energy expenditure and energy intake rates are specified.
Alternatively, given the time courses for body weight and total energy expenditure, the macronutrient balance equations can be used to determine the dietary intake requirements for normal growth. This latter procedure was used in the present study; for this procedure to be used, however, it was necessary to simultaneously compute the time course of total energy expenditure. This was done by using the data provided by Butte et al (5).
FIGURE A1.

Energy density (A) and effective energy density (B) of lean mass. The symbol “X” in panel A represent experimental data, whereas the solid line in panel A represents the line of best fit used in simulations. The energy density of lean mass was calculated by multiplying the percentage of protein in lean mass by the energy density of protein (assumed to be 4700 kcal/kg). The effective energy density of lean mass (B) was calculated by using Equation A4. The data for the percentage of protein in lean mass is from Table 4 of reference 4; corresponding data for lean mass is from Table 2 of reference 4.
Calculating total energy expenditure
Total energy expenditure can be calculated from , respiratory quotient (RQ), and nitrogen excretion (N) according to the Weir equation:
| (A11) |
Here, the parameters α = 1.25 kcal/L, β = 3.76 kcal/L, and γ = -1.09 kcal/g are given by Cunningham (6). The doubly labeled water method used by Butte et al (5) provides a measurement of the average rates at various time points, but calculation of E necessitates estimation of the RQ corresponding to each measurement. Although Butte et al estimated the RQ based on diet composition, our model self-consistently calculates the continuous changes in the RQ based on the macronutrient oxidation rates responsible for the appropriate relative fat and lean tissue deposition for a given dietary intake, as described below.
The relation between RQ and macronutrient oxidation rates is as follows:
| (A12) |
where fP is the fraction of the energy expenditure accounted for by protein oxidation, (1 - fF - fP) is the fraction of the energy expenditure accounted for by carbohydrate oxidation, and A = 0.7, B = 0.83, and C = 1 are the RQs for fat, protein, and carbohydrate oxidation, respectively (7). N can be determined from the protein oxidation rate (fPE) according to N = (fPE/6.25ρP), where it is assumed that 1 g N is generated by 6.25 g protein, and ρP = 4.7 kcal/g is the energy density of protein (8).
Insertion of Equation A12 into Equation A11 yields the following expression for E:
| (A13) |
where is measured in liters per day. The data obtained by Butte et al from male breastfed infants and used in our model is shown in Figure 2A. We assumed that the protein oxidation fraction is a constant value, fP = 0.1 (9). Therefore, Equation A13 calculates the total energy expenditure from the measurements once the fat oxidation fraction (fF) is specified.
Calculating fF from , IF, IL, and fP
To use EquationA13 to calculate total energy expenditure, it is necessary to know the fat oxidation fraction (fF) dynamics; fF is obtained by inserting Equation A13 into Equation A7 and rearranging the resulting equation as follows, such that fF can be calculated in terms of , IF, IL, and fP.
Equation A7 can be rearranged in the following manner:
| (A14) |
where
| (A15) |
However, from Equation A13, we know that
| (A16) |
Insertion of Equation A16 into Equation A14 gives
| (A17) |
Expansion of Equation A17 results in the following quadratic equation in fF:
| (A18) |
, IF, IL, and fP are known as a function of time. As a result, the 2 roots of Equation A18 can also be calculated as a function of time. Both roots of Equation A18 are real, but only one is positive and less than one in magnitude. Given that the fat oxidation fraction must satisfy these constraints, fF is set equal to this root.
Optimization procedure
The preceding discussion lays out the details of the equations used in the model. For a given diet (IF and IL), our equations calculate the fat oxidation fraction (fF) and corresponding RQ, the relative deposition rates of fat and lean tissue (ie, movement along the L vs F curve), and the corresponding total energy expenditure (E) consistent with given data.
To run simulations using the model, we used the following procedure:
Make an initial guess of the time course for the metabolizable energy intake, I.
Calculate the time courses for IF and IL (given that IF + IL = I) by using the diet composition depicted in Figure 2B.
Use the initial body weight (from experimental data) to calculate initial values for L and F (Figure 2D).
Calculate g (Equation A15), fF (Equation A18), E (Equation A13), F (Equation A5), and L (Equation A6) simultaneously as functions of time.
Calculate RQ (Equation A12) as a function of time.
FIGURE A2.
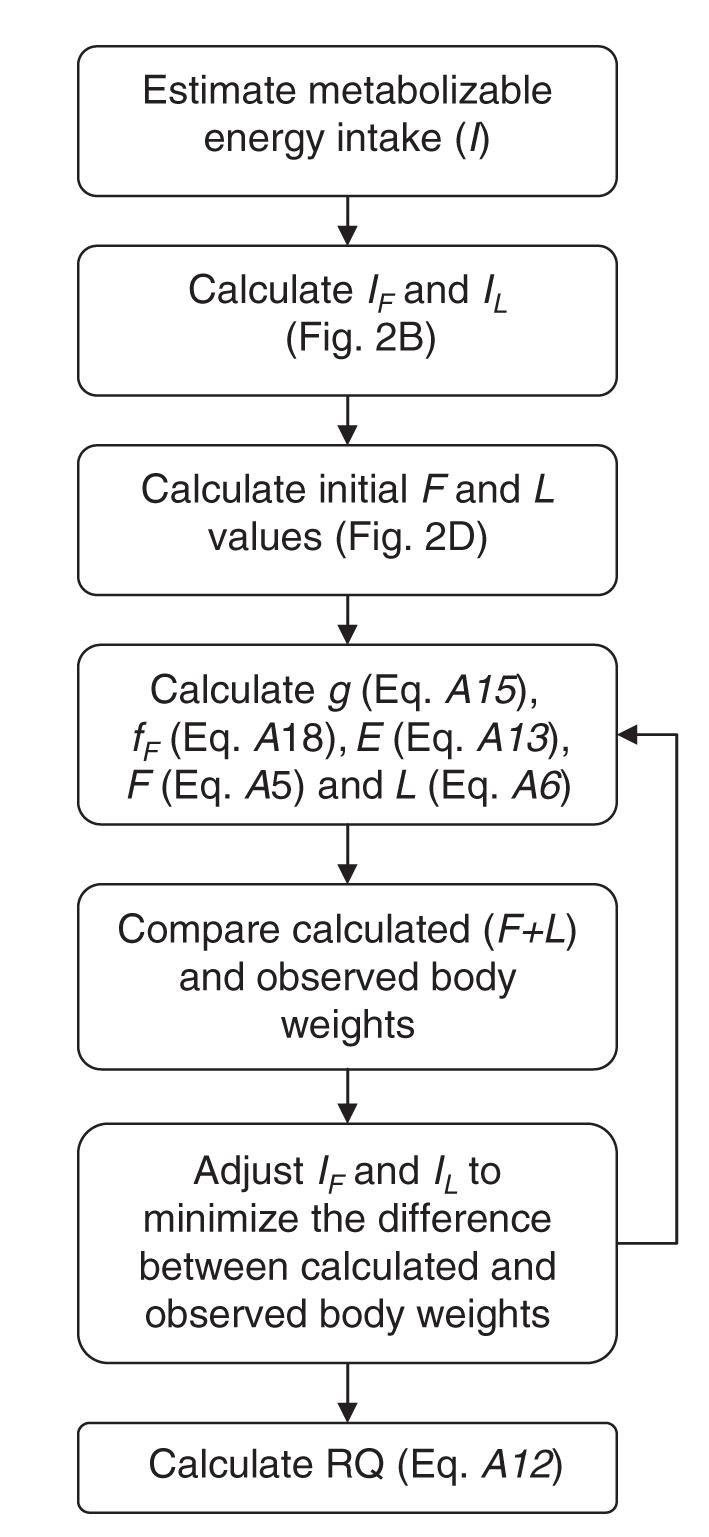
Flow chart detailing the iterative procedure used for calculating energy intake, total energy expenditure, and substrate oxidation rates during growth consistent with the body composition, diet composition, and carbon dioxide production data provided by Butte et al (4, 5, 10).
This procedure calculates the time course of L and F consistent with the data for a given estimate of energy intake dynamics. However, only the correct energy intake rate (I = IF + IL) will reproduce the rate of weight gain observed in experiments, thereby providing an estimate of the energy requirements of normally growing infants. We therefore have a well-posed optimization problem: find the energy intake rate that minimizes the difference between the simulated and measured changes in body weight during normal growth.
On the basis of the preceding modeling procedure, we used the following iterative optimization procedure (depicted in its entirety in Figure A2) to determine the energy intake requirements for normally growing infants:
Given an estimate of the time course for the metabolizable energy intake, I, calculate g (Equation A15), fF (Equation A18), E (Equation A13), F (Equation A5), and L (Equation A6) simultaneously as functions of time. (See steps 1-4 in the preceding procedure.)
Compare the calculated body weight time course (L + F) with the observed body weight data from Butte et al in the least-squares sense.
Adjust the estimated time course of I (and, hence, the time courses of IF and IL) based on the comparison of the calculated and observed body weight data to minimize the difference between the calculated and observed data.
Return to step 1 and repeat until the calculated body weight dynamics from Equations A5 and A6 match the observed body weight dynamics and IF, IL, and E converge to their own unique time courses.
Calculate RQ (Equation A12) from the optimized time course of fF.
The iterative optimization and numerical evaluation of the ordinary differential equations was performed in MATLAB (version R2007a; MathWorks Inc, Natick, MA). The optimization of I to minimize the difference between the calculated and observed body weight data were performed by using the “lsqcurvefit” function in MATLAB. This function uses a subspace trust region algorithm to perform the optimization.
REFERENCES
- 1.Hall KD, Bain HL, Chow CC. How adaptations of substrate utilization regulate body composition. Int J Obes (Lond) 2007;31:1378–83. doi: 10.1038/sj.ijo.0803608. [DOI] [PMC free article] [PubMed] [Google Scholar]
- 2.Wishnofsky M. Caloric equivalents of gained or lost weight. Am J Clin Nutr. 1958;6:542–6. doi: 10.1093/ajcn/6.5.542. [DOI] [PubMed] [Google Scholar]
- 3.Forbes GB. Human body composition: growth, aging, nutrition, and activity. Springer-Verlag; New York, NY: 1987. [Google Scholar]
- 4.Butte NF, Hopkinson JM, Wong WW, Smith EO, Ellis KJ. Body composition during the first 2 y of life: an updated reference. Pediatr Res. 2000;47:578–85. doi: 10.1203/00006450-200005000-00004. [DOI] [PubMed] [Google Scholar]
- 5.Butte NF, Wong WW, Hopkinson JM, Heinz CJ, Mehta NR, Smith EO. Energy requirements derived from total energy expenditure and energy deposition during the first 2 y of life. Am J Clin Nutr. 2000;72:1558–69. doi: 10.1093/ajcn/72.6.1558. [DOI] [PubMed] [Google Scholar]
- 6.Cunningham JJ. Calculation of energy expenditure from indirect calorimetry: assessment of the Weir equation. Nutrition. 1990;6:222–3. [PubMed] [Google Scholar]
- 7.Frayn KN. Metabolic regulation: a human perspective. 2nd ed Blackwell Science; Oxford, United Kingdom: 2003. [Google Scholar]
- 8.Livesey G, Elia M. Estimation of energy expenditure, net carbohydrate utilization, and net fat oxidation and synthesis by indirect calorimetry: evaluation of errors with special reference to the detailed composition of fuels. Am J Clin Nutr. 1988;47:608–28. doi: 10.1093/ajcn/47.4.608. [DOI] [PubMed] [Google Scholar]
- 9.Forsyth JS, Murdock N, Crighton A. Low birthweight infants and total parenteral nutrition immediately after birth. III. Randomized study of energy substrate utilization, nitrogen balance, and carbon dioxide production. Arch Dis Child Fetal Neonatal Ed. 1995;73:F13–6. doi: 10.1136/fn.73.1.f13. [DOI] [PMC free article] [PubMed] [Google Scholar]
- 10.Butte NF, Wong WW, Hopkinson JM, Smith EO, Ellis KJ. Infant feeding mode affects early growth and body composition. Pediatrics. 2000;106:1355–66. doi: 10.1542/peds.106.6.1355. [DOI] [PubMed] [Google Scholar]
Footnotes
Supported by the Intramural Research Program of the NIH, NIDDK.
Reprints not available. Address correspondence to KD Hall, NIDDK/NIH, 12 South Drive, Room 4007, Bethesda, MD 20892-5621. E-mail: kevinh@niddk.nih.gov.
Both authors contributed equally to all aspects of the study. Neither author had any personal or financial conflict of interest.
REFERENCES
- 1.Cetin I, Alvino G, Radaelli T, Pardi G. Fetal nutrition: a review. Acta Paediatr Suppl. 2005;94:7–13. doi: 10.1111/j.1651-2227.2005.tb02147.x. [DOI] [PubMed] [Google Scholar]
- 2.Fomon SJ, Haschke F, Ziegler EE, Nelson SE. Body composition of reference children from birth to age 10 years. Am J Clin Nutr. 1982;35:1169–75. doi: 10.1093/ajcn/35.5.1169. [DOI] [PubMed] [Google Scholar]
- 3.Wells JC. Energy metabolism in infants and children. Nutrition. 1998;14:817–20. doi: 10.1016/s0899-9007(98)00092-6. [DOI] [PubMed] [Google Scholar]
- 4.Hall KD, Bain HL, Chow CC. How adaptations of substrate utilization regulate body composition. Int J Obes (Lond) 2007;31:1378–83. doi: 10.1038/sj.ijo.0803608. [DOI] [PMC free article] [PubMed] [Google Scholar]
- 5.Butte NF, Hopkinson JM, Wong WW, Smith EO, Ellis KJ. Body composition during the first 2 years of life: an updated reference. Pediatr Res. 2000;47:578–85. doi: 10.1203/00006450-200005000-00004. [DOI] [PubMed] [Google Scholar]
- 6.Butte NF, Wong WW, Hopkinson JM, Heinz CJ, Mehta NR, Smith EO. Energy requirements derived from total energy expenditure and energy deposition during the first 2 y of life. Am J Clin Nutr. 2000;72:1558–69. doi: 10.1093/ajcn/72.6.1558. [DOI] [PubMed] [Google Scholar]
- 7.Butte NF, Wong WW, Hopkinson JM, Smith EO, Ellis KJ. Infant feeding mode affects early growth and body composition. Pediatrics. 2000;106:1355–66. doi: 10.1542/peds.106.6.1355. [DOI] [PubMed] [Google Scholar]
- 8.Frayn KN. Metabolic regulation: a human perspective. 2nd ed. Blackwell Science; Oxford, United Kingdom: 2003. [Google Scholar]
- 9.Cunningham JJ. Calculation of energy expenditure from indirect calorimetry: assessment of the Weir equation. Nutrition. 1990;6:222–3. [PubMed] [Google Scholar]
- 10.Forsyth JS, Murdock N, Crighton A. Low birthweight infants and total parenteral nutrition immediately after birth. III. Randomised study of energy substrate utilisation, nitrogen balance, and carbon dioxide production. Arch Dis Child Fetal Neonatal Ed. 1995;73:F13–6. doi: 10.1136/fn.73.1.f13. [DOI] [PMC free article] [PubMed] [Google Scholar]
- 11.Livesey G, Elia M. Estimation of energy expenditure, net carbohydrate utilization, and net fat oxidation and synthesis by indirect calorimetry: evaluation of errors with special reference to the detailed composition of fuels. Am J Clin Nutr. 1988;47:608–28. doi: 10.1093/ajcn/47.4.608. [DOI] [PubMed] [Google Scholar]
- 12.Energy and protein requirements. Report of a joint FAO/WHO/UNU Expert Consultation. World Health Organ Tech Rep Ser. 1985;724:1–206. [PubMed] [Google Scholar]
- 13.Butte NF. Energy requirements of infants and children. [accessed 2 January 2008];Nestle Nutrition Workshop Series Pediatric Program. 2006 doi: 10.1159/000094842. Internet: http://www.ars.usda.gov/research/publications/Publications.htm?seq_no_115=191326. [DOI] [PubMed]
- 14.Herrera E, Amusquivar E. Lipid metabolism in the fetus and the newborn. Diabetes Metab Res Rev. 2000;16:202–10. doi: 10.1002/1520-7560(200005/06)16:3<202::aid-dmrr116>3.0.co;2-#. [DOI] [PubMed] [Google Scholar]
- 15.Pegorier JP, Prip-Buus C, Duee PH, Girard J. Hormonal control of fatty acid oxidation during the neonatal period. Diabetes Metab. 1992;18:156–60. [PubMed] [Google Scholar]
- 16.Mericq V, Ong KK, Bazaes R, et al. Longitudinal changes in insulin sensitivity and secretion from birth to age three years in small-and appropriate-for-gestational-age children. Diabetologia. 2005;48:2609–14. doi: 10.1007/s00125-005-0036-z. [DOI] [PubMed] [Google Scholar]
- 17.Black AE, Prentice AM, Coward WA. Use of food quotients to predict respiratory quotients for the doubly-labelled water method of measuring energy expenditure. Hum Nutr Clin Nutr. 1986;40:381–91. [PubMed] [Google Scholar]
- 18.Mansell PI, Macdonald IA. Reappraisal of the Weir equation for calculation of metabolic rate. Am J Physiol. 1990;258:R1347–54. doi: 10.1152/ajpregu.1990.258.6.R1347. [DOI] [PubMed] [Google Scholar]
- 19.Schutz Y. On problems of calculating energy expenditure and substrate utilization from respiratory exchange data. Z Ernahrungswiss. 1997;36:255–62. doi: 10.1007/BF01617794. [DOI] [PubMed] [Google Scholar]
- 20.Roberts SB, Coward WA, Schlingenseipen KH, Nohria V, Lucas A. Comparison of the doubly labeled water (2H2(18)O) method with indirect calorimetry and a nutrient-balance study for simultaneous determination of energy expenditure, water intake, and metabolizable energy intake in preterm infants. Am J Clin Nutr. 1986;44:315–22. doi: 10.1093/ajcn/44.3.315. [DOI] [PubMed] [Google Scholar]
- 21.Jensen CL, Butte NF, Wong WW, Moon JK. Determining energy expenditure in preterm infants: comparison of 2H(2)18O method and indirect calorimetry. Am J Physiol. 1992;263:R685–92. doi: 10.1152/ajpregu.1992.263.3.R685. [DOI] [PubMed] [Google Scholar]
- 22.Forsyth JS, Crighton A. Low birthweight infants and total parenteral nutrition immediately after birth. I. Energy expenditure and respiratory quotient of ventilated and non-ventilated infants. Arch Dis Child Fetal Neonatal Ed. 1995;73:F4–7. doi: 10.1136/fn.73.1.f4. [DOI] [PMC free article] [PubMed] [Google Scholar]
- 23.van Goudoever JB, Sulkers EJ, Lafeber HN, Sauer PJ. Short-term growth and substrate use in very-low-birth-weight infants fed formulas with different energy contents. Am J Clin Nutr. 2000;71:816–21. doi: 10.1093/ajcn/71.3.816. [DOI] [PubMed] [Google Scholar]
- 24.Steward DK, Pridham KF. Stability of respiratory quotient and growth outcomes of very low birth weight infants. Biol Res Nurs. 2001;2:198–205. doi: 10.1177/109980040100200305. [DOI] [PubMed] [Google Scholar]
- 25.Bauer J, Maier K, Hellstern G, Linderkamp O. Longitudinal evaluation of energy expenditure in preterm infants with birth weight less than 1000 g. Br J Nutr. 2003;89:533–7. doi: 10.1079/BJN2002816. [DOI] [PubMed] [Google Scholar]
- 26.Roberts SB, Savage J, Coward WA, Chew B, Lucas A. Energy expenditure and intake in infants born to lean and overweight mothers. N Engl J Med. 1988;318:461–6. doi: 10.1056/NEJM198802253180801. [DOI] [PubMed] [Google Scholar]
- 27.Zoppi G, Luciano A, Cinquetti M, Graziani S, Bolognani M. Respiratory quotient changes in full term newborn infants within 30 hours from birth before start of milk feeding. Eur J Clin Nutr. 1998;52:360–2. doi: 10.1038/sj.ejcn.1600564. [DOI] [PubMed] [Google Scholar]