

Abstract
In solution, half-cell potentials are measured relative to those of other half cells, thereby establishing a ladder of thermochemical values that are referenced to the standard hydrogen electrode (SHE), which is arbitrarily assigned a value of exactly 0 V. Although there has been considerable interest in, and efforts toward, establishing an absolute electrochemical half-cell potential in solution, there is no general consensus regarding the best approach to obtain this value. Here, ion-electron recombination energies resulting from electron capture by gas-phase nanodrops containing individual [M(NH3)6]3+, M = Ru, Co, Os, Cr, and Ir, and Cu2+ ions are obtained from the number of water molecules that are lost from the reduced precursors. These experimental data combined with nanodrop solvation energies estimated from Born theory and solution-phase entropies estimated from limited experimental data provide absolute reduction energies for these redox couples in bulk aqueous solution. A key advantage of this approach is that solvent effects well past two solvent shells, that are difficult to model accurately, are included in these experimental measurements. By evaluating these data relative to known solution-phase reduction potentials, an absolute value for the SHE of 4.2 ± 0.4 V versus a free electron is obtained. Although not achieved here, the uncertainty of this method could potentially be reduced to below 0.1 V, making this an attractive method for establishing an absolute electrochemical scale that bridges solution and gas-phase redox chemistry.
Introduction
Whereas absolute energies for many chemical processes are readily measurable, the absolute potentials of isolated half-cells in solution are not.1 Half-cell redox potentials are routinely measured relative to those of other half-cells, thereby establishing a ladder of relative thermochemical values. This ladder is anchored to the universally accepted (for reactions in protic solvents) standard hydrogen electrode (SHE), which has arbitrarily been assigned a value of exactly 0 V. Measurement of an absolute half-cell potential would make possible an anchor to which all other half-cell potentials may be referenced, thereby establishing an absolute electrochemical scale. Considerable effort has been applied toward defining and ultimately determining an absolute half-cell potential.1-16 At least three different definitions for an absolute redox potential have been proposed. In one, the “absolute,” or single,17 half-cell potential is defined versus a free electron at rest in vacuum.2 There is substantial interest in this definition because the resulting values are important for matching semiconductor energy levels to Fermi levels of electrolytic solutions,18,19 comparing calculated potentials to measurable values (vide infra),20-34 and obtaining the solvation energy of an electron (or adiabatic electron affinity, AEA) in water.35,36 Absolute half-cell potentials may also be referenced to a solvated electron2 (by combining the AEA with the first definition). In a third definition, the potentials are referenced to an electron in a metal electrode.2
Numerous estimates have been made for the potential of the SHE versus a free electron.1-7 Reiss and Heller proposed a value of +4.43 V,3 calculated from a thermodynamic cycle that combines the work function of 110 p-InP, the Schottky barrier created between the InP and H2 saturated Pt, and the potential of zero charge for the Pt surface when in contact with water at pH = 0. An implicit assumption in this definition is that the dipole of the InP is 0. Parsons proposed a value of +4.44 V,4 and Trasatti made an International Union of Pure and Applied Chemistry recommendation for this same value.2 Parsons used a thermocycle that combines the atomization and ionization energies of hydrogen with the absolute proton hydration energy. The latter value has been the subject of some controversy.37-39 Alternatively, using the absolute proton hydration free energy obtained from extrapolated cluster data of ion pairs (−11.45 eV),37,38 this same method gives a value of +4.3 V. Trasatti used a similar approach to Parsons' but included another thermocycle that combines the potential of zero charge of Hg, with its work function, the potential of an Hg/air/SHE cell, and the contact potential difference between Hg and water, which results in essentially the same value. These two approaches, however, are not independent because many of the values are obtained from the same experimental data. Gomer and Tryson obtained a value of +4.73 V by measuring the potential between a reference electrode in air above a solution and the solution combined with the work function of the reference.5 Hansen and Kolb originally suggested a value of +4.7 V by measuring the work function of electrodes slowly removed from solutions.6 Subsequent work by Hansen and co-workers resulted in a value of +4.456 V from measurements of the potential between the Fermi level of lead and an electrolyte solution in vacuum and assuming a value of 4.495 eV for the work function of Hg.7 To date, there is no general agreement on either the absolute value of the SHE or on the best approach to obtain this value, in part due to the plethora of methods, assumptions, and significant uncertainties. This has led Trasatti to conclude that “despite the numerous discussions, nobody seems seriously convinced of the arguments of the others.”8
In contrast to solutions, absolute gas-phase ionization energies of isolated atoms and ions are well understood and can be readily measured. These absolute energies can be related to solution values by calculating the solvation energies of the oxidized and reduced species. This strategy has been employed extensively to obtain both relative and absolute solution-phase reduction potentials.20-34 To compare the calculated absolute redox potentials to relative experimental values, an estimate of the absolute SHE versus a free electron was used. Thus, evaluating the accuracy of these computational approaches depends on the value of the absolute SHE potential. A key difficulty to calculating bulk redox potentials with this strategy is the ability to correctly evaluate ion solvation energies, an especially difficult problem for the first few ion solvation shells where the solvent molecules behave anomalously when compared to the bulk.20,40,41 Uudsemaa and Tamm calculated the redox potentials of M3+/2+, for M = Sc, Ti, Cr, Mn, Fe, Co, Ni, and Cu, treating M and what was assumed to be the first two solvation shells (18 water molecules) with density functional theory and related the ionization reaction to solution with the conductor-like solvation model.20 Values for M = V, Cr, Fe, and Cu were reproduced to within 0.1 V or better compared to experiment, and the average error for all M investigated was 0.29 V. For similar redox calculations, increasing the number of solvent molecules treated explicitly has been shown to increase the accuracy of such approaches.20-22
Correlations have been shown to exist between the gas-phase electron affinities and solution-phase reduction potentials of neutral aromatic compounds in nonaqueous solvents.42,43 Further correlations have been noted between first ionization energies and one electron reduction potentials for aromatic compounds,42,44-46 as well as for a series of closely related tris(β-diketonato)-ruthenium(III) complexes.47 The degree of correlation between the gas- and solution-phase data depends strongly upon solvent effects,44,48 which has limited these studies to investigations of molecules and solvents in which these effects remain relatively constant or negligible. Similar correlations have not been reported for redox reactions in aqueous solutions or for charge states greater than +1.
We recently proposed a route toward establishing an absolute electrochemical scale based on experimental measurements of the energy deposited into hydrated ions upon capture of a thermally generated electron in the gas phase.49 Capture of a thermally generated electron by a multivalent hydrated ion results in a reduced cluster and accompanying water molecule loss.49-51 For large hydrated clusters, the dissociation process is statistical and the energy deposition resulting from electron capture (EC) can be obtained from the sum of the binding energies of the water molecules lost.49-51 For larger clusters, the sequential binding energies of water molecules are not a strong function of metal ion identity, charge state, or cluster size, making it possible to use these nanodrops as “nanocalorimeters” to accurately measure the internal energy deposition resulting from ion activation. For [M(H2O)32]2+, M = Mg, Ca, Sr, and Ba, the recombination energy (RE) is relatively constant (4.5 and 4.4 eV for Mg and Ba, respectively) despite a 5.0 eV range in second ionization energies of the bare atoms, indicating that an ion-electron pair is formed in the nanodrop.50 Results for other ions indicate that the oxidation state of the metal ion in the nanodrop is reduced.49 In combination with estimates of nanodrop solvation energies obtained from Born theory, these gas-phase nanodrop reduction energies can be related to bulk solution-phase reduction potentials. Initial investigation of the [Ru(NH3)6]3+/2+ redox couple indicated a reduction energy of roughly −3.8 eV (+3.8 V) at 0 K referenced to a solvated electron.49 This route toward obtaining an absolute electrode potential has a key advantage over pure computational approaches in that the effects of solvent organization near the ion are included in the experimental measurements well past two solvation shells.
Here, we report experimentally measured absolute reduction potentials of the [M(NH3)6]3+/2+, for M = Ru, Co, Os, Cr, and Ir, and the Cu2+/1+ redox couples in gas-phase nanodrops. Estimates of solvation energies of the charged nanodrops and temperature corrections to standard conditions are made to obtain values of the absolute reduction potentials of these redox couples in bulk aqueous solution. From these values, a measure of the absolute SHE potential is obtained.
Experimental
Nanocalorimetry
A 2.75 T Fourier-transform ion cyclotron resonance (FT/ICR) mass spectrometer with an external electrospray ionization (ESI) source and temperature controlled ion cell (cooled with a regulated flow of liquid N2) is used for these experiments.52 Nano ESI using borosilicate capillaries that are pulled to an inner diameter of ∼1 μm at the tip is used to produce hydrated ions from 1 mM aqueous solutions.51,53 The potential of a platinum wire that is in direct contact with solution is ∼550 V relative to the heated (∼100 °C) capillary entrance to the mass spectrometer. Ions are introduced into the ion cell after passing through five stages of differential pumping and are accumulated for 6 s during which time N2 gas is introduced at a pressure of ∼10−6 Torr using a piezoelectric valve to enhance ion trapping and thermalization of the ions. A mechanical shutter is closed after the accumulation period preventing additional ions from entering the cell. Ions are stored for an additional 6 s to ensure steady state internal energy distributions and allow the vacuum chamber pressure to return to ∼10−8 Torr before introducing electrons into the cell for EC experiments. The temperature of the copper jacket that surrounds the ion cell is maintained at 130 K.
For EC experiments, a 1.0 cm diameter heated dispenser cathode impregnated with barium scandate (Heatwave Labs, Watsonville, CA) and mounted axially 20 cm from the cell center is used to produce electrons. A direct current of 3 A heats the cathode to ∼950 °C. Following ion isolation with SWIFT waveforms and a 50 ms delay, electrons are introduced by applying −1.4 V to the cathode housing for 40 ms. A potential of +10 V is applied to the cathode at all other times to prevent electrons from entering the cell. A copper wire mesh is mounted 0.5 cm in front of cathode housing and held at +9 V.
A MIDAS data system was used to collect 64 K data point transients. The average number of water molecules lost from the reduced precursor ions is calculated from a weighted average of the observed product ion distribution. This value is corrected for the blackbody infrared radiative dissociation loss of up to 0.1 water molecules that occurs in the absence of EC, yielding the corrected average loss due to EC alone.51 The relative product ion abundances were fit with Gaussian distributions using the optimized Levenberg–Marquardt method in the software package Igor Pro 4.07 (WaveMetrics, Inc., Lake Oswego, OR). The noise level was used to estimate the fragment ion abundances at both extremes of the distributions.
Ru(NH3)6Cl3, Co(NH3)6Cl3, and CuCl2 were purchased from Aldrich (St. Louis, MO). The synthesis of Cr(NH3)6(NO3)3 and Os(NH3)6I3 were performed as described elsewhere.54,55 Although [Os(NH3)6]3+ is reported to decompose over several hours in aqueous solution,55 it remained stable in aqueous solution at a concentration of 100 mM for several weeks. Professor Jamie H. Cate (University of California, Berkeley) generously provided a sample of Ir(NH3)6Cl3.
Computational
All calculations were performed using hybrid density functional theory methods (B3LYP) as implemented in Jaguar v6.5 (Schrödinger, LLC, Portland, OR). Ionization energies were calculated using unrestricted spin methods and a triple-ζ contraction of the LANL2DZ effective core potential with diffuse D functions (LACV3P+). Internal energies were calculated using a set of vibrational frequencies obtained by calculating harmonic frequencies for a B3LYP/LACVP**++ energy-minimized structure of [Ca(H2O)14]2+. The average internal energy was calculated for this set of harmonic oscillators at the temperature of interest and was linearly scaled by the vibrational degrees of freedom of the cluster of interest divided by the vibrational degrees of freedom of [Ca(H2O)14]2+.
Results and Discussion
Electron Capture
A broad distribution of hydrated ions, [M(NH3)6(H2O)n]3+, M = Ru, Co, Os, Cr, and Ir, and [Cu-(H2O)n]2+ can be generated using nano ESI and stored in a cooled ion cell (130 K) of a FT/ICR mass spectrometer. For EC, the cluster of interest is isolated and electrons, generated by a heated cathode (950 °C), are introduced into the ion cell by applying −1.4 V to the cathode relative to instrument ground for 40 ms. Results from EC experiments for [M(NH3)6(H2O)55]3+, M = Ru, Co, Os, Cr, and Ir, are shown in Figure 1. Upon EC, fragment ions corresponding to exclusively loss of water molecules from the reduced clusters are observed for all metal ions at this cluster size. In addition to water molecule loss, some loss of a single ammonia molecule along with water loss is observed for Cr and loss of up to two ammonia molecules accompanied by water molecule loss is observed for Ir in low abundance (<3%). The number of ligands (water or ammonia) lost does not depend significantly on the ligand identity although the weighted average of ligands lost is slightly higher for the all water channel for Cr suggesting that the binding energy of ammonia to the cluster may be slightly higher than that of a water molecule. The extent of ammonia loss is less than that expected statistically if each of the ammonia molecules were equivalent to each of the water molecules. Both results are consistent with the location of the ammonia in the inner core of the precursor ion.
Figure 1.
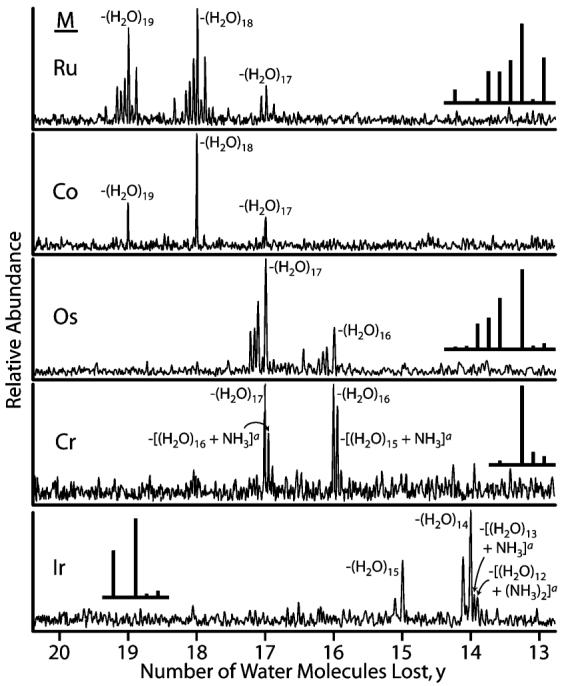
Product ion mass spectra resulting from EC by [M(NH3)6(H2O)55]3+, M = Ru, Co, Os, Cr, and Ir, to form [M(NH3)6(H2O)n−y]2+ + yH2O. Spectra are aligned by the number of water molecules lost from the reduced precursor ions. Insets are theoretical isotope distributions calculated for the most abundant product ion. Fragment ions corresponding to the loss of one or two ammonia molecules in addition to water molecule loss overlap in m/z with the isotopic contribution from the all water loss dissociation channel.
The number of ligand molecules lost is 17–19 for Ru and Co, 16 and 17 for Os and Cr, and 14 and 15 for Ir. From the product ion abundances, a weighted average of 18.2, 18.0, 16.7, 16.3, and 14.2 ligand molecules are lost from each of these respective clusters. Unlike the results for hydrated alkaline earth metal ions,50,51 the differing number of water molecules lost from each of these clusters suggests that that the metal ion in the nanodrop is reduced upon EC.
Cluster Size
The number and identity of ligands lost from the reduced precursor ions depend on cluster size, metal ion identity, and charge state. The number of water molecules lost from the reduced precursor increases with cluster size, reaches a broad plateau, and then decreases slowly with increasing nanodrop size.49,51 For smaller clusters, the binding energy of the water increases with decreasing cluster size56,57 so that fewer water molecules are lost for a given internal energy deposition. This effect apparently predominates over any increase in electron RE that is expected for smaller clusters,51,58 although nonergodic dissociation observed for small clusters may also play a role.51 For large clusters, ions are increasingly stabilized by additional water molecules resulting in lower gas-phase REs. A larger number of degrees of freedom59 and slightly higher water binding energies due to surface and solvation energy effects60,61 with increasing cluster size may also contribute.50
The extent of ammonia loss is a function of both cluster size and metal identity. As reported previously,49 [Ru(NH3)6(H2O)n]3+ clusters with n ≥ 40 lose exclusively water molecules, whereas loss of one or more ammonia molecules accompanies water molecule loss for the smaller clusters. The plateau region for maximum water molecule loss extends over a broad range (n = 40–55). Similar results were obtained for the other metal ions although subtle differences exist. A nanodrop consisting of 55 water molecules and a single [M(NH3)6]3+ ion corresponds roughly to a concentration or activity of 1 M. The extent of water molecule loss upon EC of neighboring clusters are similar suggesting that effects of any “magic” clusters, if present, are minimal. No magic clusters were apparent in any of the ESI spectra. Thus, the choice of precursor clusters with 55 water molecules is somewhat arbitrary and does not significantly affect the final value of the SHE we report, although data acquired from even larger clusters may potentially provide a more accurate measure of this value (vide infra).
A more detailed analysis of the size-dependent water molecule loss will be presented elsewhere. However, it is interesting to speculate why an ammonia molecule is lost for some metals but not others at this cluster size. In solution, the extent of reversibility of each [M(NH3)6]3+/2+ couple is different and depends on a number of environmental factors, such as temperature, pH, concentration, and electrolyte identities. The redox reaction for M = Ru in aqueous solution is highly reversible; aquation, or other decomposition of the reduced species was not observed using a cyclic voltammetry (CV) scan rate of 50 V/s.62 For M = Os, the couple is reversible at all but the slowest scan rates (0.05 V/s).63 For aqueous M = Co and Ir, the reduced species aquates (loses ammonia) rapidly. No reverse oxidation CV wave for either species was observed at a 100 V/s scan rate.64 The M = Cr couple was also determined to be irreversible by CV.65 In our gas-phase nanodrop experiments, no ammonia ligand loss occurs for [M(NH3)6(H2O)55]3+, M = Ru, Co, and Os, but a small amount is observed for M = Cr and Ir. With the exception of M = Co, the gas-phase data appear to correlate with the observations of reversible and irreversible redox couple behavior from solution-phase CV data. Additional CV measurements to determine the reversibility of these redox couples under more similar conditions along with EC measurements as a function of size would provide useful information about the stability of the reduced species at short times.
For [Cu(H2O)n]2+, only water molecule loss is observed for clusters with n ≥ 26; loss of a hydrogen atom accompanied by water molecule loss is observed for smaller clusters (n ≤ 26), as was observed previously for [Ca(H2O)n]2+ with n ≤ 28.51 The maximum number of water molecules lost upon EC by [Cu(H2O)n]2+ occurs for n between 24 and 33; for [Cu(H2O)32]2+, an average of 16.3 water molecules are lost upon EC.
Background Dissociation
Under the conditions of these experiments, some dissociation of the precursor ion by loss of a single water molecule occurs during the 90.4 ms time between the end of ion isolation and the start of ion detection even without introducing electrons into the cell. The abundance of this single product ion depends on cluster size and is between 6 and 10%. Previous studies indicate that most of this dissociation occurs due to absorption of blackbody photons generated by the heated cathode (950 °C) that is located 20 cm from the cell and that dissociation due to inelastic collisions with electrons is not observed under these experimental conditions.50,51 This effect could be minimized by moving the heated cathode further from the cell. The average number of water molecules lost from each of the precursor ions is corrected for the minor background loss,51 which is less than or equal to 0.10 water molecules for these clusters.
Kinetic Shift
The number of water molecules lost from the reduced precursor can be influenced by a kinetic shift, in which energy above the threshold dissociation energy, E0, is required to observe fragmentation on the time scale of the experiment. This shift can become increasingly problematic for larger ions that have more degrees of freedom. At 130 K, [M(NH3)(H2O)55]3+ ions have an average of roughly 24 kcal/mol (1.0 eV) of internal energy, an amount that exceeds the threshold dissociation for loss of a water molecule (roughly 9 kcal/mol or 0.39 eV). The minor abundance of the loss of a water molecule from the precursor ion due to blackbody radiation suggests that any effects of a kinetic shift are small under these conditions. Experiments in which the temperature of the initial precursor ion population is varied prior to EC are currently underway. Loss of water molecules appears to occur rapidly; no additional water molecule loss is observed for [Ca(H2O)47]2+ when the time after EC but before ion detection is increased by 50 ms. Any kinetic shift effect will result in the observed recombination energies obtained from the average number of water molecules lost to be lower than the actual value.
Recombination Energies
The vertical ionization energy of a hydrated cluster is greater than the adiabatic ionization energy (AIE) by a value corresponding to the solvent reorganization energy of the ionized cluster (λz+) (Figure 2). Although EC may be a vertical process, the experimentally determined RE should closely approximate the AIE of the reduced species because the time between EC and the start of ion detection is between 0.4 and 40.4 ms (depending on when EC occurs), which is significantly longer than the time needed for solvent reorganization to occur. Results from condensed phase ultrafast spectroscopy experiments66 and molecular dynamics simulations67,68 indicate that water reorganization occurs in low picoseconds. Energy released by solvent reorganization of the product cluster (λ(z−1)+) after EC will contribute to the observed water evaporation from the cluster. The observation of no additional loss of water from [Ca(H2O)47]2+ when the time between EC and ion detection is increased by 50 ms is consistent with solvent reorganization being complete on the time scale of these experiments.
Figure 2.
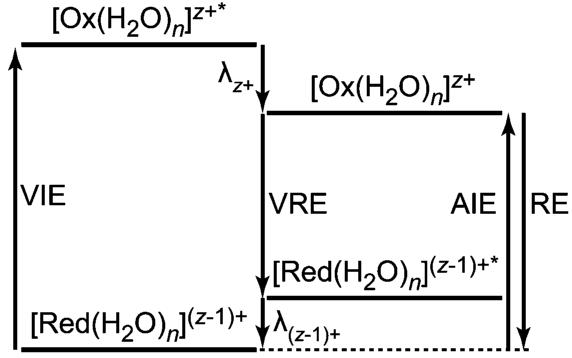
Energy level diagram of the ionization and reduction of a hydrated metal cluster cation, with a hydration number of n, in the gas phase. The adiabatic ionization energy (AIE), vertical ionization energy (VIE), vertical reduction energy (VRE), recombination energy (RE), and the solvent reorganization energies of the z+ and (z − 1)+ clusters (λz+ and λ(z−1)+, respectively) are shown.
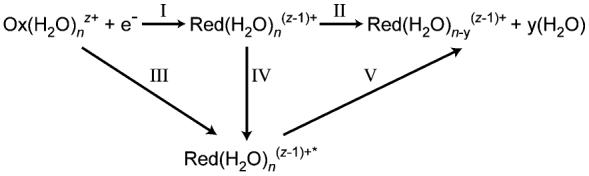
Ion-electron recombination, depicted in Scheme 1, results in an activated reduced species (Pathway III) from which water molecule loss occurs (Pathway V). If this process occurs without heat exchange with the surroundings, that is, the process is adiabatic, ΔU(III) and ΔU(V) = 0. In these experiments, the pressure is ∼1 × 10⁻⁸ Torr so that effects of collisions on the sub 40.4 ms time frame should be negligible. In addition, effects of radiative cooling should also be minimal both because of the short time frame and because of the fast evaporative cooling by weakly bound water molecules. The energy corresponding to Pathway IV is equivalent to the combined sum of the E0 values for each water molecule lost and the energy partitioned into the translational, rotational, and vibrational modes of each water molecule via Pathway II. This quantity is the RE and ΔU(I) = −RE and ΔU(II) = RE. Thus, if the energetics for water molecule loss from the activated reduced precursor are known, the adiabatic ionization energy of the reduced cluster may be obtained (Pathway I) as well as the ionization enthalpy at 298 K from eq 1
| (1) |
in which the change in constant pressure heat capacities is integrated over the temperature range 0–298 K.
Scheme 1.
Threshold Dissociation Energies at Large Cluster Sizes
To determine the RE from the number of water molecules lost from the reduced precursor, the E0 values for the loss of these water molecules must be known. Values for the size clusters investigated in this study have not been directly measured. For such large clusters, we proposed that the binding energy should be roughly 10 kcal/mol (0.43 eV)49-51 based on trends established from measurements on smaller ionic clusters56,69 and the bulk heat of vaporization for water (10.5 kcal/mol at 298 K).70 Here, we explicitly evaluate these values as a function of cluster size using the Thomson liquid drop model.61 In this model, the stepwise binding free energies, enthalpies, and entropies for finite size clusters are obtained from the sum of the free energies of bulk vaporization, droplet formation, and ion solvation terms. Values for the solvent parameters are those for bulk water at 298 K.
Results from the Thomson liquid drop model are shown in Figure 3 in which the enthalpy for the loss of a water molecule from a cluster of size n (ΔHn,n−1) is plotted as a function of solvation number for Cu+ and M2+. As an approximation, the metal ions are treated as point charges and the ammonia molecules are treated as water molecules. As expected, effects of charge state for the smaller clusters are significant, but the difference in binding enthalpies between a singly and doubly charged metal containing droplet is reduced to less than 1 kcal/mol for clusters with n ≥ 29. The stepwise binding enthalpies for the reduced clusters formed in these experiments range from 9.7 to 9.8 kcal/mol for M2+ (n = 43 to 61) and 9.2 kcal/mol for Cu1+ (n = 16 to 32). The corresponding E0 values are estimated from these stepwise binding enthalpies using eq 2
| (2) |
where the vibrational energy lost from the precursor is assumed to be equal to the gained translational, rotational and vibrational energy of the products. At 298 K, the E0 values are 0.6 kcal/mol less than the binding enthalpies. The E0 values obtained from the Thomson liquid drop model for Cu1+ (8.6 kcal/mol for n = 16 to 32) are nearly the same as that reported previously (8.5 kcal/mol) for singly charged hydrated anions for clusters with between 15 and 30 water molecules.71
Figure 3.
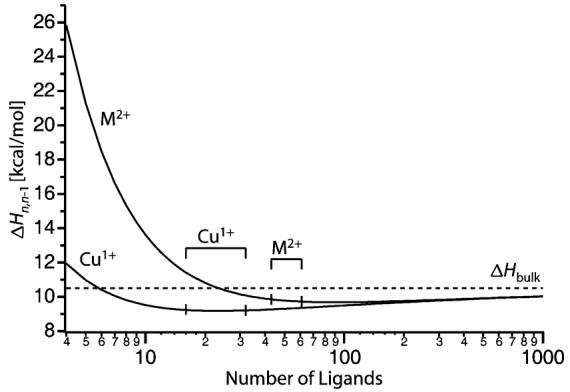
Sequential binding enthalpies (ΔHn,n−1) calculated as a function of cluster size for hydrated Cu+ and M2+ using the Thomson liquid drop model and parameters for bulk water at 298 K. Dashed line indicates the bulk heat of vaporization of liquid water (ΔHbulk). Cluster sizes relevant to this study are indicated.
Energy Partitioning Effects
In each case, the internal energy distribution resulting from EC by these ions is remarkably narrow compared to most other activation methods.72 For example, EC by [Os(NH3)6(H2O)55]3+ results in an average number of 16.7 water molecules lost, but only two product ions, corresponding to the loss of 16 and 17 water molecules, are observed. In addition to causing the loss of water molecules from the reduced precursor, the RE can partition into translational, rotational, and vibrational energies of the products. Thus, the RE can be estimated from the threshold for formation of the smallest product ion (maximum number of water molecules lost) for which the combined translational, rotational, and vibrational modes of the products are zero. Due to the limited S/N in these experiments, accurately determining threshold values is challenging. A potentially more accurate approach is to determine the RE from the average number of water molecules lost combined with an estimate of the overall average energy partitioned into the products. Very little energy should partition into the vibrational modes of the water molecules that are lost from the reduced precursors because these modes should not be significantly populated under these conditions. Some energy, however, will be lost to translational and rotational modes of the products. For dissociation reactions where there is essentially no reverse activation barrier, as should be the case here, the most probable kinetic energy of each departing water molecule is zero, but because there are many water molecules lost (between 14 and 19), the most probable energy for the sum total of the lost water molecules will be nonzero.
Both the translational and rotational energy distributions associated with each water molecule lost should be an exponential function with the maximum at zero owing to the large number of oscillators and essentially no reverse activation barrier for this process.73 The average translational and rotational energy lost to each departing water molecule is approximately (5/2)• kB•T*, where T* is the effective temperature of the newly formed cluster.60 Upon EC, the effective temperature of the reduced cluster significantly increases. To estimate the energy partitioned into the products, the average effective temperatures of the clusters are calculated for each sequential water molecule loss assuming that the entire RE is deposited prior to the evaporation of any water molecule using eq 3
| (3) |
where U(Tn*) is the average internal energy of the reduced cluster (prior to any dissociation), U130K is the initial precursor energy at 130 K, and the RE is the sum of the E0 values and the sum of average energy partitioned into the products. The effective temperatures of the stepwise product clusters are obtained using eq 4
| (4) |
for each stepwise cluster. From this array of expressions, the effective temperatures of each stepwise cluster may be iteratively solved.
Calculated effective temperatures as a function of the number of water molecules lost are plotted in Figure 4 for reduced [Os(NH3)6(H2O)55]3+ and [Cu(H2O)32]2+. The reduced [M(NH3)6(H2O)55]3+ clusters initially have T* values ranging from 409 to 477 K which reflects differences in REs for these species. The T* of the reduced Cu cluster (696 K) is much higher than that of the reduced Os(NH3)6 cluster (451 K), despite the fact that both have the same RE (7.8 eV). The different T* in this case is due to the different number of degrees of freedom for these two different size clusters.
Figure 4.
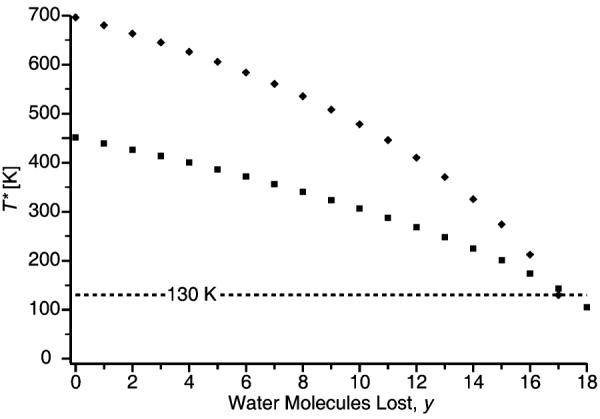
Calculated effective temperatures (T*) for the sequential cluster ions as a function of water molecules lost (y) from the reduced clusters ([Cu(H2O)32−y]1+ and [Os(NH3)6(H2O)55−y]2+).
Product Ion Distribution Width
The distribution of energy partitioned into the products should be roughly Gaussian when the number of water molecules lost is large (Central Limit Theorem), as is the case here. The width of this Gaussian is a measure of the contribution of translational and rotational energy release to the width of the distribution of product ions formed. The internal energy distribution of the precursor will also contribute to this width.
The widths of the product ion distributions were calculated for the case in which broadening results exclusively from translational and rotational energy release. From the mean of the energy release distribution of each departing water molecule, the variance for the sum total of water loss may be calculated. The width of the product ion distribution, σ, is obtained from the variance.
The experimentally measured product ion distributions were fit using a Gaussian and the widths of these Gaussian functions (σ) as well as those from the calculations neglecting the precursor internal energies are given in Table 1. For [M(NH3)6(H2O)55]3+, the observed width is comparable to the calculated width. This suggests that the effects of the internal energy distributions of the starting precursors are negligible, or that our calculations overestimate the contributions of energy partitioning into the products. In contrast to the results for [M(NH3)6(H2O)55]3+, the measured width for [Cu(H2O)32]2+ is significantly less than the calculated value, indicating that the calculated energy partitioning is too large. This suggests that some water molecule loss may occur on the time scale in which the RE is converted into internal modes resulting in lower effective cluster temperatures than those predicted if the conversion to internal energy is instantaneous. This may be due to a multistep electronic to vibrational energy conversion process or it could be due to the production of a meta-stable intermediate, such as an ion-electron pair in which the metal ion in the droplet is not yet reduced and the electron resides close to the periphery of the nanodrop.49 Such an intermediate may be longer lived than the time scale for evaporation of several water molecules.
Table 1.
Width of the Measured Product Ion Distribution (in Number of Water Molecules) Resulting from EC Fit Using a Gaussian Distribution and That Modeled Assuming That the Only Contribution to This Width Is from Partitioning of Energy (Kinetic Energy Released) into Translational and Rotational Modes of the Products (See Text)
| precursor | observed width (σ) |
maximuma KER width (σ) |
minimumb KER width (σ) |
|---|---|---|---|
| [Ru(NH3)6(H2O)55]3+ | 0.78(8) | 0.67 | 0.28 |
| [Co(NH3)6(H2O)55]3+ | 0.77(7) | 0.67 | 0.28 |
| [Os(NH3)6(H2O)55]3+ | 0.54(3) | 0.62 | 0.27 |
| [Cr(NH3)6(H2O)55]3+ | 0.55(4) | 0.61 | 0.27 |
| [Ir(NH3)6(H2O)55]3+ | 0.55(2) | 0.53 | 0.25 |
| [Cu(H2O)32]2+ | 0.59(16) | 0.93 | 0.28 |
| [Cu(H2O)33]2+ | 0.59(3) | 0.91 | 0.28 |
Modeled assuming that energy deposition, including solvent reorganization, occurs faster than the loss of any water molecules.
Modeled assuming that energy deposition, including solvent reorganization, occurs much slower than water molecule loss.
To obtain an estimate of the solvent evaporation kinetics, the evaporation model of Klots74 was used to determine the lifetimes of the reduced precursor for [Os(NH3)6(H2O)55]3+ and [Cu(H2O)32]2+ using the initial temperatures from Figure 4; these lifetimes are roughly 8 × 10⁻¹³ and 2 × 10⁻¹⁴ s, respectively. These lifetimes are sufficiently short that some water molecule loss may occur prior to full energy conversion and solvent reorganization. To estimate the maximum possible magnitude of competitive water molecule loss, the analysis described above was done using the assumption that the energy conversion into internal modes was significantly slower than the time scale for water evaporation so that the effective temperature of the reduced droplet never exceeds 157 K due to evaporative cooling. The resulting width (σ ≈ 0.27) obtained using this “slow internal energy conversion model” is substantially less than any of the widths from the experimental data indicating that although some water molecule loss may occur prior to complete energy conversion, this effect is likely to be relatively small, that is, the energy conversion is as fast or faster than significant water molecule loss.
Comparison to Gas-Phase Atomic Ionization Energies
Gas-phase reduction energies for [M(NH3)6(H2O)55]3+ , M = Ru, Co, Os, Cr, and Ir, and [Cu(H2O)32]2+ are given in Table 2 (at 0 K) along with the corresponding ionization energies of the bare ions. The corresponding values for the hexamine complexes have not been reported. Interestingly, there is no apparent correlation between the ionization energies of the bare ions and the RE of these gas-phase nanodrops. For example, the average RE of [Ru(NH3)6(H2O)55]3+ (8.5 eV) is higher than that of [Cr(NH3)6(H2O)55]3+ (7.6 eV) or [Ir(NH3)6(H2O)55]3+ (6.6 eV), but the third ionization energies of both Cr and Ir are higher than that of Ru. Even more striking are the results for [Cu(H2O)32]2+ that has a RE of 7.8 eV, which is comparable to [Cr(NH3)6(H2O)55]3+ despite the significantly higher third ionization energy of Cr (31 eV) compared to the second ionization energy of Cu (20 eV).
Table 2.
Average Number of Water Molecules Lost (x), Second and Third Ionization Energies (IE) of the Bare Metal Atoms, and Recombination Energy (RE) Values for [M(NH3)6(H2O)55]3+ and [Cu(H2O)32]2+ in eVa,b
| M | x | third IE | RE | x | second IE | RE | |
|---|---|---|---|---|---|---|---|
| Ru | 18.2 | 28.47c (28.6) | 8.5 | Cu | 16.3 | 20.29c (20.7) | 7.8 |
| Co | 18.0 | 33.5c (34.0) | 8.5 | ||||
| Os | 16.7 | (26.9) | 7.8 | ||||
| Cr | 16.4 | 30.96c (31.9) | 7.6 | ||||
| Ir | 14.2 | (29.2) | 6.6 |
Calculated values are in parentheses.
See Supporting Information for comparisons of calculations to experiment.
From ref 98.
Thermochemical Cycles
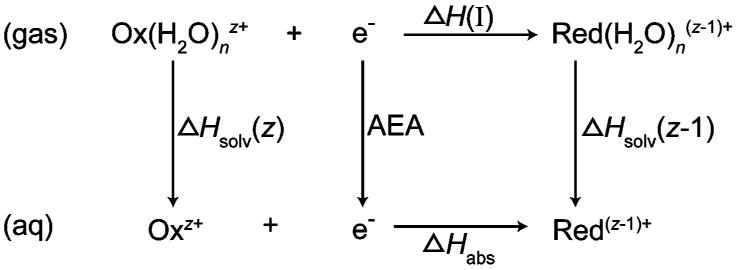
The reduction energies of these gas-phase nanodrops can be related to bulk solution-phase reduction energies by the thermodynamic cycle shown in Scheme 2, where ΔHsolv is the Born enthalpy associated with solvating a droplet with n water molecules and nominal charge z into bulk solution. A modified Born equation (eq 5) is used to obtain the free energy of solvation, ΔGsolv, of the product and reactant charged nanodrops
| (5) |
where ze is the charge, n is the number of water molecules, Rs is the size-exclusion radius of a water molecule, ∊o is the vacuum permittivity, and ∊ is the dielectric constant of the solvent, aam and ai are factors that relate the size of an ammonia molecule and a metal ion, respectively, to that of a water molecule. The differential of the negative of eq 5 with respect to temperature is used to estimate the entropy of solvation (eq 6)
| (6) |
and is combined with the free energy of solvation at 298 K to obtain the enthalpy of solvation at this temperature. The enthalpic AEA is omitted in our subsequent analysis and the solution-phase reduction potentials are referenced to a gas-phase electron. Values of the enthalpic AEA have been reported;35,36,75 the absolute half-cell potential could be referenced to a solvated electron by including this term.
Scheme 2.
The vacuum reference definition is for a gas-phase electron at rest at infinite distance. In these experiments, the electrons can have a range of kinetic energies, but capture of an electron should be most efficient when the relative kinetic energy between an ion and an electron is zero. The relative kinetic energies can be more carefully controlled using merged ion beam techniques employed at storage rings, making possible accurate measurements of capture cross sections as a function of relative kinetic energies.76-80 The cross sections for ion-electron recombination increase rapidly as the center-of-mass kinetic energy between the ion and electron approaches zero. For example, the EC cross section for D+(D2O)2 increases by about 3 orders of magnitude when the center-of-mass kinetic energy decreases from 10−2 to 10−3 eV.79 The dissociative recombination cross section of protonated water increases by about 5 orders of magnitude when the center-of-mass kinetic energies are decreased from 30 to 10−3 eV.80 In our EC experiments, the thermally generated electrons are formed at a potential of −1.4 eV relative to the vacuum chamber ground whereas the charged nanodrops are stored in the cell using a trapping plate potential of +3 V. Although there is excellent spatial overlap between the ions and electrons, the relative velocities can span a relatively wide range. It is probable that the very low EC efficiency observed for the charged nanodrops in this experiment is due to inefficient matching of these relative kinetic energies and that the observed spectra occur from recombination when these relative kinetic energies are near zero (corresponding to the maximum capture cross section). Due to the very high electron currents used in these experiments, electron–electron repulsion is expected to be significant and will result in an even wider range of electron kinetic energies, and this effect may account for electron capture at zero or near zero relative energy.
To determine the effect of the cathode potential on the internal energy deposition upon EC, experiments in which the cathode potential was varied from −1.5 to −2.0 V were performed with [Ca(H2O)15]2+ as the precursor. Upon EC, the reduced precursor loses an H atom and an average of 8.2 ± 0.1 water molecules with no discernible trend over this range of cathode potentials. Under the conditions of these experiments, the EC efficiency decreases significantly at higher and lower cathode potential. Similarly, EC of [Ca(H2O)32]2+ under slightly different experimental conditions as those reported previously50 results in loss of an average of 10.23–10.30 ± 0.05 water molecules over a −1.3 to −1.6 V range of cathode potentials. If an additional 0.3 eV were deposited into [Ca(H2O)32]2+ upon EC, the average number of water molecules lost would increase by 0.8. Thus, there appears to be a negligible effect of cathode potential on the internal energy deposited into the ions, consistent with the presence of low-energy electrons in the cell due to electron–electron repulsion or other effects, and highest electron capture efficiency occurring when the relative ion and electron velocity approaches zero. Further experiments investigating the extent of water loss upon EC as a function of cathode and trap potentials and electron current, extrapolated to zero could potentially lead to more accurate values.
The absolute solution-phase reduction enthalpies are obtained using the Scheme 2 thermodynamic cycle at 298 K (Table 3), where the REs are obtained from the average number of water molecules lost integrated over the appropriate E0 values and the average energy partitioned into the products. The ΔHabs values correspond to temperature corrected absolute reduction enthalpies in solution which may be compared to the corresponding relative values that are easily measured in solution (vide infra).
Table 3.
Differences in Enthalpies for Ion Solvation for the Gaseous Redox Clusters (ΔΔHsolv), Absolute Enthalpies (ΔHabs) and Free Energies (ΔGabs) for Solution-phase Redox Couples Obtained from Gas-phase Nanodrop Measurements, and the Corresponding Relative Solution-phase Values (ΔGrel) at 298 K (all Values in eV).
Solvation Energy Parameters
Although the absolute condensed-phase reduction enthalpies are predominantly derived from the gas-phase nanodrop EC experimental data, the Born energy terms for the precursor and reduced nanodrops are significant factors. The parameters used in this model along with a brief analysis of the uncertainties in these values are described below. The size exclusion radius of water, Rs (1.93 Å) used in the solvation enthalpy calculation, is obtained from bulk density data for liquid water at 298 K (0.9970 g/cm3).70 The density of ice depends upon temperature,81 and at −18 0 °C, the size exclusion radius is calculated to be less than the 0 °C value (1.98 Å) by one-hundredth of an angstrom (1.97 Å). The density of supercooled water at −30 °C (0.9838 g/cm3)82 results in an Rs of 1.94 Å. The size exclusion volumes of water are consistent with the experimentally obtained Rs value of 1.95 Å from photoelectron spectroscopy of hydrated electron clusters.83 Varying Rs over this range (1.93–1.98 Å) results in a difference in ΔHabs of less than 0.1 eV for all species.
Evidence from photodestruction spectroscopy of hydrated electron clusters, [(H2O)n]−, indicate that the radii of the excited-state complexes can be different than those in the ground state.84 In our experiments, the RE is a measure of the difference between the reactant and product clusters for the isothermal EC pathway (Scheme 1), and excited-state effects on the cluster radii are not expected to contribute significant uncertainty to the calculated solvation energies.
The solvation energy depends upon the dielectric constant, ∊, of the solvent, which is a function of temperature. Between 0 and 30 K, the dielectric constant is estimated to be 3.1, but it rapidly increases to a value of ∼275 at 50 K.85 The permittivity gradually decreases to 91.5 at 273 K.85,86 The 298 K values are more physically relevant and these are insensitive to the value of the dielectric constant. The ∊ at 298 K is 78.4;87 values of 70 or 90 result in essentially the same ΔHabs.
The solvation entropy term is small (∼0.1 eV) and depends upon the same factors as the solvation free energy, but also Əln ∊/ƏT. The natural log of the dielectric constants used to obtain this parameter (−0.337 K−1) are linear over a large temperature range (10–70 °C). The dielectric contstants at these temperatures are known to four significant digits; because the entropy term is a minor correction and the dielectric constant of water over these temperatures are well-known, any uncertainty associated with this solvation entropy analysis is expected to be minor as well.
The volume factors of the metal ions, ai, are very small relative to the size of the solvent molecules (n + 6aam ≫ ai) and do not contribute significantly to the solvation and surface energies. The volume factor aam is estimated to be 1.04, obtained from the density of solid ammonia (0.834 g/cm3),88 and does not appreciably affect the surface or solvation energies when compared to treating ammonia molecules as water molecules for estimating the radii of these clusters.
Free Energies
To relate an absolute enthalpy to an absolute Gibbs free energy value, the absolute entropy, ΔSabs, for the solution-phase redox reaction is required. This may be obtained from electrochemical measurements using a nonisothermal cell apparatus in which the potential of a redox reaction is measured at varying temperatures referenced to another half-cell at a constant temperature.89-92 Weaver and co-workers investigated the absolute entropy for various redox couples as a function of metal ion identity, oxidation state, and ligand substitution.89-92 The ΔSabs for the [Ru(NH3)6]3+/2+ (19 cal/mol·K) and [Os(NH3)6]3+/2+ (18 cal/mol·K) couples were determined and compared to other redox couples with varying degrees of chelating ligand substitution.89 In general, ΔSabs values decrease as the numbers and “stiffness” of chelating ligands are increased. This and other evidence93 suggests that ΔSabs for redox couples depend primarily on the coordinated ligands and on the oxidation states rather than upon the metal ion identity. The ΔSabs value for all the [M(NH3)6]3+/2+ species were approximated from the data for M = Ru and Os (18.5 cal/mol·K).
Another method to obtain ΔSabs is by measuring the isothermal temperature coefficient (ƏE0/ƏT) of a redox reaction by varying the temperature of both half-cells in concert. Nonisothermal (or absolute) temperature coefficients are obtained by adding the nonisothermal temperature coefficient of the SHE (+0.871 mV/K),94 a value deduced from experimental data and thermodynamic assumptions, to the isothermal temperature coefficient and converting to an absolute entropy, ΔSabs = nF(ƏE0/ƏT). Brastch has compiled isothermal temperature coefficient data (both measured and calculated) for 26 aqueous 3+ to 2+ reduction reactions for metal ions without chelating ligands other than water.93 These values do not depend strongly on ion identity but do depend on the oxidation states of the reactant and products. Twelve of the 26 aqueous 3+ to 2+ reduction reactions tabulated have isothermal temperature coefficients of 1.6 mV/K (ΔSabs corresponds to 55.0 cal/mol·K), the lowest is 1.1 mV/K (ΔSabs corresponds to 45.5 cal/mol·K) and the highest is 1.8 mV/K (ΔSabs corresponds to 61.6 cal/mol·K). The higher values for bare metal ions than for [M(NH3)6]3+/2+ are consistent with a strong interaction between the metal ion and the ammonia ligands in the latter complex. For the Cu2+/1+ couple, a ΔSabs = 21.77 cal/mol·K, obtained from the measured isothermal temperature coefficient (+0.073 mV/K),94 is used.
It should be noted that the entropies of octahedrally complexed Co(III) to Co(II) transitions in solution are an exception to the general observation that metal ion identity does not significantly influence ΔSabs.90,91 The entropy for [Co(NH3)6]3+/2+ has not been previously reported. However, the ΔSabs values for [Co(bpy)3]3+/2+ and [Co(en)3]3+/2+ are roughly 20 cal/mol·K higher than those of [Cr(bpy)3]3+/2+ and [Ru(en)3]3+/2+,91,92 respectively. This suggests that we may be significantly underestimating this value for [Co(NH3)6]3+/2+.
By combining this entropy data with the enthalpies obtained from Scheme 2 at 298 K, the absolute Gibbs free energy of each species is determined. These values, as well as the relative solution-phase values,63,64,89,95,96 are given in Table 3. The absolute Gibbs free energy values are related to a potential via the Faraday constant relation, ΔG = −nFE0.
Absolute Standard Hydrogen Electrode Potential
The absolute 298 K Gibbs free energies derived from the gas-phase nanodrop data for each of the redox couples, are plotted against the corresponding solution-phase relative potentials (SHE = 0 V) from the literature (Figure 5). These data are fit to a line with a slope of 1.4, a y-intercept of −4.2 eV or +4.2 V, and an R2 of 0.97. The y-intercept corresponds to the absolute SHE potential versus a free electron. The standard deviation for the absolute SHE value, derived from the scatter about the linear regression best fit line of the Figure 5 data, is ±0.1 V. The uncertainty in the final value of the absolute SHE, including contributions from any systematic error, is more difficult to accurately assess. The major contribution to this uncertainty is the values for E0 used to obtain the energy deposition from the number of water molecules lost. Binding enthalpies calculated using the Thomson liquid drop model for some nonaqueous hydrogen bonding solvents61 are systematically low and the same may be true for water. Klots proposed a method for calculating stepwise binding energies of water to neutral clusters using a calculated value for the water heat of vaporization at 0 K (11.2 kcal/mol) combined with a surface energy term.60 Using this model, the stepwise E0 values range from 9.6 to 9.8 kcal/mol for n = 43–61. If these values are used in our method, the corresponding Figure 5 best fit line has a slope of 1.7, y-intercept of 4.9 V, and R2 of 0.90 (see Figure 2 in Supporting Information). We expect that the Thomson liquid drop model, which explicitly includes effects of charge and uses a well-known bulk heat of vaporization of water, is more accurate.
Figure 5.
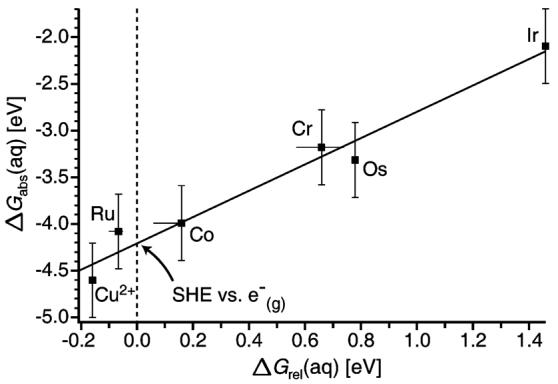
Absolute solution-phase ΔG values for the [M(NH3)6]3+/2+, M = Ru, Co, Os, Cr, and Ir, and Cu2+/1+, couples obtained from gas-phase nanodrop measurements versus the corresponding relative solution-phase values. The solid line is a linear regression fit with a slope of 1.4 and y-intercept of −4.2 eV or +4.2 V. The y-axis (dashed line) intercept corresponds to the absolute SHE versus a free electron. Error bars reflect a select range of reported solution-phase values and estimates of the uncertainty in the gas-phase measurements.
Another source of uncertainty is the modeling of the energy partitioned into the products. The slope of the Figure 5 data suggests that there is a systematic deviation between the gas- phase cluster results and those in solution. Interestingly, if the “slow internal energy conversion” limit model is used, the slope of the corresponding Figure 5 plot is 1.1 and the y-intercept is +3.3 V (see Figure 3 in Supporting Information). Although this limit is almost certainly not physically meaningful, it does indicate that any water molecule loss that occurs prior to full energy conversion of the RE into internal modes of the cluster lowers the slope and decreases the value of the absolute SHE. Modeling the water molecule loss and the energy transfer processes would improve the accuracy of this method.
It is also possible that the Born energy correction may be insufficient to fully account for the solvation energies of these nanodrops, although the data for [Cu(H2O)32]2+ follows the trend established by the [M(NH3)6(H2O)55]3+ cluster data. The solution-phase redox potentials were measured under different conditions (with the exception of M = Co and Ir). For reactions that do not have a well-defined reverse oxidation wave (M = Co, Cr and Ir), there is greater uncertainty in the solution values. These solution-phase redox couples may be measured as a function of ionic strength and extrapolated to infinite dilution,97 providing values that are more directly comparable to our measurements. Further experiments are ongoing to make possible better comparisons under more similar conditions between measured half-cell potentials of these species. A line with a slope of 1.05 can be fit within the error bars of all the Figure 5 data and this line has a y-intercept of −4.0 eV. Additional measurement of both gas-phase and solution-phase values should provide a better indication if there is a systematic deviation. The reported uncertainty reflects uncertainties in obtaining RE values from the experimental data, not uncertainties in other parameters. In sum, we estimate the uncertainty in the absolute value of the SHE to be about ±10% or 4.2 ± 0.4 V.
Conclusions
Recombination energies resulting from EC by extensively hydrated ions in the gas phase can be obtained using nanocalorimetry and related to solution-phase reduction potentials, thus providing a route to an absolute electrochemical scale. The absolute values obtained using this method are referenced to a free electron in the gas phase but could just as easily be referenced to an aqueous electron by including the adiabatic electron affinity of water. There are several important differences between these measurements and those done in bulk solution. In these gas-phase experiments, EC occurs with a single solvated ion without other ions or counterions present. In addition, there are no boundary layers or junction potentials, nor effects associated with metal electrodes in these gas-phase experiments.
The range obtained for the absolute SHE versus a free electron from this method (4.2 ± 0.4 V) brackets many previously reported estimates of this value.2-4 It is challenging to accurately assess the uncertainty in the absolute value of the SHE obtained using this method, and this uncertainty is significantly larger than the accuracy with which relative potentials can be measured. We have attempted to provide rough estimates of uncertainties in many of the parameters that contribute to the final value but a more complete analysis is required. The accuracy of this method could be improved by establishing more accurate values for the threshold dissociation energies of water molecules as a function of cluster size and charge. Accurate experimental measurements of binding enthalpies for much larger clusters than have been measured previously could significantly improve the confidence in the absolute SHE value. Modeling of the internal energy conversion and water molecule loss process could lead to an improved estimate of the energy that is partitioned into products.
An alternative approach to improving the accuracy is to perform EC experiments on much larger clusters. Fewer water molecules are lost for larger clusters due to increased ion solvation and lower RE values. This would reduce the uncertainty originating from both the water molecule binding energy and the Born solvation energy terms. Competitive energy loss via radiative emission limits the ultimate cluster size that can be investigated using this method. A more accurate value for the absolute SHE may also be obtainable by extrapolating size dependent cluster data measured over a finite range to infinite size, which would eliminate the Born solvation energy term used in the current method.
Uncertainties in the reported solution-phase reduction potentials obtained from the literature and measured under different conditions, as well as the limited stability of some of the reduced species, likely contribute significantly to the overall uncertainty in our reported value. Measurements of these values under controlled conditions are ongoing, as are measurements of additional redox couples. By carefully controlling experimental conditions and investigating each step in this method, we anticipate that the uncertainty in the value for the SHE obtained using this method can be reduced to below 0.1 V. This uncertainty may ultimately be limited by our understanding of ion solvation at long range and experiments on size-selected nanodrops may provide important new information that can be used to improve solvation models. Although not yet achieved, a value for the SHE obtained by this method with an uncertainty of less than 0.1 V, would be much more valuable than using an arbitrary value of exactly zero for the SHE and should be sufficient to establish an absolute electrochemical scale that bridges solution and gas-phase ionization/reduction energies and potentials.
Acknowledgment
We thank Peter B. Armentrout, John I. Brauman, David Chandler, Phillip L. Geissler, Marcin Majda, Richard M. Mathies, Daniel M. Neumark, James S. Prell, Kenneth N. Raymond, and Richard J. Saykally for helpful discussions, Jamie H. Cate for graciously donating the Ir(NH3)6-Cl3 used in this study, and Robert G. Bergman for the use of a Parr bomb to synthesize Os(NH3)6I3. We also thank NSF (CHE-0718790) and NIH (R01 GM064712–05) for generous financial support.
Footnotes
Supporting Information Available: Comparison of calculated ionization energies to literature values and figures. This material is available free of charge via the Internet at http://pubs.acs.org.
References
- 1.Reiss H. J. Electrochem. Soc. 1988;135:247C–258C. [Google Scholar]
- 2.Trasatti S. Pure App. Chem. 1986;58:955–966. [Google Scholar]
- 3.Reiss H, Heller A. J. Phys. Chem. 1985;89:4207–4213. [Google Scholar]
- 4.Parsons R. In: Standard Potentials in Aqueous Solution. Bard AJ, Parsons R, Jordan J, editors. Marcel Dekker; New York: 1985. pp. 13–37. [Google Scholar]
- 5.Gomer R, Tryson G. J. Chem. Phys. 1977;66:4413–4424. [Google Scholar]
- 6.Hansen WN, Kolb DM. J. Electroanal. Chem. 1979;100:493–500. [Google Scholar]
- 7.Hansen WN, Hansen GJ. Phys. Rev. A. 1987;36:1396–1402. doi: 10.1103/physreva.36.1396. [DOI] [PubMed] [Google Scholar]
- 8.Trasatti S. Electrochim. Acta. 1990;35:269–271. [Google Scholar]
- 9.Trasatti S. Electrochim. Acta. 1991;36:1659–1667. [Google Scholar]
- 10.Gerischer H, Ekardt W. Appl. Phys. Lett. 1983;43:393–395. [Google Scholar]
- 11.Trasatti S. J. Electroanal. Chem. 1982;139:1–13. [Google Scholar]
- 12.Trasatti S. J. Electroanal. Chem. 1974;52:313–329. [Google Scholar]
- 13.Trasatti S. J. Chem. Soc., Faraday Trans. 1. 1974;70:1752–1768. [Google Scholar]
- 14.Gileadi E, Stoner G. J. Electroanal. Chem. 1972;36:492–494. [Google Scholar]
- 15.Bockris JO. Energy Convers. 1970;10:41–43. [Google Scholar]
- 16.Bockris JO, Argade SD. J. Chem. Phys. 1968;49:5133–5134. [Google Scholar]
- 17.Bard AJ, Faulkner LR. Electrochemical Methods: Fundamentals and Applications. 2nd ed. Wiley; New York: 2001. p. 63. [Google Scholar]
- 18.Laser D, Bard AJ. J. Electrochem. Soc. 1976;123:1833–1837. [Google Scholar]
- 19.Chang KC, Heller A, Schwartz B, Menezes S, Miller B. Science. 1977;196:1097–1099. doi: 10.1126/science.196.4294.1097. [DOI] [PubMed] [Google Scholar]
- 20.Uudsemaa M, Tamm T. J. Phys. Chem. A. 2003;107:9997–10003. [Google Scholar]
- 21.Li J, Fisher CL, Chen JL, Bashford D, Noodleman L. Inorg. Chem. 1996;35:4694–4702. [Google Scholar]
- 22.Tsushima S, Wahlgren U, Grenthe I. J. Phys. Chem. A. 2006;110:9175–9182. doi: 10.1021/jp062295u. [DOI] [PubMed] [Google Scholar]
- 23.Torres RA, Lovell T, Noodleman L, Case DA. J. Am. Chem. Soc. 2003;125:1923–1936. doi: 10.1021/ja0211104. [DOI] [PubMed] [Google Scholar]
- 24.Mouesca JM, Chen JL, Noodleman L, Bashford D, Case DA. J. Am. Chem. Soc. 1994;116:11898–11914. [Google Scholar]
- 25.Baik MH, Schauer CK, Ziegler T. J. Am. Chem. Soc. 2002;124:11167–11181. doi: 10.1021/ja016905+. [DOI] [PubMed] [Google Scholar]
- 26.Baik MH, Ziegler T, Schauer CK. J. Am. Chem. Soc. 2000;122:9143–9154. [Google Scholar]
- 27.Wheeler RA. J. Am. Chem. Soc. 1994;116:11048–11051. [Google Scholar]
- 28.Konecny R, Li J, Fisher CL, Dillet V, Bashford D, Noodleman L. Inorg. Chem. 1999;38:940–950. doi: 10.1021/ic980730w. [DOI] [PubMed] [Google Scholar]
- 29.Li J, Fisher CL, Konecny R, Bashford D, Noodleman L. Inorg. Chem. 1999;38:929–939. doi: 10.1021/ic980731o. [DOI] [PubMed] [Google Scholar]
- 30.Li J, Nelson MR, Peng CY, Bashford D, Noodleman L. J. Phys. Chem. A. 1998;102:6311–6324. [Google Scholar]
- 31.Winget P, Weber EJ, Cramer CJ, Truhlar DG. Phys. Chem. Chem. Phys. 2000;2:1231–1239. [Google Scholar]
- 32.Kettle LJ, Bates SP, Mount AR. Phys. Chem. Chem. Phys. 2000;2:195–201. [Google Scholar]
- 33.Reynolds CA. Int. J. Quant. Chem. 1995;56:677–687. [Google Scholar]
- 34.Raymond KS, Grafton AK, Wheeler RA. J. Phys. Chem. B. 1997;101:623–631. [Google Scholar]
- 35.Jortner J, Noyes RM. J. Phys. Chem. 1966;70:770–774. [Google Scholar]
- 36.Hart EJ, Anbar M. The Hydrated Electron. Wiley-Interscience; New York: 1970. p. 63. [Google Scholar]
- 37.Coe JV. Int. Rev. Phys. Chem. 2001;20:33–58. [Google Scholar]
- 38.Tissandier MD, Cowen KA, Feng WY, Gundlach E, Cohen MH, Earhart AD, Coe JV, Tuttle TR. J. Phys. Chem. A. 1998;102:7787–7794. [Google Scholar]
- 39.Asthagiri D, Pratt LR, Ashbaugh HS. J. Chem. Phys. 2003;119:2702–2707. [Google Scholar]
- 40.Tomasi J, Persico M. Chem. Rev. 1994;94:2027–2094. [Google Scholar]
- 41.Cramer CJ, Truhlar DG. Chem. Rev. 1999;99:2161–2200. doi: 10.1021/cr960149m. [DOI] [PubMed] [Google Scholar]
- 42.Parker VD. J. Am. Chem. Soc. 1976;98:98–103. [Google Scholar]
- 43.Wentworth WE, Chen E. J. Phys. Chem. 1967;71:1929–1931. [Google Scholar]
- 44.Pysh ES, Yang NC. J. Am. Chem. Soc. 1963;85:2124–2130. [Google Scholar]
- 45.Howell JO, Goncalves JM, Amatore C, Klasinc L, Wightman RM, Kochi JK. J. Am. Chem. Soc. 1984;106:3968–3976. [Google Scholar]
- 46.Masnovi JM, Seddon EA, Kochi JK. Can. J. Chem. 1984;62:2552–2559. [Google Scholar]
- 47.Aynetchi S, Hitchcock PB, Seddon EA, Seddon KR, Yousif YZ, Zora JA, Stuckey K. Inorg. Chim. Acta. 1986;113:L7–L9. [Google Scholar]
- 48.Peover ME. Nature. 1962;193:475–476. [Google Scholar]
- 49.Leib RD, Donald WA, O'Brien JT, Bush MF, Williams ER. J. Am. Chem. Soc. 2007;129:7716–7717. doi: 10.1021/ja067794n. [DOI] [PMC free article] [PubMed] [Google Scholar]
- 50.Leib RD, Donald WA, Bush MF, O'Brien JT, Williams ER. J. Am. Chem. Soc. 2007;129:4894–4895. doi: 10.1021/ja0666607. [DOI] [PMC free article] [PubMed] [Google Scholar]
- 51.Leib RD, Donald WA, Bush MF, O'Brien JT, Williams ER. J. Am. Soc. Mass Spectrom. 2007;18:1217–1231. doi: 10.1016/j.jasms.2007.03.033. [DOI] [PMC free article] [PubMed] [Google Scholar]
- 52.Wong RL, Paech K, Williams ER. Int. J. Mass Spectrom. 2004;232:59–66. [Google Scholar]
- 53.Bush MF, Saykally RJ, Williams ER. Int. J. Mass Spectrom. 2006;253:256–262. doi: 10.1016/j.ijms.2006.04.009. [DOI] [PMC free article] [PubMed] [Google Scholar]
- 54.Brown DR, Pavlis RR. J. Chem. Ed. 1985;62:807–808. [Google Scholar]
- 55.Bottomley F, Tong S-B. Inorg. Chem. 1974;13:243–244. [Google Scholar]
- 56.Shi Z, Ford JV, Wei S, Castleman AW. J. Chem. Phys. 1993;99:8009–8015. [Google Scholar]
- 57.Peschke M, Blades AT, Kebarle P. J. Phys. Chem. A. 1998;102:9978–9985. [Google Scholar]
- 58.Reinhard BM, Niedner-Schatteburg G. J. Chem. Phys. 2003;118:3571–3582. [Google Scholar]
- 59.McLafferty FW, Wachs T, Lifshitz C, Innorta G, Irving P. J. Am. Chem. Soc. 1970;92:6867–6880. [Google Scholar]
- 60.Klots CE. J. Chem. Phys. 1985;83:5854–5860. [Google Scholar]
- 61.Holland PM, Castleman AW. J. Phys. Chem. 1982;86:4181–4188. [Google Scholar]
- 62.Lim HS, Barclay DJ, Anson FC. Inorg. Chem. 1972;11:1460–1466. [Google Scholar]
- 63.Gulens J, Page JA. J. Electroanal. Chem. 1976;67:215–230. [Google Scholar]
- 64.Curtis NJ, Lawrance GA, Sargeson AM. Aus. J. Chem. 1983;36:1327–1339. [Google Scholar]
- 65.Tanaka N, Yamada A, Tamamushi R. Bull. Chem. Soc. Jpn. 1964;37:1821–1826. [Google Scholar]
- 66.Fecko CJ, Loparo JJ, Roberts ST, Tokmakoff A. J. Chem. Phys. 2005;122:1–18. doi: 10.1063/1.1839179. [DOI] [PubMed] [Google Scholar]
- 67.Ohmine I, Tanaka H. Chem. Rev. 1993;93:2545–2566. [Google Scholar]
- 68.Fecko CJ, Eaves JD, Loparo JJ, Tokmakoff A, Geissler PL. Science. 2003;301:1698–1702. doi: 10.1126/science.1087251. [DOI] [PubMed] [Google Scholar]
- 69.Džidić I, Kebarle P. J. Phys. Chem. 1970;74:1466–1474. [Google Scholar]
- 70.Marsh KN. Recommended Reference Materials for the Realization of Physiochemical Properties. Oxford; Blackwell: 1987. p. 27. [Google Scholar]
- 71.Arnold ST, Morris RA, Viggiano AA, Johnson MA. J. Phys. Chem. 1996;100:2900–2906. [Google Scholar]
- 72.Dekrey MJ, Kenttaämaa HI, Wysocki VH, Cooks RG. Org. Mass Spectrom. 1986;21:193–195. [Google Scholar]
- 73.Baer T, Hase WL. Unimolecular Reaction Dynamics: Theory and Experiments. Oxford University Press; New York: 1996. pp. 328–334. [Google Scholar]
- 74.Klots CE. Z. Phys. D: At., Mol. Clusters. 1991;20:105–109. The parameters used in this calculation are A = 2.7 × 10¹⁵ s −1, B = 6 cal/mol·K, and E0 = 10 kcal/mol. [Google Scholar]
- 75.Han P, Bartels DM. J. Phys. Chem. 1990;94:7294–7299. [Google Scholar]
- 76.Adams NG, Poterya V, Babcock LM. Mass Spectrom. Rev. 2006;25:798–828. doi: 10.1002/mas.20084. [DOI] [PubMed] [Google Scholar]
- 77.Al-Khalili A, Thomas R, Ehlerding A, Hellberg F, Geppert WD, Zhaunerchyk V, Uggerud E, Vedde J, Adlhart C, Semaniak J, Kaminńska M, Zubarev RA, Kjeldsen F, Andersson PU, Österdahl F, Bednarska VA, Paál A. J. Chem. Phys. 2004;121:5700–5708. doi: 10.1063/1.1782772. [DOI] [PubMed] [Google Scholar]
- 78.Zhaunerchyk V, Ehlerding A, Geppert WD, Hellberg F, Thomas RD, Larsson M, Viggiano AA, Arnold ST, Österdahl F, Hlavenka P. J. Chem. Phys. 2004;121:10483–10488. doi: 10.1063/1.1812532. [DOI] [PubMed] [Google Scholar]
- 79.Någård MB, Pettersson JBC, Derkatch AM, Al Khalili A, Neau A, Rosén S, Larsson M, Semaniak J, Danared H, Källberg A, Österdahl F, Af, Ugglas M. J. Chem. Phys. 2002;117:5264–5270. [Google Scholar]
- 80.Neau A, Al Khalili A, Rosén S, Le Padellec A, Derkatch AM, Shi W, Vikor L, Larsson M, Semaniak J, Thomas R, Någård MB, Andersson K, Danared H, Af Ugglas M. J. Chem. Phys. 2000;113:1762–1770. doi: 10.1039/a909314a. [DOI] [PubMed] [Google Scholar]
- 81.Eisenberg D, Kauzmann W. The Structure and Properties of Water. Oxford University Press; Oxford: 1969. p. 104. [Google Scholar]
- 82.Hare DE, Sorensen CM. J. Chem. Phys. 1987;87:4840–4845. [Google Scholar]
- 83.Coe JV, Lee GH, Eaton JG, Arnold ST, Sarkas HW, Bowen KH, Ludewigt C, Haberland H, Worsnop DR. J. Chem. Phys. 1990;92:3980–3982. [Google Scholar]
- 84.Ayotte P, Johnson MA. J. Chem. Phys. 1997;106:811–814. [Google Scholar]
- 85.Barkema GT, Boer J. J. Chem. Phys. 1993;99:2059–2067. [Google Scholar]
- 86.Hobbs ME, Jhon MS, Eyring H. Proc. Nat. Acad. Sci. U.S.A. 1966;56:31–38. doi: 10.1073/pnas.56.1.31. [DOI] [PMC free article] [PubMed] [Google Scholar]
- 87.Archer DG, Wang PM. J. Phys. Chem. Ref. Data. 1990;19:371–411. [Google Scholar]
- 88.Olovsson I, Templeton DH. Acta Cryst. 1959;12:832–836. [Google Scholar]
- 89.Yee EL, Cave RJ, Guyer KL, Tyma PD, Weaver MJ. J. Am. Chem. Soc. 1979;101:1131–1137. [Google Scholar]
- 90.Sahami S, Weaver MJ. J. Electroanal. Chem. 1981;122:171–181. [Google Scholar]
- 91.Sahami S, Weaver MJ. J. Electroanal. Chem. 1981;122:155–170. [Google Scholar]
- 92.Yee EL, Weaver MJ. Inorg. Chem. 1980;19:1077–1079. [Google Scholar]
- 93.Bratsch SG. J. Phys. Chem. Ref. Data. 1989;18:1–21. [Google Scholar]
- 94.deBethune AJ, Licht TS, Swendeman N. J. Electrochem. Soc. 1959;106:616–625. [Google Scholar]
- 95.Weaver MJ, Tyma PD, Nettles SM. J. Electroanal. Chem. 1980;114:53–72. [Google Scholar]
- 96.Bard AJ, Faulkner LR. Electrochemical Methods: Fundamentals and Applications. 2nd ed. Wiley; New York: 2001. p. 808. [Google Scholar]
- 97.Meyer TJ, Taube H. Inorg. Chem. 1968;7:2369–2379. [Google Scholar]
- 98.Lide DR, editor. CRC Handbook of Chemistry and Physics, Internet Version. 87th ed. Taylor and Francis; Boca Raton, FL: 2007. pp. 10202–10203. [Google Scholar]