

Summary
Lymphocyte microvilli mediate initial adhesion to endothelium during lymphocyte transition from blood into tissue but their molecular organization is incompletely understood. We modified a shear-based procedure to prepare biochemical fractions enriched for membrane/microvilli (MMV) from both human peripheral blood T-lymphocytes (PBT) and a mouse pre-B lymphocyte line (300.19). Enrichment of proteins in MMV relative to post nuclear lysate was determined by LC/MS/MS analysis and label-free quantitation. Subsequent analysis emphasized the 291 proteins shared by PBT and 300.19 and estimated by MS peak area to be highest abundance. Validity of the label-free quantitation was confirmed by many internal consistencies and by comparison with Western blot analyses. The MMV fraction was enriched primarily for subsets of cytoskeletal proteins, transmembrane proteins and G-proteins, with similar patterns in both lymphoid cell types. The most enriched cytoskeletal proteins were microfilament-related proteins NHERF1, Ezrin/Radixin/Moesin (ERMs), ADF/cofilin and Myosin1G. Other microfilament proteins such as talin, gelsolin, myosin II and profilin were markedly reduced in MMV, as were intermediate filament- and microtubule-related proteins. Heterotrimeric G-proteins and some small G-proteins (especially Ras and Rap1) were enriched in the MMV preparation. Two notable general observations also emerged. There was less overlap between the two cells in their transmembrane proteins than in other classes of proteins, consistent with a special role of plasma membrane proteins in differentiation. Second, unstimulated primary T-lymphocytes have an unusually high concentration of actin and other microfilament related proteins, consistent with the singular role of actin-mediated motility in the immunological surveillance performed by these primary cells.
Lymphocyte microvilli initiate adhesion to endothelium during movement from blood into tissue. Using LC/MS/MS and label-free quantitation, we identify proteins enriched in membrane/microvilli (MMV) fractions from lymphocytes (primary human T-lymphocytes and mouse pre-B lymphocyte line). The cytoskeletal proteins most enriched in both lymphocyte types are microfilament-related proteins NHERF1, Ezrin/Radixin/Moesin (ERMs), ADF/cofilin and Myosin1G. Heterotrimeric G-proteins and some small G-proteins (especially Ras and Rap1) are also enriched. Complementary approaches provide confirmation.
Keywords: lymphocyte, microvillus, proteome, LC-MS/MS, label-free quantitation, cytoskeleton, small-GTP-binding protein, Myo1G, NHERF1, cofilin
Introduction
Incessant migration of lymphocytes is essential to immune system function, since the antigens they must recognize are dispersed throughout many tissues in the body 1–3. An essential part of their migration is passive transport of lymphocytes in peripheral blood followed by lymphocyte binding to vascular endothelium to enter diverse tissues. Lymphocytes and other hematopoietic cells have many microvilli on their cell surfaces which are critical for their efficient binding to vascular endothelium 4–9. One notable feature of those microvilli is the enhanced localization of selectins on the microvilli which facilitates the efficient binding of selectins to endothelial ligands during initiation of adhesion 6, 7. Moreover, microvilli may undergo complex alterations as they participate in the tethering process 10. Therefore, it is important to elucidate their molecular architecture. The best studied microvilli are those from epithelial cells in organs such as intestine 11, kidney 12, 13, inner ear 14 or placenta 15. Such microvilli are peripheral processes consisting of a central actin bundle and associated regulatory proteins. ERM proteins (Ezrin/Radixin/Moesin) are the protein family most consistently associated with microvilli, which are thought to participate in their genesis. One route to finding molecules that are likely to be functionally important in lymphocyte microvilli is to identify molecules enriched there. Understanding of microvilli on other cell types has been greatly enhanced by identification of proteins enriched in them 11, 15, 16, such as the multifunctional PDZ-domain protein NHERF1/EBP50 17, 18, which binds both to the tails of transmembrane (TM) proteins and to ERM proteins.
Advances in mass spectrometry (MS) have made it the method of choice for protein identification in biological samples. However, when biochemical fractionation can provide only partial enrichment of an organelle, identification of a protein by MS in that fraction does not provide sufficient evidence for localization in the organelle. For that purpose, estimation of enrichment in the fraction can be quite powerful, as demonstrated for example by recent organelle mapping of proteins by Mann and colleagues 19. Software has recently been developed to facilitate label free quantitation which relies on direct comparison of peptide peak areas between LC-MS runs 20–24.
We have undertaken characterization of proteins in lymphoid cell microvilli by developing a shear-based approach to enrich for lymphocyte microvilli in a membrane/microvillus fraction (MMV). That fraction was then analyzed by LC/MS/MS, exploiting the power of label-free quantitation to estimate enrichment of proteins in the MMV fraction relative to post-nuclear lysate (PNL). Primary human T-lymphocytes (PBT) are the most biologically relevant sample but are limited in availability. Therefore, methodology was developed using the mouse pre-B cell line 300.19, because it resembles in many ways the architecture of primary lymphoid cells (spherical, non-polarized, covered with normal-appearing microvilli) and has been extensively studied in models of lymphocyte dynamic adhesion 25, 26. Comparing those MS results with subsequent MS analysis of PBT demonstrated both the validity of the label-free quantitation and revealed many consistencies between these two lymphoid samples. A marked enrichment of a subset of actin-associated proteins, small G-proteins and plasma membrane proteins in the MMV preparation in both cell types was observed. Despite many similarities, however, there was a marked (~ 4 fold) overall increase in microfilament-associated proteins (but not microtubule-related proteins) in the primary lymphocytes compared with the cultured 300.19 lymphoid line. This highlights the special importance of actin-based cytoskeleton and motility in primary lymphocytes. Furthermore, unlike other classes of proteins, TM molecules highly enriched in the MMV fraction were rarely shared between the two lymphoid cell types, consistent with special evolutionary significance of plasma membrane proteins in cell differentiation.
Experimental Procedures
Cells and reagents
The mouse pre-B cell line 300.19, kindly provided by Geoffrey Kansas (Northwestern University Medical School), was maintained in RPMI 1640 supplemented with 10% FCS 25, 26. Fresh human lymphocytes were isolated from the blood of healthy human volunteers by leukapheresis and either immunomagnetic negative selection (to prepare PBT) or elutriation (to prepare peripheral blood lymphocytes) as previously described 8, 27. The GFP-cofilin and mCherry-CAAX constructs were kindly provided by John Condeelis (Albert Einstein College of Medicine) 28.
The following antibody reagents were used for Western blot (WB) and immunofluorescence staining: Rap1 monoclonal antibody (mAb) (BD Pharmingen); carboxy-phosphorylated ERM (cpERM) mAb pT567 whose reactivity includes moesin pT558, ezrin pT567, and radixin pT564 (BD Pharmingen); rabbit polyclonal antibodies (pAb) raised against human moesin 473–486; and human Myo1G aa 2–14; Myosin IIA pAb (Sigma M8064), beta-actin mAb (Sigma A1978), moesin-specific mAb 38/87 (NeoMarkers), Tubulin mAb(Sigma T6074), Talin mAb(Sigma T3287), Gelsolin mAb (Sigma G4896); Na+/K+-ATPase α1 mAb (Santa Cruz sc-21712) and K-Ras mAb (Santa Cruz sc-30); NHERF1 pAb (Abcam ab3452); Profilin rabbit pAb (CST 3237) and cofilin rabbit pAb (CST, 3312); Hsp60 mAb (Stressgen SPA-806); CD3 epsilon rabbit mAb (Epitomics1774-1); CD44 rabbit mAb (Epitomics1998-1); MHC-I rabbit mAb (Epitomics1913-1); LFA-1a rabbit mAb (Epitomics1904-1); EEA1 mAb(Transduction Laboratories E411201); Lamp2 mAb(Developmental Studies Hybridoma Bank H4B4); Catalase rabbit pAb (CalBiochem 219010); Calnexin rabbit pAb(F36) was kindly provided by Paul A. Roche (NCI, Bethesda, MD)
Isolation of Microvilli, Separation of proteins, in-gel trypsin digestion, and extraction of peptides
Isolation of the MMV fraction was developed based on previously described methods in epithelial cells 29–31 (Fig 1). Fresh PBT (1 × 10⁹ cells) or log phase 300.19 B-cells (1 × 10⁹ cells) were washed twice with Phosphate Buffered Saline (PBS, pH 7.4), suspended in PBS containing 20 % FCS (to stabilize microvilli as described in 29) and incubated for 15 min at 37°C. Cells were drawn gently (5–6 times) through a 27G1/2 needle to shear off the microvilli. Sheared cell mixtures were centrifuged at 2500 × g for 5 min. The pellets (intact cells, > 95% viable based on Trypan blue staining) were washed four times with PBS to remove contaminating FCS proteins. Supernatants were further centrifuged at 16,060 × g for 40 min. followed by two washes of the pelleted material (membrane/microvillus fraction, MMV) by centrifugation at 16,060 × g for 15 min. The MMV and intact cells were lysed with a Triton X-100 containing buffer (1% TritonX-100, 50 mM of Tris·Cl, pH7.4, 150 mM of NaCl plus protease inhibitor cocktail tablets (Roche), and phosphatase inhibitor calyculin A 50 nM). A post-nuclear lysate (PNL) fraction was prepared by recovery of the supernatant after centrifugation at 16,060 × g for 10 min to remove nuclei. Protein concentrations of MMV and PNL fractions were measured with Bio-Rad protein assay kit (Bio-Rad).
Equal amounts of protein (25 μg) from MMV and PNL were loaded onto 4–12% SDS-NuPAGE gels (Invitrogen). After electrophoresis the gel was stained with Coomassie blue solution (Bio-Rad), subsequently de-stained thoroughly, and gel images were scanned either with a Storm densitometer (Molecular Dynamics, Sunnyvale, CA) at wavelength 700nm or on an Odyssey Infrared Imaging System (LI-COR). Protein band quantification was performed using Odyssey Application Software v2. For preparing in-gel trypsin digested peptides, the de-stained gel was washed with ion-free water three times, and sliced horizontally into 16–18 slices. Each slice was diced into tiny pieces (1–2 mm3) and placed into 1.5 ml pre-lubricated centrifuge tubes (PGC Scientifics, Frederick). Proteins in the gel were treated with DTT for reduction, then iodoacetamide for alkylation, and further digested by trypsin in 25 mM NH4HCO3 solution. The digested protein was extracted as described 32. The extracted peptides were dried and reconstituted in 0.1% formic acid before performing nanospray LC/MS/MS analysis.
Nanospray LC/MS/MS analysis and database search
LC/MS/MS analyses were carried out using a ThermoFinnigan LTQ linear ion trap mass spectrometer (San Jose, CA) as described previously 20. Briefly, peptides extracted from the gel were loaded onto a peptide trap cartridge (Agilent, Palo Alto, CA) at a flow rate of 4 μL/min. The trapped peptides were eluted onto a reversed-phase PicoFrit column (New Objective, Woburn, MA) using a linear gradient of acetonitrile (0–60%) in 0.1% formic acid. The elution duration was 75 min at a flow rate of 0.25 μl/min. Eluted peptides from the PicoFrit column were ionized and sprayed into the mass spectrometer, using a nano-spray ion source, under the following settings: spray voltage, 1.8 kV, temperature of ion transfer tube, 160°C; and normalized collision energy, 35%. Other settings were empirically determined. Raw data files were searched against the NCBI Refseq protein sequence databases (human, mouse, and bovine as of 3/1/2006) using BioWorks 3.1 software (ThermoFinnigan, San Jose, CA) based on the SEQUEST algorithm. The identified peptide sequences were initially qualified and filtered using the following thresholds: 1) the cross-correlation scores (Xcorr) of matches were rank first and greater than 1.5, 2.0, and 2.5 for charge state +1, +2, and +3 peptide ions, respectively, 2) the uniqueness scores of matches (delta Cn) were higher than 0.08, and 3) the ranks of the preliminary scores (Rsp) were less than 10. Using these criteria the false discovery rates for peptide identification, estimated from reverse database searches, were less than 5%. Only genes identified by at least two peptides were further analyzed.
Assigning genes/proteins
We observed limitations in BioWorks’ assignments of peptides to genes when the peptide is present in multiple genes (as is often true with paralogs). We therefore reassigned peptides to NCBI Refseq genes using the following algorithm for moving genes from “provisional” status to “included” or “deleted” status. 1) Links were made between every peptide and every gene in which an NCBI reference sequence contained that peptide. A peptide was considered a “unique peptide” if it mapped to a single gene. 2) Any gene linked to a unique peptide was moved from provisional status to “included” gene and its peptides were considered “assigned”. Other genes were deleted if all of their associated peptide were already “assigned”. 3) Each remaining provisional gene was evaluated in descending sequential order of unassigned peptides linked to it. At each step, the gene with the most unassigned peptides was “included” and others discarded if they no longer had unassigned peptides. If two genes had identical numbers of unassigned peptides the gene with the smaller NCBI gene id was chosen (because it is usually the best characterized historically). We then assigned a specific protein sequence for this gene (i.e. GI number) by choosing the longest NCBI reference protein sequence corresponding to that gene that included all the peptides. Because FCS had been present in the MMV isolation, we analyzed the MS results against the bovine database and excluded proteins with greater hits from bovine than human sequences (e.g. BSA and hemoglobin).
Proteins were classified into one of seven different groups: TM, GTP-binding protein (including both “small” and “large” hetero-trimeric G proteins); cytoskeletal, nuclear, ribosomal, mitochondrial, and cytosolic. Group assignment was based on a combination of: 1) Gene Ontology annotation, 2) TMHMM Server predicting TM regions 33 and 3) manual review of Entrez gene annotation and additional literature review where annotation was incomplete or inconsistent. The categories TM, GTP-binding protein and cytoskeletal were assigned first. Other genes that could be unambiguously assigned to nuclear, ribosomal or mitochondrial were then assigned. The remaining genes were considered cytosolic.
Peak Quantitation
Peak quantitation of the MS data was performed using QUOIL (QUantification withOut Isotope Labeling) which determines peak areas from pseudo-chromatograms (i.e. MS1 area integrated over time) 20. It then matches corresponding peptide peaks in the MMV and PNL fractions and from them calculates a MMV to PNL ratio. The ratio for a gene/protein was determined by combining the ratio for all corresponding peptides, using the median value of all peaks (or the average of the two middle ones if the number of peaks is even). (See supporting Fig 1 for simple validation by measuring actin ratios between gels loaded with different amounts of cell lysate) Preliminary analysis of the data confirmed that quantitation was more accurate for abundant proteins (presumably due both the large number of peptides being quantitated and the easier discrimination of peaks from background). Therefore, analysis emphasized the 250 most abundant proteins in each fraction, where abundance was roughly estimated by total peak area of the corresponding peptides. This approach selected 300 human genes in the human set (SetHu) from a union of the top 250 in MMV and top 250 in PNL fractions of PBT. Similarly 296 genes in the “mouse set”( SetMo) were selected from the top 250 in MMV and in PNL from 300.19. From these sets, a “shared set”(SetHuMo) of 291 genes was selected, consisting of proteins: 1) selected in SetHu and its murine homolog detected by at least two peptides in the 300.19 fractions or 2) vice versa (i.e. selected in SetMo and its human homolog detected by at least two peptides in the PBT fractions). For determination of SetHuMo, the homologs between mouse and human genes were assigned based on highest BLAST scores of corresponding proteins. Because the class of TM molecules had limited sharing between the two cell lines, an additional inclusion criterion was used for this class. A TM molecule from SetHu and SetMo was included if it was identified by at least four peptides in a single cell type (rather than at least two peptides each in both cell types).
When a single identified peptide is shared between multiple identified genes/proteins, it is impossible to know from which of them the identified peptide was derived. That ambiguity was handled as follows. For calculation of MMV/PNL ratio of a gene, we include that peptide’s ratio in the median calculation for each of those genes. For calculation of peak area contributed by a gene, we apportioned its peak area to the genes in proportion to the number of unique peptides identified for that gene (so that peak area would not be “double counted” in determining totals for a group of genes). For calculations of % total peak area for a given category of proteins (Fig 4), the total peak for a category was the sum of the peak areas for every peptide corresponding to every protein in that category. The denominator was the total peak area from every peptide identified in the fraction by MS. Similarly, for comparisons of peak area of protein X between PNL of PBT and 300.19 (Fig 5), the ratio was determined by [PeakArea(X) PNL-PBT/PeakArea(Total) PNL-PBT]/[PeakArea(X) PNL-300.19/PeakArea(Total)PNL-300.19].
WB, immunofluorescence and transfection
For WB analysis equal amounts of protein (10 μg) from each preparation were resolved by 4–12% SDS-NuPAGE gels, transferred to nitrocellullose membranes, and analyzed by WB with antibodies listed above using enhanced chemiluminescence (ECL; Amersham, Piscataway, NJ) or an Odyssey Infrared Imaging System (LI-COR Biosciences). For immunofluorescence analysis, PBT and 300.19 cells at 2 × 10⁶ cells were dropped onto the glass bottom of 35 mm MatTek cultureware dishes (MatTek, Ashland, MA) pre-coated with Poly-L-Lysine(Sigma, St Louis, MO). Cells were allowed to settle for 10 min at room temperature (RT) and cells fixed by the addition of ice-cold 4% paraformaldehyde solution (Sigma). After 10 min at room temperature (RT), samples were washed with PBS, permeabilized with 0.2% Triton X-100, and blocked for 1 hr at RT in PBS with 3% BSA. Primary antibodies were added for 1 hr at RT in PBS with 3% BSA. After washing, Alexa 546-conjugated, or/and Alexa 488-conjugated secondary antibodies (Molecular Probes) in PBS with 3% BSA were added for 1 hr at RT. Actin was stained using Alex 546-conjugated Phalloidin (Molecular Probes). Nuclear staining was performed using 30 nM diamidino-2-phenylindole (DAPI). Samples were examined using a Zeiss LSM510 laser scanning confocal microscope using a 63 × or 100 × objective (Carl Zeiss). Cortical F-actin for a cell was quantitated (Fig 6) by drawing a line at the perimeter and calculating average fluorescence of all pixels along that line; the value for a cell type was determined as the average of six randomly selected cells of that type. For transfection analyis, GFP-cofilin and mCherry-CAAX constructs were transfected into 300.19 B cells by electroporation (BTX ECM 830). After 24 hrs of transfection, the cells were washed with fresh medium and incubated with Hoechst blue dye (Molecular Probes) for 30 minutes at 37° for nuclear staining. Immunofluorescence analysis of these cells was carried out as described above.
Sample preparation for EM
MMV fractions from Fresh PBT and 300.19 B-cells were prepared as described above. The first MMV pellet (without wash) was immediately fixed with 2% glutaraldehyde in cacodylate buffer (0.1M cacodylic acid, pH7.4). TEM was performed as described 34, 35.
Results
Preparation and characterization of MMV and PNL fractions from lymphoid cells
We developed a method for enrichment of a MMV fraction from lymphoid cells using a shear-based procedure (Fig 1) modeled after procedures for preparing placental microvilli from syncytiotrophoblasts 29–31. We optimized the procedure using the cell line 300.19, which is a mouse-pre-B lymphocyte line that has been used in many labs as an informative cell line for functional and biochemical studies of lymphoid microvilli 9, 25, 26, 36. The shear conditions chosen did not maximize removal of microvilli but rather were chosen to maintain cell viability greater than 95% after shearing, thereby minimizing contamination from material released by damaged cells. The resulting fraction designated MMV contained about 1% of the protein present in the PNL. Transmission EM analysis of the sheared fractions demonstrated abundant vesicular elements consistent with microvilli (Fig 2A, B). Some elements were unambiguously identifiable as microvilli because the section included a complete longitudinal section of the microvillus (large black arrowheads in Fig 2A, B and another at higher magnification Fig 2C). Microvillus shafts in such sections were 60–100 nm in diameter; striations within were often visible suggesting actin filaments. Those microvilli often included at one end a bulbous structure 200–500nm in diameter, constituent with the rootlet of the microvillus (large white arrowhead). Some rootlets were completely filled with protein-like material while others were partially empty at the center. Most of the other vesicular elements observed were consistent with sections through the shaft of microvilli (small black arrowheads) and through rootlets (large white arrowhead). Some larger membrane vesicles are also observed.
Figure 1. Procedure for purification of microvillus-enriched fraction from lymphoid cells.

Cells are passed through a 27.5 gauge needle four times to shear peripheral processes from the cell surface but leave viable cells. Sheared particulate material is separated from intact cells by low speed centrifugation (2,500 × g). That material, collected by high speed centrifugation (16,000 × g), washed with PBS and lysed becomes the MMV fraction. Cells that have been subject to shearing are washed, lysed in a Triton X-100-containing buffer and the nuclei removed by centrifugation to create the postnuclear lysate (PNL) fraction. Protein concentration of each lysate is measured. Equal amounts (20–50 μg) of each fraction are loaded onto two separate 4–12% SDS-NuPAGE gradient gels, and the proteins are separated by electrophoresis. The gels are analyzed by WB or Coomassie blue staining then sliced prior to trypsin digestion and LC/MS/MS analysis.
Figure 2. Characterization of the MMV fractions.

Transmission electron microscopy of MMV fraction from (A) PBT; (B) 300.19 and (C) higher magnification view of particularly informative microvillus from MMV fraction from PBT. In EM images, large black arrowhead indicates longitudinal sections of microvilli, small black arrowhead indicates transverse sections through shaft of microvilli and large white arrowheads indicates section through rootlet of microvillus. (D) Coomassie blue-stained gels of fractions from 300.19 cells. Equal amounts of protein were loaded from the MMV and PNL fractions. Solid arrows highlight a few bands enriched in MMV and white arrows highlight others partially depleted in MMV. (E) WB of the same samples for moesin and actin.
Coomassie blue staining after an SDS-PAGE provided an overall assessment of the MMV and PNL fractions (Fig 2D). Visual inspection revealed not only overall similarity between the positions of the bands in each fraction, but also differences, some of which are highlighted by arrows. A single band at about 44 kd, inferred to be actin, was prominently increased in the MMV fraction. Actin and ERM proteins are two intracellular proteins known to be enriched in lymphocyte microvilli 8, 37. Consequently, the relative amounts of these two proteins in the fractions was assessed by WB (Fig 2E). The MMV fraction was markedly enriched for both proteins, indicating enrichment of microvilli in the MMV fraction.
Category-based analysis of the gene products identified in PBT and 300.19
Proteomic profiling of MMV and PNL fractions from 300.19 was performed by cutting gels such as those shown in Fig2D into slices, followed by in-gel trypsin digestion and analysis by LC/MS/MS. Similar fractions were prepared from freshly isolated PBT and analyzed. Protein products of 654 genes were identified by two or more peptides in the analysis of PBT and 1116 were identified by two or more peptides in the analysis of pre-B cell 300.19. Our studies were designed not only for the identification of proteins present in MMV but to identify proteins which are enriched in the MMV fraction. For determination of enrichment, we utilized a label-free quantitation approach that integrates peptide ion intensities in the LC/MS/MS analyses using the recently described QUOIL software 20. Preliminary analysis indicated that quantitation was most robust when peptides peaks were above the minimal level required for identification. Therefore, the sets chosen for analysis were the roughly 300 proteins estimated to be most abundant, as follows. The set of human genes/proteins analyzed (SetHu) consisted of the genes encoding the most abundant 250 proteins (determined by integrated peptide ion peak intensity) in MMV from PBT or PNL from PBT; this comprised 300 genes. (SetHu is increased by 50 since 50 proteins were non-overlapping in abundant MMV and abundant PNL.) The set of mouse genes/proteins analyzed (SetMo) consisted of 296 genes chosen in an identical fashion from MMV and PNL from 300.19 pre-B cells. The identified proteins were classified into one of seven different groups: TM, GTP-binding protein (including small and hetero-trimeric G proteins); cytoskeletal, nuclear, ribosomal, mitochondrial, and cytosolic.
A general overall understanding of the composition of MMV and PNL was provided by aggregate analysis of SetHu and SetMo (Fig 3, panel A). The category with the greatest number of genes is cytoplasmic, encompassing about 35% of the total (~90 proteins). Most of the categories of proteins are similarly represented in PBT and 300.19 but ribosomal proteins are clearly over-represented in 300.19 and cytoskeletal proteins are modestly over-represented in PBT.
Figure 3. Aggregate analysis by gene category of the human gene set in PBT and the mouse gene set in 300.19.
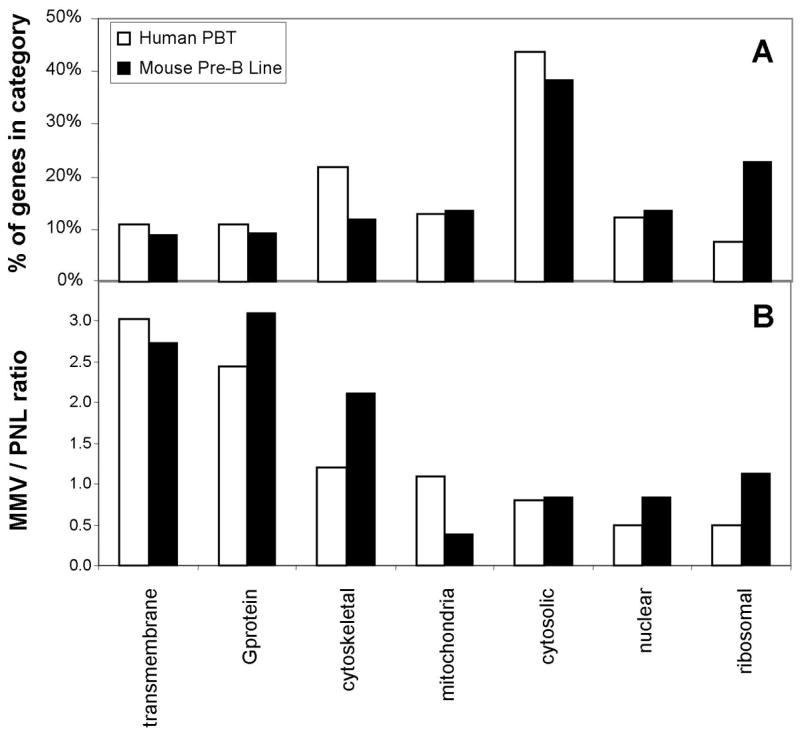
Genes were classified into seven categories. A) Analysis of % of genes in each category. B) Analysis of median enrichment of each category of protein in MMV relative to PNL. Open bars represent the analysis of the SetHu from human PBT. Closed bars represent the analysis of the SetMo from murine 300.19 pre-B cell line.
We anticipated that the MMV fraction would be enriched for three classes of proteins, TM, GTP-binding and cytoskeletal. This prediction was tested by analyzing classes of proteins for their relative enrichment in the MMV fraction compared to PNL (Fig 3, panel B). The ratio for a category is represented by the median ratio for all proteins in that category. The ratio for a protein is calculated as the median of the ratio values of its peptides determined by QUOIL. The “typical” protein will have a ratio of about 1.0 due to the normalization algorithm in QUOIL. Four of the seven classes had ratios less than 1.0 (cytosolic, mitochondrial, ribosomal and nuclear). Conversely, two classes of proteins showed strong enrichment in MMV: TM and GTP-binding proteins. A third class of proteins, cytoskeletal, was also enriched in MMV, but not as strongly.
It is also informative to roughly estimate the relative abundance of different classes of proteins from peptide peak areas (i.e. MS1 signal integrated over time) of all proteins in that class (Figure 4). Two of the seven categories of proteins dominate in abundance: cytoskeletal and cytosolic. Consider first the comparison between MMV and PNL fractions for a given cell type. A striking increase in overall cytoskeletal proteins was evident in the 300.19 MMV fraction compared to PNL, a major component of which was an increase in actin (inset). This increase in actin estimated by this analysis is consistent with the increase observed by Coomassie and WB (Fig 2). In PBT, there was also an increase in cytoskeleton abundance in MMV, but the increase was modest compared to 300.19.
Figure 4. Estimate of relative abundance of different classes of protein in the MMV and PNL fraction of the two lymphoid cell types.

For each fraction of the four fractions (MMV and PNL from PBT and from 300.19), the integrated peak area (MS1 signal integrated over time) was determined for all proteins in each category as described in Experimental Procedures. This provides a very rough estimate of the relative contribution of different categories of molecules to total protein in each fraction. Inset shows the integrated peak area for actin isoforms in each fraction.
A second striking pattern revealed by the abundance analysis (Fig 4) is that the PBT fractions each contain a much greater proportion of cytoskeletal proteins than their 300.19 counterpart (e.g. comparing PNL, 27% cytoskeleton for PBT vs 11% cytoskeleton for 300.19). Actin peptide abundance estimated in the same way shows a similar pattern, with much higher proportions in PBT than in 300.19 (e.g. comparing PNL, 11% in PBT vs 3% in 300.19). Coomassie blue staining is a different way to estimate relative abundance of actin between PBT and 300.19. Such analysis of PNL fractions shows the percent of total cytosolic protein which is actin is 5% in 300.19 but 11% in PBT (Fig 5A), which supports the conclusion of enrichment made from MS peak area. In order to better understand the nature of the increase in cytoskeletal proteins in PBT, the relative abundance of individual cytoskeletal proteins was compared between PBT and 300.19 based on peak area (Fig 5B). The analysis indicates that, as a class, they are almost all of greater abundance (geometric mean 3.7 fold) in PNL in PBT relative to 300.19. In contrast, tubulin-related proteins are somewhat less abundant in PBT relative to 300.19 (~ 0.5 fold).
Figure 5. Enrichment of actin and actin-binding proteins in PBT compared with 300.19.

A) Coomassie blue staining of SDS-PAGE gels loaded with 25ug of PNL from either PBT or 300.19. B) Integrated peak area for cytoskeletal proteins was compared between PBT and 300.19 as described in Experimental Procedures. For simplicity as well as robustness, peak areas from paralogs have been pooled and the number of genes pooled has been indicated. C) Greater density of F-actin in PBT compared to 300.19 cells as assessed by phalloidin staining. Cell samples were mixed then stained to achieve identical staining conditions. Left panel is a mid-place optical section; insets show representative subregions of cortex at 4 × higher effective magnification. Right panel is a maximum intensity projection of three-dimensional stacks. The microvilli are so fragile that it is extremely difficult to preserve the entire microvilli but the punctate staining on the insets and projections indicates the remaining proximal region/base.
Finally, vimentin and its binding partner plectin are dramatically more abundant in PBT than in 300.19, which is consistent with the finding of very much lower expression of vimentin in primary lymphocytes in mouse than in human 38. Thus, PBT have a markedly greater abundance of an ensemble of actin-related cytoskeletal proteins than the 300.19 mouse pre-B cell line. This increased % abundance of actin in PBT was paralleled by an increased F-actin density by phalloidin staining (Fig 5C). Quantitation of the intensity of F-actin staining demonstrated a ratio between PBT and 300.19 of 2.51 ± 0.68 fold.
Analysis of molecules shared between mouse and human microvilli
We sought an understanding of common features of lymphoid microvilli by identifying gene products enriched in both the mouse and human MMV. To do so, we combined SetHu and SetMo into a SetHuMo of 291 proteins identified by at least two peptides in both mouse and human cells (see Experimental Procedures). During that comparison a surprising difference between categories of molecules became evident in the frequency with which they were identified in human PBT vs the mouse pre-B cell line (Fig 6A), which we refer to as “overlap”. For most categories of molecules, there was 75–80% overlap in molecular identification between the two cells (i.e. most individual molecules identified by two peptides in the SetHu were also identified by two peptides in the mouse line and vice versa). In contrast, amongst TM molecules only 20% overlapped. We considered the possibility that low peptide number (due for example to low abundance or suboptimal tryptic digestion of TM proteins) might contribute to the discrepancy; consequently, we reanalyzed the data including only the 208 proteins with 10 or more peptides in one of the two cell types. Even with that threshold, there was a highly significant difference between TM proteins and the non-TM proteins (p < 0.01) (Fig 6B). Only 44% (8 of 18) TM proteins overlapped between the samples while 77% of the non-TM molecules did. Moreover, the non-shared TM proteins had higher average peptide number than the shared TM proteins, confirming that the analysis was not biased against their detection. Thus, TM molecules have less overlap between the two cells analyzed than do non-TM molecules.
Figure 6. Notably low overlap of TM molecules between PBT and 300.19.

A) The proteins in the SetHu were analyzed to determine which orthologous proteins were identified by 2 or more peptides in the mouse 300.19 and vice versa. The percentage of such overlapping genes was determined for each category. B) Similar analysis was performed, but restricting the analysis to proteins identified by 10 or more peptides in at least one cell type. The difference between TM and non-TM was significant (p < 0.01) by Chi-square analysis.
Analysis of individual molecules
We began our analysis of individual molecules in SetHuMo by comparing their enrichment in the mouse MMV to enrichment in human MMV (Fig 7). Strikingly, most proteins strongly enriched in mouse MMV were also strongly enriched in human MMV. This pattern can be assessed statistically by subdividing the proteins into 4 groups according to whether or not they are enriched in mouse or human MMV using a chosen threshold MMV/PNL ratio such as 2.0 (Fig 7B) or 2.5 (Fig 7C). Most proteins were either enriched in both or neither (p < 0.001 for thresholds of 2.0 or 2.5 by chi-squared analysis). This correlation provides confirmation that the quantitation is substantially reproducible and that major components of the MMV are similar between the two cell types. Two classes of molecules are notable for their dominance in the upper 3/4 of the distribution: cytoskeletal (red) and GTP-binding (green).
Figure 7. Enrichment of individual molecules in MMV of PBT vs 300.19.

A) Each molecule in SetHuMo is plotted to show its MMV/PNL ratio in 300.19 (x-axis) and in PBT (y-axis). Each class of molecules is represented by a different symbol (see inset figure legend). A dashed line highlights the diagonal. The horizontal and vertical dashed lines represents conservative cutoffs set at a ratio of 2.
B) and C) Tabulations of the 291 proteins shown in panel A according to their MMV/PNL ratio in mouse and human cells. Panel B uses a cutoff MMV/PNL ratio of 2.0 and Panel C uses a ratio of 2.5. p values for both comparisons are < 0.001 by chi-squared analysis.
Because of the substantial similarity in MMV/PNL ratio between the mouse and human cells, analysis can be strengthened and simplified by calculating the average MMV/PNL for PBT and 300.19. The average MMV/PNL ratios for all proteins of each category are shown in Figure 8. All instances of mitochondria, nuclear and ribosomal proteins fall below a conservative cutoff at a ratio of 2. Less than 5% of cytosolic proteins (black) fall above that cutoff. In contrast, more that 30% of cytoskeletal (red) and 50% of GTP-binding (green) proteins exceed that cutoff. Because of the issue of low overlap between mouse and human lymphoid cells, TM proteins (blue squares) are treated as a special case. In addition to the usual criteria for inclusion (at least two peptides each in both cell types), a TM molecule from SetHu and SetMo was also included if it was identified by at least four peptides in a single cell type. Two thirds of those TM proteins exceed that cutoff (Fig 8). But most of those with MMV/PNL ratio > 2 (20 of 22) were NOT shared between mouse and human. All of those MMV-enriched TM proteins are plasma membrane proteins (except one whose localization was previously unstudied)(see Fig 12). Thus, among proteins overlapping between a mouse pre-B lymphocyte and human primary T-cells, cytoskeletal and GTP-binding proteins are the dominant ones enriched in the MMV fraction.
Figure 8. Analysis of distribution of MMV/PNL ratios amongst molecules in each category.

For each molecule in SetHuMo, a combined MMV to PNL ratio was calculated by averaging the values for PBT and for 300.19. Values for all molecules in a category were spread along the x-axis in ascending order by MMV/PNL ratio. For TM molecules, in addition to the usual criteria for inclusion (at least two peptides each in both cell types), a TM molecule from SetHu and SetMo was also included if it was identified by at least four peptides in a single cell type. The horizontal dashed line represents a conservative cutoff set at a ratio of 2.
Figure 12. Distribution of MMV/PNL ratios for trans-membrane proteins.

Membrane proteins in the SetHuMo are shown by descending MMV/PNL ratio, except for three whose localization is uncertain from the literature which are placed at the end. As noted in Fig 8, for TM molecules, in addition to the usual criteria for inclusion (at least two peptides each in both cell types), a TM molecule from SetHu and SetMo was also included if it was identified by at least four peptides in a single cell type. The symbols (triangle or square) represent the values for mouse 300.19 and human PBT respectively. The bar length represents the combined MMV/PNL ratio if the protein was identified in both cell types. Gene ID refers to the NCBI unique identifier for the human gene for which lookup can be performed at http://www.ncbi.nlm.nih.gov/sites/entrez?db=gene
Cytoskeletal proteins and GTP-binding proteins are enriched in MMV
Detailed analysis of cytoskeletal proteins (Fig 9) reveals distinct behaviors of proteins grouped according to the three cytoskeletal systems: microfilament, intermediate filament, and microtubules. None of the few microtubule-related proteins are enriched in MMV. Similarly, the lymphocyte intermediate filament vimentin and the vimentin-associated linker protein plectin are not enriched in MMV. However, there is great heterogeneity in ratio among the actin-associated proteins. Some are markedly enriched in MMV in both mouse and human, while some are clearly not enriched. The proteins most enriched in MMV are actin, the PDZ-domain containing ERM-binding protein NHERF1, the actin-severing proteins cofilin and ADF, and the class I myosin Myo1G. Some notable actin-binding proteins that are clearly not enriched include gelsolin, profilin, class II myosin, and talin.
Figure 9. Distribution of MMV/PNL ratios for cytoskeletal proteins.

Cytoskeletal proteins in the SetHuMo are shown, organized by microfilament type, and by descending MMV/PNL ratio within each filament type. The bar length represents the combined MMV/PNL ratio, while the symbols (triangle or square) represent the values for mouse 300.19 and human PBT respectively. The filled circles on the left mark the five components of the Arp2/3 complex in the SetHuMo. Gene ID refers to the NCBI unique identifier for the human gene for which lookup can be performed at http://www.ncbi.nlm.nih.gov/sites/entrez?db=gene
WB validation of the MS estimates was performed using human PBT rather than 300.19, since that is the cell population whose physiological relevance is certain (and since species differences limited usefulness of some antibodies on 300.19). First we confirmed by WB the authenticity of the MMV and PNL preps (Fig 10A). Markers of all six well-defined intracellular compartments were enriched in the PNL rather than MMV, while the plasma membrane marker was markedly enriched in MMV. Next we tested some of the notable cytoskeleton-related proteins. All of the microfilament-related proteins determined to be most enriched by MS were confirmed by WB to be enriched in MMV in PBT (Fig 10). The apparent fold enrichment by WB varied from that estimated by the MS label-free quantitation, as might be expected given the various limits to quantitation in both systems (see discussion). We assessed WB for cpERM in addition to moesin. Consistently the degree of enrichment for cpERM was substantially greater than that for total moesin (Fig 10B) or for ezrin (data not shown). This raises the possibility that some of the enrichment detected by MS may be affected not only by protein abundance but also by its state of post-translational modification (see discussion). WB validation of the some of the notable non-enriched proteins such as profilin and gelsolin confirmed the pattern observed by MS (Fig 10B).
Figure 10. WB and immunofluorescence validation of MS analysis for key molecules in PBT.

A, B) MMV and PNL fractions from PBT were isolated, resolved by gel electrophoresis and blotted with antibodies of indicated specificity. Panel A shows WB for classical markers of plasma membrane (Na/K-ATPase) and intracellular compartments (EEA1 for early endosomes, Hsp60 for mitochondria, Lamp2 for lysosomes, calnexin for ER and catalase for peroxisomes). Panel B shows notable actin-related proteins, GTP-binding proteins and TM proteins. C) Immunofluorescence analysis of PBT. First column cpERM (red); second column NHERF1, Rap1, profilin or CD44 (green); third column, overlay including DAPI counterstain (blue) highlighting the nucleus; fourth column, 4x higher magnification of boxed region in third column, in which arrows indicate (partial) preservation of microvilli that are clearly stained by NHERF1 and Rap1 but at most minimally by profilin. D) Live cell and fixed cell fluorescent images were taken from 300.19 B cells transfected with GFP-cofilin and mCherry-CAAX (as plasma membrane marker) and stained with Hoechst blue to highlight the nucleus. Lower right panel in each set is 4x higher magnification and arrow highlights base of microvillus or intact microvillus.
We chose NHERF1 and cofilin as the cytoskeletal-related proteins to test for microvillus localization by fluorescence microscopy because of their high enrichment in the MMV fraction and the rich biological literature on these proteins. Staining for cpERM is currently the best way to visualize PBT microvilli by confocal microscopy (8)(Fig 10C). Most PBT microvilli are below the threshold for clear discrimination by fluorescence microscopy and are only appreciated as puncta of cpERM. Although lymphocyte microvilli are fragile, partially preserved microvilli are sufficiently long to appreciate projection of cpERM outside the cell body. Two-color fluorescence microscopy showed almost complete colocalization of NHERF1 with cpERM (Fig 10C). In the visible microvilli NHERF1 staining is strong and NHERF1’s punctate staining elsewhere in cortex is classical for microvilli. Immunofluorescent localization of cofilin was technically unsatisfactory, so instead we analyzed cofilin localization by transfection of 300.19 cells with GFP-cofilin. The results show clear enrichment at cortex and in microvilli (Fig 10D), thus confirming that cofilin is enriched in lymphocyte membrane/microvilli. We next analyzed immunofluorescence localization of profilin which MS and WB results indicated was depleted from the MMV preparation. Microscopy confirms its generalized cytosolic distribution and depletion in microvilli evident from lack of colocalization with cpERM puncta (Fig 10C).
GTP-binding proteins are the other category of overlapping proteins that showed frequent enrichment in MMV. Among GTP-binding proteins, the heterotrimeric proteins showed the highest enrichment (Fig 11). This is not surprising since their primary role is as transducers of signals from GPCR. Since Ras/Rap proteins play more diverse roles in multiple compartments within cells, it is notable that four members of the Ras/Rap family of small-G-proteins were also all quite enriched. These findings were assessed by WB for K-ras and Rap1 which confirmed marked enrichment (Fig 10). Immunofluorescence analysis of Rap1 illustrates its strong colocalization with cpERM (Fig 10C). At the other extreme Ran, which regulates nuclear transport, was clearly depleted in MMV. Three other families, Rho, Rab and Arf were quite heterogeneous. WB for RhoA and cdc42 confirmed that they were not clearly enriched in MMV (Fig 10).
Figure 11. Distribution of MMV/PNL ratios for GTP-binding proteins.

G-proteins in the SetHuMo are shown by descending MMV/PNL ratio. The bar length represents the combined MMV/PNL ratio, while the symbols (triangle or square) represent the values for mouse 300.19 and human PBT respectively. Gene ID refers to the NCBI unique identifier for the human gene for which lookup can be performed at http://www.ncbi.nlm.nih.gov/sites/entrez?db=gene
Analysis of TM proteins provides compelling evidence that the label-free quantitative approach we have used accurately distinguished between plasma membrane proteins and those in intracellular compartments (Fig 12). Most of the TM proteins that met the inclusion criteria (30 of 33) had been sufficiently well studied to categorize them as either plasma membrane or intracellular. Of these 30, all plasma membrane proteins have MMV/PNL ratios greater than 2.0 while all that are intracellular have ratios less than 1.6. Of these intracellular proteins, the one with the highest ratio (IRAP, ratio 1.5) has mixed plasma membrane and vesicular localization. This categorization is highly significant (p < 10−7, Fisher’s exact test). These data strongly support the view: 1) that plasma membrane is enriched in the MMV preparation and 2) that a threshold ratio of MMV/PNL greater than 2.0 correctly classifies proteins enriched in the MMV fraction. Validation by WB is shown (Fig 10B) for five of the plasma membrane proteins for which good WB antibodies were available. Immunofluorescence analysis of CD44, for example, illustrates its strong colocalization with cpERM (Fig 10C). Few of the plasma membrane proteins identified overlap between human PBT and mouse 300.19 (3 of 21) but the majority of intracellular plasma membrane proteins do (7 of 9). This highly significant difference (p < 0.002, Fisher’s exact test) indicates that the non-overlap TM proteins between human PBT and mouse 300.19 (Fig. 6) is characteristic of plasma membrane proteins rather than intracellular TM proteins. The potential significance of individual enriched TM proteins is discussed below.
Discussion
The present analysis was undertaken to elucidate the major components of lymphocyte microvilli using: 1) a shear-based procedure to prepare a microvillus-enriched fraction; 2) LC/MS/MS to identify proteins in that fraction; and 3) label-free quantitation to elucidate which proteins are enriched in this fraction compared to PNL. The results validate the usefulness of this combination of approaches, and provide new insights not only about microvillus proteins but also led to two more general conclusions. Our data indicate that plasma membrane proteins are uniquely divergent (relative to other classes of protein) between human primary T-cells and a mouse pre-B lymphocyte line. The present data also indicate that, as a class, microfilament-related proteins are several-fold more abundant in fresh primary human lymphocyte than in a mouse pre-B cell line.
Although protein identification per se is the way MS is most commonly used in cell biological studies, protein quantitation was essential for the present study. When biochemical fractionations are imperfect, analysis of enrichment can be very powerful to extract clear information, as illustrated by the elegant organelle studies of Mann and co-workers 19 and the commentary on it 39. Nevertheless, a problem with its over-identification of contaminants as Golgi components was suggested by subsequent work 40. In order to minimize such problems, we chose conservative criteria, restricting our analysis: 1) to proteins identified by at least 2 peptides each in the PBT sample and the 300.19 samples; and 2) to the 300 most abundant proteins (which therefore provides better peak height of peptide pseudochromatograms). Our MMV/PNL ratio was determined from a median of 15 peptides and a minimum of 4 peptides in contrast to the studies of Mann and co-workers 19 where the Golgi protein assignment critiqued by Gilchrist 40 was based on a median of only 3.2 peptides and a minimum of 1 peptide. Most likely because of our conservative criteria for analysis the label-free quantitation method used here provides remarkably clear and consistent information, There are multiple lines of evidence which support the quality of the quantitative estimates from QUOIL. First there are fundamental consistencies between groups of molecules illustrated by: 1) The global similarities between mouse and human in median ratios of groups of molecules (Fig 3B); and 2) the global differences in abundance between PBT and 300.19 between microfilament, microtubule and intermediate filament-related molecules (Fig 5). More strikingly, the values for individual molecules are quite coherent and plausible. For example, the combined mouse/human ratios for ALL 112 molecules in the nuclear, ribosomal and mitochondrial categories all fall below 1.5 (Fig 8). Similarly there is a good correlation between MMV/PNL ratios of molecules from two distinct cells types (Fig 7). Also, there is generally good consistency in estimates between molecules in molecular complexes with fixed stoichiometry (such as the 5 components of the Arp2/3 complex, Fig 9). Furthermore, WB studies performed on selected molecules validated the enrichment (Fig 10). Finally, our approaches to categorization of membrane proteins into plasma membrane vs intracellular shows extraordinary concordance with known localization of the proteins identified (p < 10−7, Fisher’s exact test, Fig 12). In short, many compelling criteria authenticate the overall validity of the MMV fractionation and the label-free quantitation.
Although highly informative, the results of label-free quantitation do not correlate precisely with WB, a widely used alternative method of estimation of abundance (Fig 9 vs Fig 10). This is particularly notable for NHERF1 which is the cytoskeleton-related protein most enriched in MMV by MS (Fig 9) but is only modestly increased (~ 1.5 ×) by WB (Fig 10B). We note four elements which likely contribute to imperfect correlation. First, robustness of the QUOIL estimates increases as the number of identified peptides increase. The results for NHERF1, for example, should be robust since its marked increase was seen both in PBT by ten peptides and in 300.19 by six peptides. Second, QUOIL normalizes so that the median MMV/PNL ratio equals 1.0, assuming similar complexity (ie diversity of peptides) in both fractions. But since we find that there is lower complexity of the MMV fractions (for example in PBT the number of peptides identified divided by the total peak area is 22% lower in MMV than PNL), that normalization may be imperfect and the dividing line between MMV-enriched and non MMV-enriched may be nearer to the QUOIL ratio of 1.5 rather than 1. Third, although WB is usually a good estimator of relative protein quantities, it too is subject to a variety of distortions such as saturation of membrane or detection system. Fourth, differences in post-translational modification can contribute to discrepancies both in WB and in label-free quantitation. For example, phosphomoesin is enriched in MMV compared to total moesin (Fig 10). Such post-translational modification can influence detection by WB (for example inhibiting recognition by some antibodies). Moreover, we anticipate that such differences which profoundly influence protein conformation will also change susceptibility to tryptic cleavage and therefore MS identification of peptides.
Our analysis demonstrates enrichment of distinct subsets of microfilament-associated proteins and GTP-binding proteins in the MMV fraction. We conclude that the proteins enriched in the MMV fraction are those enriched in microvilli based on four general criteria. First, the method of preparation of the fraction is a classical method for enrichment of peripheral processes which must, of biophysical necessity, be most vulnerable to shear-based removal. Second, analysis of the sheared fraction by transmission EM demonstrates it to be a vesicular fraction enriched in elements that are clearly identifiable as microvilli. Note that rootlets of microvilli are observed in the EM analysis and therefore the enriched proteins may be localized in rootlet or in the microvilli (or both). Third, molecules previously known to be enriched in lymphocyte microvilli (actin, ERMs and especially phospho-ERMs) 8 are enriched in the MMV fraction by WB (Fig 2 and Fig 10). Finally, localization of the NHERF1 and Rap1 in microvilli provided proof of principle by direct visualization.
Microvilli are actin-based peripheral processes whose molecular architecture must be strategically organized to have both appropriate mechanical properties to stay erect on the lymphocyte surface and a favorable spatial organization to perform their functions in cell adhesion, signaling as well as probably transport. Only a few proteins, including actin and ERMs, have been previously shown to be enriched in lymphocyte microvilli. Herein we identify two notable new components of lymphocyte microvilli whose presence there is presaged by microvilli of other cell types: NHERF1 and Myo1G. NHERF1 is a PDZ-domain containing protein that acts both as a signal organizing protein (by its two PDZ domains that have many binding partners) and as a structural protein (by bridging between ERM N-terminus and tails of TM proteins). NHERF1 is preferentially localized to microvilli in kidney 17, in intestine and in placenta 18. It plays a particularly important role in renal tubule microvilli where it controls localization and function of the phosphate transporter. Further studies will be needed to determine whether it contributes to ERM localization in lymphocyte microvilli, to regulated localization of other proteins there, or to organization of signaling complexes there. Myo1G is a virtually uncharacterized class I myosin (previously reported to be enriched in high buoyant density detergent-resistant membrane fractions from neutrophils 41). Our finding of Myo1G enrichment in microvilli has conceptual parallels to the localization of two paralogs to microvilli: Myo1A to intestinal microvilli 42 and Myo1C to stereocilia 43. These paralogs are thought to connect the microvillus’ actin bundle (to which they bind by their head domain) with the plasma membrane (to which they bind by their tail domain). More generally, class I myosins in mammalian cells contribute to cell motility 44, to vesicular transport 45 and to regulated localization of TM proteins 46.
Cofilin and ADF are closely-related high abundance protein that have been consistently implicated in actin severing 47, but depending on concentration can also promote nucleation 48. Cofilin plays a critical role in rapid actin remodeling in cells in response to growth factors or chemokines, in part by severing existing actin filaments thereby creating new barbed ends for further actin polymerization. Such cofilin-mediated actin-severing may be important for the microvillus loss as well as for the polarization/migration that occurs when PBT are triggered by chemokine to adhere/migrate 8. Cofilin binds to both monomeric and filamentous actin in a manner that is inhibited both by cofilin phosphorylation and by PIP2 binding. Although PIP2 binding of cofilin has been known for many years 49, visualization of its PIP2-dependent membrane localization has only recently been achieved.28. Our evidence for cofilin enrichment to lymphocyte membrane/microvillus (by mass spectrometry, Western blot and localization of GFP-tagged protein) extends this finding and suggests the possibility the cofilin release during acute activation of lymphocytes may resemble its release by EGF stimulation of carcinoma cells. It should be noted that localization of cofilin depends on the cell type, differentiation state and activation state 47, 50. Previous evidence suggested that cofilin plays complex roles in peripheral processes. Bamburg has recently reviewed evidence implicating cofilin in regulating growth cone filopodia 51. In contrast to our studies in lymphocytes, cofilin in renal microvilli, is normally excluded and ischemia-induced entry of cofilin to those microvilli appears to contribute to microvillar breakdown 52. Cofilin phosphorylation at Ser-3 does not influence its binding to PIP2 47, 53 and our studies identify no clear difference in cofilin phosphorylation between MMV and PNL (data not shown). We also note that AIP1 is modestly enriched in MMV preps (Fig 9 and Fig 10). This may be of significance since AIP1 and cofilin cooperate in actin severing 54, 55.
It is notable that not all actin or PIP2 binding proteins are enriched in the MMV prep. For example, the PIP2 binding proteins gelsolin and profilin are not enriched there. Are those findings real and if so what may be the mechanism? We use profilin I as an example for discussion. Our findings are consistent with reports of multiple cell types and differentiation states in which profilin is not prominently associated with the plasma membrane, such as stationary epithelial cells 56 and fibroblasts 57. In our studies, profilin is not only not enriched in the MMV, but appears relatively depleted there by MS and by imaging (Figs 9,10). For this to occur, profilin must be at least partially “sequestered” by localization elsewhere. The most likely locations for such sequestration are microtubules 58, intracellular membranes 59 and even the nucleus 57.
In addition to the cytoskeletal proteins discussed above, GTP-binding proteins (Fig 11) is a second class of molecules highlighted by the present analysis as being enriched in the MMV preparation. Since the ratio of [plasma membrane area]/[internal volume] is increased in microvilli compared to total cell body, any biochemical fraction enriched in MMV will have an increased concentration of any plasma membrane proteins that are not excluded from microvilli. Thus, a conservative conclusion is that GTP-binding proteins are enriched in the plasma membrane. This is predictable for heterotrimeric G-proteins since they mediate the signaling function of plasma membrane GPCR and are maintained at the plasma membrane by their lipid modification (myristoylation/palmitoylation for the alpha subunit and geranylation for the beta/gamma complex) 60. Enrichment of other small G-proteins at the plasma membrane is not so predictable and such proteins are often found primarily on intracellular membrane compartments including nuclear or ER/Golgi 61–63. This diversity occurs for multiple reasons. Their lipid modification is more complex and diverse – usually geranylation or prenylation but less frequently myristoylation or palmitoylation. In addition, many have mechanisms for sequestration of their lipid modification in GDI proteins or hydrophobic pockets in the small G-protein itself. Finally the presence or absence of other binding motifs such as highly basic regions at the C-terminus strongly influences membrane binding 64. Our studies highlight the enrichment of several Ras-superfamily members in the microvillus-enriched plasma membrane fraction, including particularly Ras and Rap1. Ras is of particular relevance for its role in early signal transduction, including activation of MAPK pathways 63. Rap1 is particularly relevant for integrin regulation 65 which is essential for lymphocyte binding to endothelium.
The third and final category of molecules enriched in the MMV fraction is plasma membrane TM proteins (Fig 12). As noted in the discussion of GTP-binding proteins, the high surface to volume ratio of microvilli dictates that the MMV fraction will be enriched in any plasma membrane protein that is not excluded from microvilli. Thus, at a minimum, the present findings indicate that the plasma membrane proteins we find enriched in the MMV fraction are not excluded from microvilli. Such conservative conclusions are nevertheless useful as illustrated by three of the molecules identified in PBT. Since the MMV fraction is enriched for CD3 epsilon (a component of the T-cell antigen-specific receptor) and LFA-1 (an integrin adhesion molecule involved in T-cell recognition), the data are consistent with the concept that T-cell recognition may be initiated through microvilli 66} Also, CD44 is a complex and important molecule that binds ERM 67 and functions as an adhesion receptor for lymphocyte binding to endothelium by binding hyaluronate 68. The issue of CD44 localization in lymphoid cell microvilli is physiologically relevant and in some lymphoid cells CD44 has been reported to be excluded from microvilli 7; but the present studies show that it is clearly not excluded from PBT microvilli (Fig 10 and Fig 12).
For several of the membrane molecules we find markedly enriched in the MMV fraction, there is literature precedent for preferential localization in microvilli. Although CLICs are not classical TM proteins, we include them in this categorization because they are believed to be conformationally regulated, and to contain amphipathic putative transmembrane helix which can be exposed and mediate membrane insertion 69. Some members of this CLIC family have properties especially pertinent to the current studies: localization in placental microvilli (notably, CLIC4 and CLIC5 70) and in a conceptually related structure stereocilia (CLIC5 71); and association with ERM proteins (CLIC4, 570). Additionally, our data show that the carboxylate transporter MCT1 and its molecular chaperone CD147 72 are strongly concordantly enriched in the MMV fraction from 300.19 cells; this molecular pair has previously been shown to be enriched in retinal pigment epithelium microvilli 73.
A plausible molecular basis for enrichment of ERMs, cofilin/ADF, NHERF1 and Myo1G in microvilli is shown in supporting Fig 2. All of them except NHERF1 have the potential to bind to actin. Cofilin and ERM can bind to PIP2 which is enriched in actin-rich peripheral processes 74. We hypothesize possible interaction of Myo1G with PIP2 (Fig 12) based on sequence similarities to Myo1C 75. Although NHERF1 cannot bind either actin or PIP2 directly, it can do so indirectly through its binding to ERM proteins 76. ERM is shown as phosphorylated in the figure, since that form (cpERM) is enriched in MMV (Fig 10) and is characteristic of conformationally active ERM. Three modes of binding of ERMs to the membrane are documented in the literature and suggested by the proteins enriched in our MMV fraction: binding to hydrophobic/basic motifs on TM proteins including CD44 77; binding to CLIC4 which inserts into the membrane 70; and binding to NHERF1 17, 18 which can bind to PDZ motifs in many TM proteins (although no plasma membrane proteins with PDZ motifs were identified in this analysis in MMV). Combinations of the interactions shown are likely to mediate the enrichment of these proteins to MMV.
Proteomic studies are most satisfying when they provide not only a myriad of important details on specific molecules (as outlined above), but also give rise to broad conceptual conclusions. Two such broad themes emerged from the present study. The first surprising general finding emerging from these analyses was a prominent overall increase in microfilament proteins in PBT post-nuclear lysate compared to 300.19. Actin concentration in PBT was 2–3 fold higher than in 300.19 cells both by MS estimate and by Coomassie blue estimate, representing 11% or more of PNL (Figs 4, 5) which resembles that of muscle cells 78. This difference is quite striking given the similar architecture and cellular origin of the two cell types, and the general finding that actin comprises about 1 5 percent of the cellular protein in non-muscle cells. This observation is extended by the finding of a pattern of ~ 3.7 fold increased abundance of many actin-binding proteins and contrasts with about a 2 × decrease in abundance of tubulin and its motor protein dynein (Fig 5). We interpret this as a dramatic demonstration that actin-mediated processes play an especially central role in quiescent primary lymphocytes, whose primary role is movement within tissue to conduct surveillance which is critically dependent on actin-mediated motility. In 300.19, the processes of transformation and cell culture have diluted the central role of actin which may be a common outcome of malignant transformation 79. Another marked difference, albeit more easily anticipated, between PBT and 300.19 is the increased abundance of ribosomal proteins in 300.19 proteins (relative to PBT) consistent with its increased cytoplasm and proliferation rate (Fig 3, 4 and data not shown).
The second surprising general finding is that there is less overlap between the two cell types tested in the TM proteins than in the other classes of molecules (Fig 6). Reanalysis of the more abundant TM protein indicates this is not simply a detection artifact (Fig 6). Of particular note, the infrequent overlap was a characteristic of plasma membrane proteins not intracellular TM proteins (Fig 12). These studies do not resolve whether this difference is attributable to changes in plasma membrane molecules associated with: 1) differentiation (T-cell vs pre-B cell since the PBT are mostly T-lymphocytes), 2) species differences (mouse vs human) or 3) transformation and propagation (primary vs transformed cultured line). With the benefit of hindsight, it is plausible to propose that surface molecules should play a special role in differentiation because of their unique localization at the interface between the extracellular milieu and intracellular space. This proposal is consistent with work of the International Workshops on Leukocyte Differentiation Antigens (69); those studies over 25 years, which generated the CD terminology identified hundreds of surface molecules that function as differentiation markers but many fewer markers that are intracellular molecules that are as useful in this respect. In addition, special selective pressures from microbes may also drive evolution of cell surface molecules not only with respect to mutation 80 but also possibly drive divergent expression patterns between species.
Thus, our combination of a procedure for enriching lymphoid cell microvilli and a thoughtful exploitation of LC/MS/MS-based label-free quantitation provides a remarkably informative picture at two different “scales”. First, these studies provide support for two broad concepts regarding classes of proteins: a special role of TM proteins in differentiation and notable enrichment of microfilament-related proteins in primary lymphocytes. Second, they identify specific shared microfilament-regulating and GTP-binding proteins enriched in the membrane/microvillus fractions from primary human T-lymphocytes and a transformed mouse pre-B lymphocyte cell line. Future genetic, biochemical and cell biological analysis of these proteins will enrich our understanding of lymphocyte microvilli.
Supplementary Material
Acknowledgments
We thank Drs. Geoffrey Kansas, Larry Wahl and the NIH Clinical Center Transfusion Service for generous provision of reagents and/or cells; Dr. Kruhlak for facilitation of imaging; Dr. Carole Parent and Trian Chavakis for insightful discussions. This research was supported by the NHLBI and NCI Intramural Research Programs and NCI contract N01-CO-12400 of the NIH.
Abbreviations
- cpERM
carboxy-phosphorylated ERM
- ERM
Ezrin Radixin Moesin
- mAb
monoclonal antibody
- MMV
membrane/microvillus fraction
- pAb
polyclonal antibody
- MS
mass spectrometry
- PBT
peripheral blood T-lymphocytes
- PNL
Post-nuclear lysate
- SetHu
Set of 300 human genes/proteins comprised of 250 most abundant in PBT MMV or PNL
- SetMo
Set of 296 mouse genes/proteins comprised of 250 most abundant in 300.19 MMV or PNL
- SetHuMo
shared set of 291 genes/proteins from SetHu and SetMo (see Experimental Procedures)
- TM
transmembrane
- WB
Western Blot
References
- 1.Butcher EC, Williams M, Youngman K, Rott L, Briskin M. Lymphocyte trafficking and regional immunity. Adv Immunol. 1999;72:209–53. doi: 10.1016/s0065-2776(08)60022-x. [DOI] [PubMed] [Google Scholar]
- 2.Springer TA. Traffic signals on endothelium for lymphocyte recirculation and leukocyte emigration. Annu Rev Physiol. 1995;57:827–872. doi: 10.1146/annurev.ph.57.030195.004143. [DOI] [PubMed] [Google Scholar]
- 3.Shimizu Y, Newman W, Tanaka Y, Shaw S. Lymphocyte interactions with endothelial cells. Immunology Today. 1992;13(3):106–12. doi: 10.1016/0167-5699(92)90151-V. [DOI] [PubMed] [Google Scholar]
- 4.Anderson AO, Anderson ND. Lymphocyte emigration from high endothelial venules in rat lymph nodes. Immunology. 1976;31(5):731–748. [PMC free article] [PubMed] [Google Scholar]
- 5.van Ewijk W, Brons NH, Rozing J. Scanning electron microscopy of homing and recirculating lymphocyte populations. Cell Immunol. 1975;19(2):245–61. doi: 10.1016/0008-8749(75)90207-5. [DOI] [PubMed] [Google Scholar]
- 6.Picker LJ, Warnock RA, Burns AR, Doerschuk CM, Berg EL, Butcher EC. The neutrophil selectin LECAM-1 presents carbohydrate ligands to the vascular selectins ELAM-1 and GMP-140. Cell. 1991;66(5):921–933. doi: 10.1016/0092-8674(91)90438-5. [DOI] [PubMed] [Google Scholar]
- 7.von Andrian UH, Hasslen SR, Nelson RD, Erlandsen SL, Butcher EC. A central role for microvillous receptor presentation in leukocyte adhesion under flow. Cell. 1995;82(6):989–999. doi: 10.1016/0092-8674(95)90278-3. [DOI] [PubMed] [Google Scholar]
- 8.Brown MJ, Nijhara R, Hallam JA, Gignac M, Yamada KM, Erlandsen SL, Delon J, Kruhlak M, Shaw S. Chemokine stimulation of human peripheral blood T lymphocytes induces rapid dephosphorylation of ERM proteins, which facilitates loss of microvilli and polarization. Blood. 2003;102(12):3890–3899. doi: 10.1182/blood-2002-12-3807. [DOI] [PubMed] [Google Scholar]
- 9.Majstoravich S, Zhang J, Nicholson-Dykstra S, Linder S, Friedrich W, Siminovitch KA, Higgs HN. Lymphocyte microvilli are dynamic, actin-dependent structures that do not require Wiskott-Aldrich syndrome protein (WASp) for their morphology. Blood. 2004;104(5):1396–403. doi: 10.1182/blood-2004-02-0437. [DOI] [PubMed] [Google Scholar]
- 10.Shao JY, Xu J. A modified micropipette aspiration technique and its application to tether formation from human neutrophils. J Biomech Eng. 2002;124(4):388–96. doi: 10.1115/1.1486469. [DOI] [PubMed] [Google Scholar]
- 11.Mooseker MS. Organization, chemistry, and assembly of the cytoskeletal apparatus of the intestinal brush border. Annu Rev Cell Biol. 1985;1:209–41. doi: 10.1146/annurev.cb.01.110185.001233. [DOI] [PubMed] [Google Scholar]
- 12.Donowitz M, Cha B, Zachos NC, Brett CL, Sharma A, Tse CM, Li X. NHERF family and NHE3 regulation. J Physiol. 2005;567(Pt 1):3–11. doi: 10.1113/jphysiol.2005.090399. [DOI] [PMC free article] [PubMed] [Google Scholar]
- 13.Weinman EJ, Cunningham R, Shenolikar S. NHERF and regulation of the renal sodium-hydrogen exchanger NHE3. Pflugers Arch. 2005;450(3):137–44. doi: 10.1007/s00424-005-1384-8. [DOI] [PubMed] [Google Scholar]
- 14.Lin HW, Schneider ME, Kachar B. When size matters: the dynamic regulation of stereocilia lengths. Curr Opin Cell Biol. 2005;17(1):55–61. doi: 10.1016/j.ceb.2004.12.005. [DOI] [PubMed] [Google Scholar]
- 15.Reczek D, Bretscher A. Identification of EPI64, a TBC/rabGAP domain-containing microvillar protein that binds to the first PDZ domain of EBP50 and E3KARP. J Cell Biol. 2001;153(1):191–206. doi: 10.1083/jcb.153.1.191. [DOI] [PMC free article] [PubMed] [Google Scholar]
- 16.Donowitz M, Singh S, Salahuddin FF, Hogema BM, Chen Y, Gucek M, Cole RN, Zachos NC, Kovbasnjuk O, Lapierre LA, Broere N, Goldenring J, deJonge H, Li X. Proteome of murine jejunal brush border membrane vesicles. J Proteome Res. 2007;6(10):4068–79. doi: 10.1021/pr0701761. [DOI] [PubMed] [Google Scholar]
- 17.Morell G, Steplock D, Shenolikar S, Weinman EJ. Identification of a putative Na(+)-H+ exchanger regulatory cofactor in rabbit renal BBM. Am J Physiol. 1990;259(6 Pt 2):F867–71. doi: 10.1152/ajprenal.1990.259.6.F867. [DOI] [PubMed] [Google Scholar]
- 18.Reczek D, Berryman M, Bretscher A. Identification of EBP50: A PDZ-containing phosphoprotein that associates with members of the ezrin-radixin-moesin family. J Cell Biol. 1997;139(1):169–79. doi: 10.1083/jcb.139.1.169. [DOI] [PMC free article] [PubMed] [Google Scholar]
- 19.Foster LJ, de Hoog CL, Zhang Y, Zhang Y, Xie X, Mootha VK, Mann M. A mammalian organelle map by protein correlation profiling. Cell. 2006;125(1):187–99. doi: 10.1016/j.cell.2006.03.022. [DOI] [PubMed] [Google Scholar]
- 20.Wang G, Wu WW, Zeng W, Chou CL, Shen RF. Label-free protein quantification using LC-coupled ion trap or FT mass spectrometry: Reproducibility, linearity, and application with complex proteomes. J Proteome Res. 2006;5(5):1214–23. doi: 10.1021/pr050406g. [DOI] [PubMed] [Google Scholar]
- 21.Bondarenko PV, Chelius D, Shaler TA. Identification and relative quantitation of protein mixtures by enzymatic digestion followed by capillary reversed-phase liquid chromatography-tandem mass spectrometry. Anal Chem. 2002;74(18):4741–9. doi: 10.1021/ac0256991. [DOI] [PubMed] [Google Scholar]
- 22.Wang W, Zhou H, Lin H, Roy S, Shaler TA, Hill LR, Norton S, Kumar P, Anderle M, Becker CH. Quantification of proteins and metabolites by mass spectrometry without isotopic labeling or spiked standards. Anal Chem. 2003;75(18):4818–26. doi: 10.1021/ac026468x. [DOI] [PubMed] [Google Scholar]
- 23.Higgs RE, Knierman MD, Gelfanova V, Butler JP, Hale JE. Comprehensive label-free method for the relative quantification of proteins from biological samples. J Proteome Res. 2005;4(4):1442–50. doi: 10.1021/pr050109b. [DOI] [PubMed] [Google Scholar]
- 24.Li XJ, Yi EC, Kemp CJ, Zhang H, Aebersold R. A software suite for the generation and comparison of peptide arrays from sets of data collected by liquid chromatography-mass spectrometry. Mol Cell Proteomics. 2005;4(9):1328–40. doi: 10.1074/mcp.M500141-MCP200. [DOI] [PubMed] [Google Scholar]
- 25.Ley K, Tedder TF, Kansas GS. L-selectin can mediate leukocyte rolling in untreated mesenteric venules in vivo independent of E- or P-selectin. Blood. 1993;82(5):1632–8. [PubMed] [Google Scholar]
- 26.Dwir O, Kansas GS, Alon R. Cytoplasmic anchorage of L-selectin controls leukocyte capture and rolling by increasing the mechanical stability of the selectin tether. J Cell Biol. 2001;155(1):145–56. doi: 10.1083/jcb.200103042. [DOI] [PMC free article] [PubMed] [Google Scholar]
- 27.Wahl SM, Katona IM, Stadler BM, Wilder RL, Helsel WE, Wahl LM. Isolation of human mononuclear cell subsets by counterflow centrifugal elutriation (CCE). II. Functional properties of B-lymphocyte-, T-lymphocyte-, and monocyte-enriched fractions. Cell Immunol. 1984;85(2):384–95. doi: 10.1016/0008-8749(84)90252-1. [DOI] [PubMed] [Google Scholar]
- 28.van Rheenen J, Song X, van Roosmalen W, Cammer M, Chen X, Desmarais V, Yip SC, Backer JM, Eddy RJ, Condeelis JS. EGF-induced PIP2 hydrolysis releases and activates cofilin locally in carcinoma cells. J Cell Biol. 2007;179(6):1247–59. doi: 10.1083/jcb.200706206. [DOI] [PMC free article] [PubMed] [Google Scholar]
- 29.Carraway KL, Huggins JW, Cerra RF, Yeltman DR, Carraway CA. alpha-Actinin-containing branched microvilli isolated from an ascites adenocarcinoma. Nature. 1980;285(5765):508–10. doi: 10.1038/285508a0. [DOI] [PubMed] [Google Scholar]
- 30.Booth AG, Vanderpuye OA. Structure of human placental microvilli. Ciba Found Symp. 1983;95:180–94. doi: 10.1002/9780470720769.ch11. [DOI] [PubMed] [Google Scholar]
- 31.Berryman M, Gary R, Bretscher A. Ezrin oligomers are major cytoskeletal components of placental microvilli: a proposal for their involvement in cortical morphogenesis. J Cell Biol. 1995;131(5):1231–42. doi: 10.1083/jcb.131.5.1231. [DOI] [PMC free article] [PubMed] [Google Scholar]
- 32.Hellman U, Wernstedt C, Gonez J, Heldin CH. Improvement of an “In-Gel” digestion procedure for the micropreparation of internal protein fragments for amino acid sequencing. Anal Biochem. 1995;224(1):451–5. doi: 10.1006/abio.1995.1070. [DOI] [PubMed] [Google Scholar]
- 33.Moller S, Croning MD, Apweiler R. Evaluation of methods for the prediction of membrane spanning regions. Bioinformatics. 2001;17(7):646–53. doi: 10.1093/bioinformatics/17.7.646. [DOI] [PubMed] [Google Scholar]
- 34.Mariner JM, McMahon JB, O’Keefe BR, Nagashima K, Boyd MR. The HIV-inactivating protein, cyanovirin-N, does not block gp120-mediated virus-to-cell binding. Biochem Biophys Res Commun. 1998;248(3):841–5. doi: 10.1006/bbrc.1998.9060. [DOI] [PubMed] [Google Scholar]
- 35.Muriaux D, Mirro J, Nagashima K, Harvin D, Rein A. Murine leukemia virus nucleocapsid mutant particles lacking viral RNA encapsidate ribosomes. J Virol. 2002;76(22):11405–13. doi: 10.1128/JVI.76.22.11405-11413.2002. [DOI] [PMC free article] [PubMed] [Google Scholar]
- 36.Ivetic A, Florey O, Deka J, Haskard DO, Ager A, Ridley AJ. Mutagenesis of the ezrin-radixin-moesin binding domain of L-selectin tail affects shedding, microvillar positioning, and leukocyte tethering. J Biol Chem. 2004;279(32):33263–72. doi: 10.1074/jbc.M312212200. [DOI] [PubMed] [Google Scholar]
- 37.Takeuchi K, Sato N, Kasahara H, Funayama N, Nagafuchi A, Yonemura S, Tsukita S, Tsukita S. Perturbation of cell adhesion and microvilli formation by antisense oligonucleotides to ERM family members. J Cell Biol. 1994;125(6):1371–1384. doi: 10.1083/jcb.125.6.1371. [DOI] [PMC free article] [PubMed] [Google Scholar]
- 38.Brown MJ, Hallam JA, Colucci-Guyon E, Shaw S. Rigidity of circulating lymphocytes is primarily conferred by vimentin intermediate filaments. J Immunol. 2001;166(11):6640–6646. doi: 10.4049/jimmunol.166.11.6640. [DOI] [PubMed] [Google Scholar]
- 39.Simpson JC, Pepperkok R. The subcellular localization of the mammalian proteome comes a fraction closer. Genome Biol. 2006;7(6):222. doi: 10.1186/gb-2006-7-6-222. [DOI] [PMC free article] [PubMed] [Google Scholar]
- 40.Gilchrist A, Au CE, Hiding J, Bell AW, Fernandez-Rodriguez J, Lesimple S, Nagaya H, Roy L, Gosline SJ, Hallett M, Paiement J, Kearney RE, Nilsson T, Bergeron JJ. Quantitative proteomics analysis of the secretory pathway. Cell. 2006;127(6):1265–81. doi: 10.1016/j.cell.2006.10.036. [DOI] [PubMed] [Google Scholar]
- 41.Nebl T, Pestonjamasp KN, Leszyk JD, Crowley JL, Oh SW, Luna EJ. Proteomic analysis of a detergent-resistant membrane skeleton from neutrophil plasma membranes. J Biol Chem. 2002;277(45):43399–409. doi: 10.1074/jbc.M205386200. [DOI] [PubMed] [Google Scholar]
- 42.Tyska MJ, Mackey AT, Huang JD, Copeland NG, Jenkins NA, Mooseker MS. Myosin-1a is critical for normal brush border structure and composition. Mol Biol Cell. 2005;16(5):2443–57. doi: 10.1091/mbc.E04-12-1116. [DOI] [PMC free article] [PubMed] [Google Scholar]
- 43.Batters C, Arthur CP, Lin A, Porter J, Geeves MA, Milligan RA, Molloy JE, Coluccio LM. Myo1c is designed for the adaptation response in the inner ear. Embo J. 2004;23(7):1433–40. doi: 10.1038/sj.emboj.7600169. [DOI] [PMC free article] [PubMed] [Google Scholar]
- 44.Kim SV, Mehal WZ, Dong X, Heinrich V, Pypaert M, Mellman I, Dembo M, Mooseker MS, Wu D, Flavell RA. Modulation of cell adhesion and motility in the immune system by Myo1f. Science. 2006;314(5796):136–9. doi: 10.1126/science.1131920. [DOI] [PubMed] [Google Scholar]
- 45.Bose A, Guilherme A, Robida SI, Nicoloro SM, Zhou QL, Jiang ZY, Pomerleau DP, Czech MP. Glucose transporter recycling in response to insulin is facilitated by myosin Myo1c. Nature. 2002;420(6917):821–4. doi: 10.1038/nature01246. [DOI] [PubMed] [Google Scholar]
- 46.Tyska MJ, Mooseker MS. A role for myosin-1A in the localization of a brush border disaccharidase. J Cell Biol. 2004;165(3):395–405. doi: 10.1083/jcb.200310031. [DOI] [PMC free article] [PubMed] [Google Scholar]
- 47.DesMarais V, Ghosh M, Eddy R, Condeelis J. Cofilin takes the lead. J Cell Sci. 2005;118(Pt 1):19–26. doi: 10.1242/jcs.01631. [DOI] [PubMed] [Google Scholar]
- 48.Andrianantoandro E, Pollard TD. Mechanism of actin filament turnover by severing and nucleation at different concentrations of ADF/cofilin. Mol Cell. 2006;24(1):13–23. doi: 10.1016/j.molcel.2006.08.006. [DOI] [PubMed] [Google Scholar]
- 49.Yonezawa N, Nishida E, Iida K, Yahara I, Sakai H. Inhibition of the interactions of cofilin, destrin, and deoxyribonuclease I with actin by phosphoinositides. J Biol Chem. 1990;265(15):8382–6. [PubMed] [Google Scholar]
- 50.dos Remedios CG, Chhabra D, Kekic M, Dedova IV, Tsubakihara M, Berry DA, Nosworthy NJ. Actin binding proteins: regulation of cytoskeletal microfilaments. Physiol Rev. 2003;83(2):433–73. doi: 10.1152/physrev.00026.2002. [DOI] [PubMed] [Google Scholar]
- 51.Fass J, Gehler S, Sarmiere P, Letourneau P, Bamburg JR. Regulating filopodial dynamics through actin-depolymerizing factor/cofilin. Anat Sci Int. 2004;79(4):173–83. doi: 10.1111/j.1447-073x.2004.00087.x. [DOI] [PubMed] [Google Scholar]
- 52.Ashworth SL, Sandoval RM, Hosford M, Bamburg JR, Molitoris BA. Ischemic injury induces ADF relocalization to the apical domain of rat proximal tubule cells. Am J Physiol Renal Physiol. 2001;280(5):F886–94. doi: 10.1152/ajprenal.2001.280.5.F886. [DOI] [PubMed] [Google Scholar]
- 53.Gorbatyuk VY, Nosworthy NJ, Robson SA, Bains NP, Maciejewski MW, Dos Remedios CG, King GF. Mapping the phosphoinositide-binding site on chick cofilin explains how PIP2 regulates the cofilin-actin interaction. Mol Cell. 2006;24(4):511–22. doi: 10.1016/j.molcel.2006.10.007. [DOI] [PubMed] [Google Scholar]
- 54.Ono S. Regulation of actin filament dynamics by actin depolymerizing factor/cofilin and actin-interacting protein 1: new blades for twisted filaments. Biochemistry. 2003;42(46):13363–70. doi: 10.1021/bi034600x. [DOI] [PubMed] [Google Scholar]
- 55.Okada K, Ravi H, Smith EM, Goode BL. Aip1 and cofilin promote rapid turnover of yeast actin patches and cables: a coordinated mechanism for severing and capping filaments. Mol Biol Cell. 2006;17(7):2855–68. doi: 10.1091/mbc.E06-02-0135. [DOI] [PMC free article] [PubMed] [Google Scholar]
- 56.Mayboroda O, Schluter K, Jockusch BM. Differential colocalization of profilin with microfilaments in PtK2 cells. Cell Motil Cytoskeleton. 1997;37(2):166–77. doi: 10.1002/(SICI)1097-0169(1997)37:2<166::AID-CM9>3.0.CO;2-6. [DOI] [PubMed] [Google Scholar]
- 57.Skare P, Kreivi JP, Bergstrom A, Karlsson R. Profilin I colocalizes with speckles and Cajal bodies: a possible role in pre-mRNA splicing. Exp Cell Res. 2003;286(1):12–21. doi: 10.1016/s0014-4827(03)00102-2. [DOI] [PubMed] [Google Scholar]
- 58.Grenklo S, Johansson T, Bertilson L, Karlsson R. Anti-actin antibodies generated against profilin:actin distinguish between non-filamentous and filamentous actin, and label cultured cells in a dotted pattern. Eur J Cell Biol. 2004;83(8):413–23. doi: 10.1078/0171-9335-00400. [DOI] [PubMed] [Google Scholar]
- 59.Hartwig JH, Chambers KA, Hopcia KL, Kwiatkowski DJ. Association of profilin with filament-free regions of human leukocyte and platelet membranes and reversible membrane binding during platelet activation. J Cell Biol. 1989;109(4 Pt 1):1571–9. doi: 10.1083/jcb.109.4.1571. [DOI] [PMC free article] [PubMed] [Google Scholar]
- 60.Wettschureck N, Offermanns S. Mammalian G proteins and their cell type specific functions. Physiol Rev. 2005;85(4):1159–204. doi: 10.1152/physrev.00003.2005. [DOI] [PubMed] [Google Scholar]
- 61.Jordens I, Marsman M, Kuijl C, Neefjes J. Rab proteins, connecting transport and vesicle fusion. Traffic. 2005;6(12):1070–7. doi: 10.1111/j.1600-0854.2005.00336.x. [DOI] [PubMed] [Google Scholar]
- 62.Jaffe AB, Hall A. Rho GTPases: biochemistry and biology. Annu Rev Cell Dev Biol. 2005;21:247–69. doi: 10.1146/annurev.cellbio.21.020604.150721. [DOI] [PubMed] [Google Scholar]
- 63.Hancock JF. Ras proteins: different signals from different locations. Nat Rev Mol Cell Biol. 2003;4(5):373–84. doi: 10.1038/nrm1105. [DOI] [PubMed] [Google Scholar]
- 64.Heo WD, Inoue T, Park WS, Kim ML, Park BO, Wandless TJ, Meyer T. PI(3,4,5)P3 and PI(4,5)P2 lipids target proteins with polybasic clusters to the plasma membrane. Science. 2006;314(5804):1458–61. doi: 10.1126/science.1134389. [DOI] [PMC free article] [PubMed] [Google Scholar]
- 65.Bos JL. Linking Rap to cell adhesion. Curr Opin Cell Biol. 2005;17(2):123–8. doi: 10.1016/j.ceb.2005.02.009. [DOI] [PubMed] [Google Scholar]
- 66.Concha M, Vidal A, Garces G, Figueroa CD, Caorsi I. Physical interaction between Langerhans cells and T-lymphocytes during antigen presentation in vitro. J Invest Dermatol. 1993;100(4):429–34. doi: 10.1111/1523-1747.ep12472117. [DOI] [PubMed] [Google Scholar]
- 67.Tsukita S, Oishi K, Sato N, Sagara J, Kawai A, Tsukita S. ERM family members as molecular linkers between the cell surface glycoprotein CD44 and actin-based cytoskeletons. J Cell Biol. 1994;126(2):391–401. doi: 10.1083/jcb.126.2.391. [DOI] [PMC free article] [PubMed] [Google Scholar]
- 68.DeGrendele HC, Estess P, Picker LJ, Siegelman MH. CD44 and its ligand hyaluronate mediate rolling under physiologic flow: a novel lymphocyte-endothelial cell primary adhesion pathway. J Exp Med. 1996;183(3):1119–30. doi: 10.1084/jem.183.3.1119. [DOI] [PMC free article] [PubMed] [Google Scholar]
- 69.Berry KL, Hobert O. Mapping functional domains of chloride intracellular channel (CLIC) proteins in vivo. J Mol Biol. 2006;359(5):1316–33. doi: 10.1016/j.jmb.2006.04.046. [DOI] [PubMed] [Google Scholar]
- 70.Berryman M, Bretscher A. Identification of a novel member of the chloride intracellular channel gene family (CLIC5) that associates with the actin cytoskeleton of placental microvilli. Mol Biol Cell. 2000;11(5):1509–21. doi: 10.1091/mbc.11.5.1509. [DOI] [PMC free article] [PubMed] [Google Scholar]
- 71.Gagnon LH, Longo-Guess CM, Berryman M, Shin JB, Saylor KW, Yu H, Gillespie PG, Johnson KR. The chloride intracellular channel protein CLIC5 is expressed at high levels in hair cell stereocilia and is essential for normal inner ear function. J Neurosci. 2006;26(40):10188–98. doi: 10.1523/JNEUROSCI.2166-06.2006. [DOI] [PMC free article] [PubMed] [Google Scholar]
- 72.Kirk P, Wilson MC, Heddle C, Brown MH, Barclay AN, Halestrap AP. CD147 is tightly associated with lactate transporters MCT1 and MCT4 and facilitates their cell surface expression. Embo J. 2000;19(15):3896–904. doi: 10.1093/emboj/19.15.3896. [DOI] [PMC free article] [PubMed] [Google Scholar]
- 73.Halestrap AP, Price NT. The proton-linked monocarboxylate transporter (MCT) family: structure, function and regulation. Biochem J. 1999;343(Pt 2):281–99. [PMC free article] [PubMed] [Google Scholar]
- 74.Tall EG, Spector I, Pentyala SN, Bitter I, Rebecchi MJ. Dynamics of phosphatidylinositol 4,5-bisphosphate in actin-rich structures. Curr Biol. 2000;10(12):743–6. doi: 10.1016/s0960-9822(00)00541-8. [DOI] [PubMed] [Google Scholar]
- 75.Hokanson DE, Laakso JM, Lin T, Sept D, Ostap EM. Myo1c binds phosphoinositides through a putative pleckstrin homology domain. Mol Biol Cell. 2006;17(11):4856–65. doi: 10.1091/mbc.E06-05-0449. [DOI] [PMC free article] [PubMed] [Google Scholar]
- 76.Bretscher A, Chambers D, Nguyen R, Reczek D. Erm-Merlin and Ebp50 Protein Families in Plasma Membrane Organization and Function. Annu Rev Cell Dev Biol. 2000;16:113–143. doi: 10.1146/annurev.cellbio.16.1.113. [DOI] [PubMed] [Google Scholar]
- 77.Terawaki S, Kitano K, Hakoshima T. Structural basis for type II membrane protein binding by ERM proteins revealed by the radixin-neutral endopeptidase 24.11 (NEP) complex. J Biol Chem. 2007;282(27):19854–62. doi: 10.1074/jbc.M609232200. [DOI] [PubMed] [Google Scholar]
- 78.Arora PD, McCulloch CA. Dependence of collagen remodelling on alpha-smooth muscle actin expression by fibroblasts. J Cell Physiol. 1994;159(1):161–75. doi: 10.1002/jcp.1041590120. [DOI] [PubMed] [Google Scholar]
- 79.Schmitt-Graff A, Chaponnier C, Gabbiani G. Cytoskeletal organization of peripheral blood normal and leukemic lymphocytes and lymphoblasts. J Submicrosc Cytol. 1987;19(2):329–35. [PubMed] [Google Scholar]
- 80.Murphy PM. Molecular mimicry and the generation of host defense protein diversity. Cell. 1993;72(6):823–826. doi: 10.1016/0092-8674(93)90571-7. [DOI] [PubMed] [Google Scholar]
Associated Data
This section collects any data citations, data availability statements, or supplementary materials included in this article.