Abstract
Previous studies identified partial inhibitors and allosteric modulators of 5-HT ([5-amino-3-(3,4-dichlorophenyl)-1,2-dihydropyrido[3,4-b]pyrazin-7-yl]carbamic acid ethyl ester [SoRI-6238], 4-(2-[bis(4-fluorophenyl)methoxy]ethyl)-1-(2-trifluoromethyl-benzyl)-piperidine [TB-1-099]) and dopamine transporters N-(Diphenylmethyl)-2-phenyl-4-quinazolinamine, [SoRI-9804]). We report here the identification of three novel allosteric modulators of the dopamine transporter (N-(2,2-Diphenylethyl)-2-phenyl-4-quinazolinamine [SoRI-20040], N-(3,3-Diphenylpropyl)-2-phenyl-4-quinazolinamine [SoRI-20041], [4-Amino-6-[(diphenylmethyl)amino]-5-nitro-2-pyridinyl]carbamic acid ethyl ester, [SoRI-2827]). Membranes were prepared from HEK cells expressing the cloned human dopamine (hDAT) transporter. [125I]RTI-55 binding and other assays followed published procedures. SoRI-20040, SoRI-20041 and SoRI-2827 partially inhibited [125I]RTI-55 binding with EC50 values ranging from ∼1.4 μM to 3 μM and EMAX values decreasing as the [125I]RTI-55 concentrations increased. All three compounds decreased the [125I]RTI-55 Bmax and increased the apparent Kd in a manner well described by a sigmoid dose-response curve. In dissociation rate experiments, SoRI-20040 (10 μM) and SoRI-20041 (10 μM), but not SoRI-2827 (10 μM), slowed the dissociation of [125I]RTI-55 from hDAT by ∼30%. Using rat brain synaptosomes, all three agents partially inhibited [3H]dopamine uptake with EC50 values ranging from 1.8 μM to 3.1 μM and decreased the VMAX value in a dose-dependent manner. SoRI-9804 and SoRI-20040 partially inhibited amphetamine-induced DAT-mediated release of [3H]MPP+ from rat caudate synaptosomes in a dose-dependent manner. Viewed collectively, we report several compounds that allosterically modulate hDAT binding and function, and identify novel partial inhibitors of amphetamine-induced dopamine release.
Introduction
The biogenic amine transporters for dopamine (DAT), norepinephrine (NET) and serotonin (SERT), are important targets for a wide range of medications used to treat a variety of psychiatric conditions such as anxiety, depression and obsessive compulsive disorder (Gorman and Kent, 1999; Zohar and Westenberg, 2000). Drugs that interact with transporters generally interact with these proteins in two distinct ways. Reuptake inhibitors bind to transporter proteins but are not transported. These drugs elevate extracellular concentrations of transmitter by blocking transporter-mediated uptake of transmitters from the synapse. Substrate-type releasers bind to transporter proteins and are subsequently transported into the cytoplasm of nerve terminals, releasing neurotransmitter via a process of carrier mediated exchange (Rudnick and Clark, 1993; Rothman and Baumann, 2006).
There is growing interest in the possible therapeutic potential of allosteric modulators (Christopoulos and Kenakin, 2002; Schwartz and Holst, 2007), including the identification of allosteric modulators of the biogenic amine transporters (BATs) (Sanchez, 2006). Early evidence of allosteric interactions at the biogenic amine transporters included our finding that pre-treatment of guinea pig membranes with paroxetine increased the dissociation rate of [3H]cocaine from SERT (Akunne et al., 1992). Using rat SERT expressed in HEK cells, Sur et al. (Sur et al., 1998) presented evidence that imipramine allosterically modulated the ability of citalopram to inhibit [3H]5-HT transport. Others reported apparent allosteric interactions between 5-HT and [3H]paroxetine binding to human platelet SERT (Andersson and Marcusson, 1989) and between β-estradiol and SERT (Chang and Chang, 1999). More recently, we reported novel allosteric modulators of both DAT (N-(Diphenylmethyl)-2-phenyl-4-quinazolinamine [SoRI-9804]) (Rothman et al., 2002) and SERT ([5-amino-3-(3,4-dichlorophenyl)-1,2-dihydropyrido[3,4-b]pyrazin-7-yl]carbamic acid ethyl ester [SoRI-6238], 4-(2-[bis(4-fluorophenyl)methoxy]ethyl)-1-(2-trifluoromethyl-benzyl)-piperidine [TB-1-099]) (Nandi et al., 2004; Nightingale et al., 2005). Moreover, Chen et al. reported evidence for allosteric modulation of [3H]-S-citalopram binding (Chen et al., 2005).
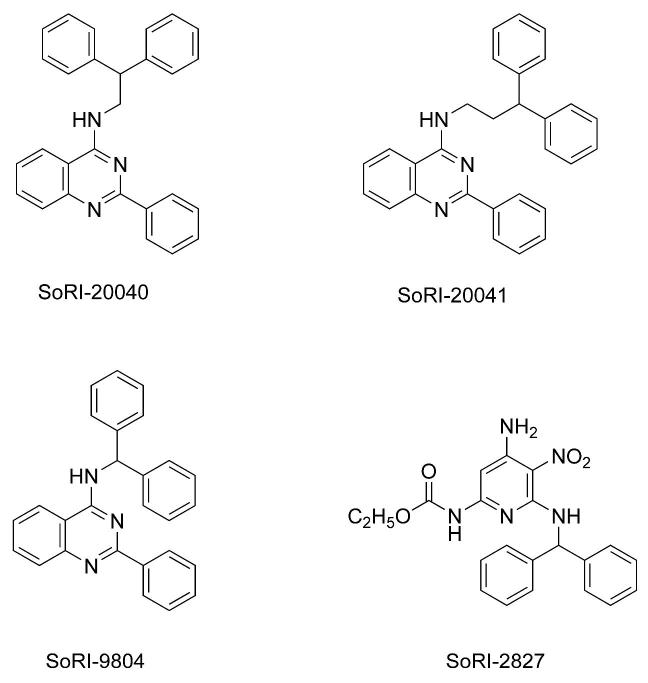
In 1999 we searched a library of compounds maintained by Southern Research Institute for compounds that possessed a diphenylmethyl (benzhydryl) group. Using rat brain tissue assays, we screened these compounds for activity in binding assays for DAT, SERT and NET (unpublished data). This effort identified several possible allosteric modulators of the BATs. We examined in greater detail the interaction of selected agents with the BATs. SoRI-9804 (Fig. 1) partially inhibited [125I]RTI-55 binding to DAT and partially inhibited [3H]DA uptake by rat brain synaptosomes. SoRI-6238, and a subsequent compound that was not part of the SoRI library (TB-1-099), were shown to allosterically modulate SERT (Nandi et al., 2004; Nightingale et al., 2005). In the present study, we focused on three additional compounds identified as being potential allosteric modulators (Fig. 1): SoRI-20040 (N-(2,2-Diphenylethyl)-2-phenyl-4-quinazolinamine), SoRI-20041 (N-(3,3-Diphenylpropyl)-2-phenyl-4-quinazolinamine) and SoRI-2827 ([4-Amino-6-[(diphenylmethyl)amino]-5-nitro-2-pyridinyl]carbamic acid ethyl ester). Initial screens indicated that all three agents were inactive at NET and SERT binding (IC50 values > 10 μM), but inhibited [125I]RTI-55 binding to the rat brain DAT in a manner suggestive of allosteric interactions. We report here that these three agents allosterically modulate the human DAT (hDAT) expressed in HEK cells and noncompetitively inhibit [3H]DA uptake by rat caudate synaptosomes.
Figure 1.
Structures of SoRI-20040, SoRI-20041, SoRI-9804 and SoRI-2827. See abbreviations for the chemical names of these compounds.
Methods
Animals
Male Sprague-Dawley rats (300-450 g), used for [3H]neurotransmitter uptake assays, were obtained from Charles River Laboratories (Wilmington, MA). The animal housing facilities were fully accredited by the American Association of the Accreditation of Laboratory Animal Care (AAALAC), and all experiments were performed within the guidelines delineated in the Institutional Care and Use Committee of the National Institute on Drug Abuse (NIDA), Intramural Research Program (IRP).
Tissue Preparation
HEK cells expressing hDAT were grown to confluency on plates, using published methods (Nightingale et al., 2005). The medium was removed and the plates were stored at -80° C until the day of the assay. The plates were thawed, the cells scraped off and rinsed with 55.2 mM sodium phosphate buffer, pH 7.4 (“BB”), and homogenized with a polytron at setting 6 for 10 sec. The homogenate was centrifuged twice at 30,000 × g for 10 min, with resuspensions in BB. The final pellets were resuspended in a final volume of 225 ml/plate with BB.
Transporter binding assays
For assays using HEK cells expressing hDAT, experiments were carried out in 12 × 75 mm polystyrene tubes that were pre-filled with 100 μL of drug, 100 μL of radioligand, and 50 μL of a blocker or buffer (Rothman et al., 1998). [125I]RTI-55 was diluted in a protease inhibitor cocktail (BB with 25 μg/mL chymostatin, 25 μg/mL leupeptin, 1 mM EGTA, and 1 mM EDTA). The drugs and blockers were made up in BB with 1 mg/mL BSA at pH 7.4. The experiment was initiated with the addition of 750 μL of membranes in BB. Samples were incubated in a final volume of 1 mL, at 0° C for 18-24 hrs (steady state). After incubation the samples were filtered with a Brandel cell harvester over Whatman GF/B filters presoaked in wash buffer (ice-cold 10 mM Tris/HCl, 150 mM NaCl, pH 7.4) containing 2% poly(ethyleneimine). Typical total and nonspecific cpms observed for the HEK cell transporter binding assays were 2000 and 75, respectively.
Kinetic experiments
Kinetic experiments were conducted with minor modifications of published methods (Nandi et al., 2004). For hDAT dissociation experiments, [125I]RTI-55 (0.01 nM) was incubated for 2 hr at 25° C (steady state). At that point, 100 μL of RTI-55 (final concentration 1 μM) or buffer was added. Ten minutes later, test drug (10 μM)) was added. This design insured that any effect of the test drug could not be due to interactions with the DAT binding site, since this site would be completely occupied by RTI-55. Triplicate samples were filtered at various time points after the addition of test drug: 5,15,25,35, and 55 mins. For the purpose of data analysis (described below), the 100% of control point was “time 0 min” for conditions that did not receive test drug, and “time 10 min” for conditions that received test drug.
Neurotransmitter uptake assays
[3H]DA uptake inhibition assays were conducted as described elsewhere (Rothman et al., 2001). Freshly removed caudate ([3H]DA uptake) was homogenized in 10% ice-cold sucrose with 12 strokes of a hand-held Potter-Elvehjem homogenizer followed by centrifugation at 1000 × g for 10 min. The supernatants were saved on ice and used immediately. The assay buffer used was Krebs-phosphate buffer containing 154.4 mM NaCl, 2.9 mM KCl, 1.1 mM CaCl2, 0.83 mM MgCl2, 5 mM glucose, 1 mg/ml ascorbic acid, and 50 μM pargyline. Nonspecific uptake was measured by incubating in the presence of 10 μM indatraline. The reactions were stopped after 15 min by filtering with a Brandel cell harvester over Whatman GF/B filters presoaked in wash buffer maintained at 25° C (10 mM Tris/HCl, pH 7.4/150 mM NaCl)). Retained tritium was measured with a Trilux liquid scintillation counter after overnight extraction in 0.6 mL of liquid scintillation cocktail (ICN). Typical total and nonspecific cpms observed for the rat brain transporter uptake inhibition assays were 18,000 and 1000, respectively.
[3H]MPP+ Release Assays
This assay measures the ability of test agents to release pre-loaded [3H]MPP+ via the DAT using rat striatal synaptosomes. The details of this assay are published elsewhere (Rothman et al., 2003).
Experimental Design
Inhibition curves were generated by displacing one to three concentrations of [125I]RTI-55 by 10 concentrations of drug. Concentrations of [125I]RTI-55 greater than 0.01 nM were generated by addition of non-radioactive RTI-55. For binding surface experiments (Rothman, 1986; Rothman et al., 1991) two different concentrations of radioligand were each displaced by 10 concentrations of test agents in the absence or presence of various blockers. Surfaces for [3H]DA uptake were generated by displacing two concentrations of [3H]DA (∼2 nM and 20 nM) by DA (2 nM - 4096 nM) in the absence and presence of three concentrations of test agent. The higher concentration of [3H]DA was obtained by adding DA to the radioligand. Dissociation experiments were conducted with minor modification of published procedures (Rothman et al., 1991).
Data Analysis and Statistics
Inhibition curve data were expressed as “percent inhibition” and fit to the two parameter dose-response curve model: Y= EMAX × ([D]/([D] + EC50) for the best fit estimates of the EMAX and EC50 using either KaleidaGraph version 3.6.4 or MLAB-PC (Nightingale et al., 2005). Binding surfaces were fit to one and two-site binding models using MLAB-PC as described elsewhere (Rothman et al., 1991). Dissociation experiments were fit to one or two component dissociation models (Nandi et al., 2004). Statistical significance among binding models was determined using the F-test with a threshold of P<0.01. Graphs were generated with KaleidaGraph 3.6 software.
Chemicals
[3H]DA (SA = 31.8 Ci/mmol) was from Perkin-Elmer. The sources of other chemicals are published (Rothman et al., 1998).
Results
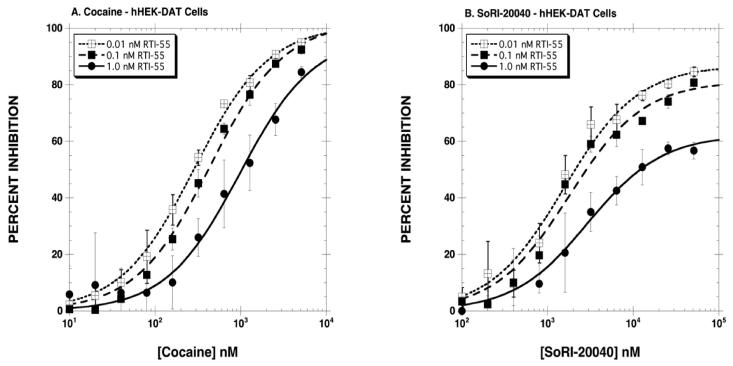
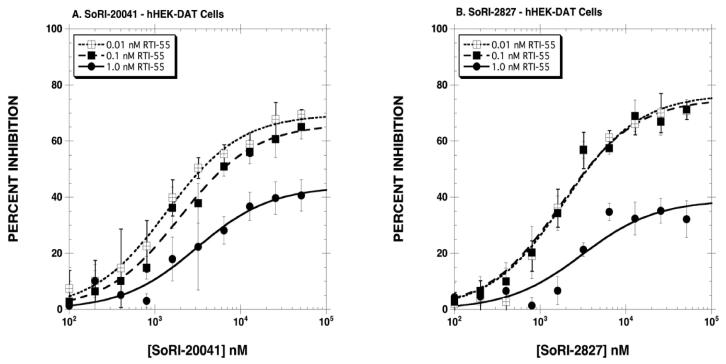
The first series of experiments determined the inhibitory effect of SoRI-20040, SoRI-20041 and SoRI-2827, in comparison to cocaine, on [125I]RTI-55 binding to hDAT. As reported in Fig. 2A, cocaine inhibited [125I]RTI-55 binding in classical dose-dependent manner, and the dose-response curve shifted to the right as the concentration of [125I]RTI-55 increased from 0.01 nM to 0.1 and 1 nM. The extrapolated EMAX values were ∼100% for all three concentrations of [125I]RTI-55. In contrast, the inhibition curves observed for the SoRI-compounds were atypical (Table 1, Figs. 2,3). For example, all three agents partially inhibited [125I]RTI-55 binding, with EMAX values decreasing as the concentration of [125I]RTI-55 increased. Using 1.0 nM [125I]RTI-55, we observed the following EMAX values: SoRI-20040 (62%), SoRI-20041 (44%) and SoRI-2827 (39%). Additionally, as reported in Table 1, the EC50 values of SoRI-2827 (Fig. 3B) did not significantly shift to the right as observed with cocaine.
Figure 2.
Inhibition of [125I]RTI-55 binding to hDAT by cocaine (Panel A) and SoRI-20040 (Panel B). Three concentrations of [125I]RTI-55 were each displaced by 10 concentrations of cocaine or SoRI-20040. The data, expressed as percentage inhibition, were combined and analyzed for the best-fit estimates of the EMAX and EC50 (See Table 1) as described under Materials and Methods. Each point is the mean ± S.D. (n=3 for cocaine and n=4 for SoRI 20040).
Table 1.
SoRI-Analogs Partially Inhibit DAT Binding
| Cocaine | EC50 (nM) | EMAX (%) |
|---|---|---|
| 0.01 nM [125I]RTI-55 | 290±18 | 101±2 |
| 0.11 nM [125I]RTI-55 | 439±43* | 102±3 |
| 1.0 nM [125I]RTI-55 | 985±175*† | 98±6 |
| SoRI-2827 | ||
| 0.01 nM [125I]RTI-55 | 1922±390 | 77±4 |
| 0.11 nM [125I]RTI-55 | 1765±267 | 75±3 |
| 1.0 nM [125I]RTI-55 | 3080±1245 | 39±4*† |
| SoRI-20040 | ||
| 0.01 nM [125I]RTI-55 | 1559±247 | 87±3 |
| 0.11 nM [125I]RTI-55 | 1786±319 | 81±4 |
| 1.0 nM [125I]RTI-55 | 2969±344*† | 62±2*† |
| SoRI-20041 | ||
| 0.01 nM [125I]RTI-55 | 1377±144 | 69±2 |
| 0.11 nM [125I]RTI-55 | 1983±270* | 66±2 |
| 1.0 nM [125I]RTI-55 | 3077±795*† | 44±3*† |
[125I]RTI-55 binding to membranes prepared from hDAT HEK cells was conducted as described in Methods. Ten point inhibition curves were generated for each test drug using three concentrations of [125I]RTI-55. The data were transformed to percent inhibition and fit to the dose-response curve for the best-fit estimates of the EC50 and EMAX, using Kaleidagraph (Version 3.6.4). All curves were an n=4, except for cocaine (n=3). Each value is ±SD.
p<0.05 when compared to the 0.01 nM [125I]RTI-55 condition.
p<0.05 when compared to the 0.11 nM [125I]RTI-55 condition. Students t-test.
Figure 3.
Inhibition of [125I]RTI-55 binding to hDAT by SoRI-20041 (Panel A) and SoRI-2827 (Panel B). Three concentrations of [125I]RTI-55 were each displaced by 10 concentrations of SoRI-20041 or SoRI-2827. The data, expressed as percentage inhibition, were combined and analyzed for the best-fit estimates of the EMAX and EC50 (See Table 1) as described under Materials and Methods. Each point is the mean ± S.D. (n=4).
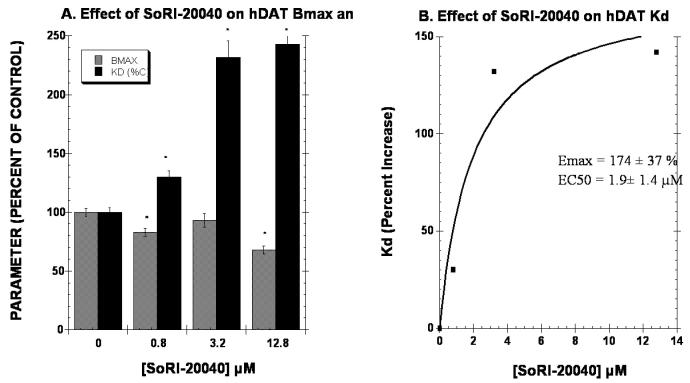
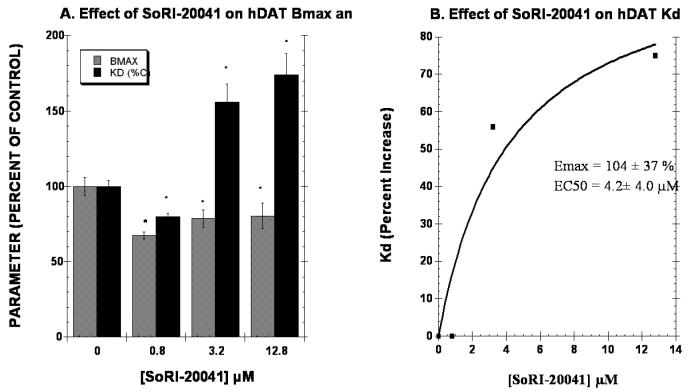
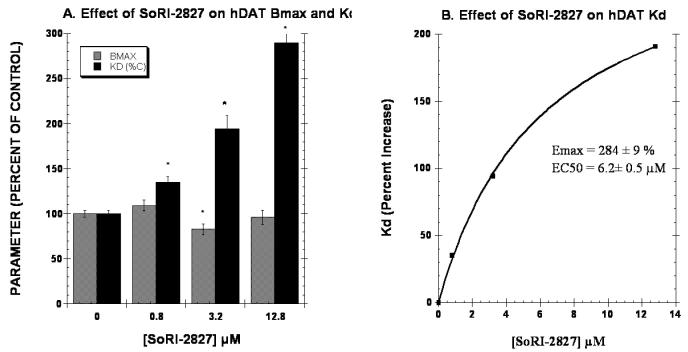
The second series of experiments determined the effect of 3 concentrations of test agent on the Kd and BMAX of the hDAT as measured with [125I]RTI-55. It is expected that increasing the concentration of a competitive inhibitor would have no effect on the Bmax, but would increase the apparent Kd linearly according to the equation, Kd(apparent) = Kd × (1 + [I]/KI). As reported in Fig. 4A, 0.8 μM and 12.8 μM SoRI-20040 significantly reduced the BMAX by 17% and 32%, respectively. SoRI-20040 also increased the apparent Kd in a dose-dependent manner that was well described by a sigmoidal dose-response curve, rather than the linear curve expected of a competitive inhibitor. SoRI-20041 (Fig. 5) significantly decreased the BMAX at all three test concentrations, and also increased the apparent Kd a dose-dependent manner which was also well-described by a sigmoidal dose-response curve. Similar results were observed for SoRI-2827, except that this compound decreased the BMAX only at the 3.2 μM concentration (Fig. 6).
Figure 4.
Effect of SoRI-20040 on the hDAT BMAX and Kd. Two concentrations of [125I]RTI-55 (0.01 nM and 1.0 nM) were each displaced by ten concentrations of RTI-55 (0.01 nM to 102 nM) in the absence and presence of the indicated concentrations of SoRI-20040. The data of three independent experiments were pooled and fit to a one site binding model for the best-fit estimates of the Kd and BMAX. Panel A. Effect of SoRI-20040 on the Kd and BMAX values expressed as a percent of control (±SD). Panel B. Percent increase in the Kd value produced by SoRI-20040. The Kd data in Panel A were fit to a one site binding model for the best-fit estimates of the EC50 and EMAX (±SD). * p<0.05 when compared to control (Students t-test).
Figure 5.
Effect of SoRI-20041 on the hDAT BMAX and Kd. Two concentrations of [125I]RTI-55 (0.01 nM and 1.0 nM) were each displaced by ten concentrations of RTI-55 (.01 nM to 102 nM) in the absence and presence of the indicated concentrations of SoRI-20041. The data of three independent experiments were pooled and fit to a one site binding model for the best-fit estimates of the Kd and BMAX. Panel A. Effect of SoRI-20041 on the Kd and BMAX values expressed as a percent of control (±SD). Panel B. Percent increase in the Kd value produced by SoRI-20041. The Kd data in Panel A were fit to a one site binding model for the best-fit estimates of the EC50 and EMAX (±SD). * p<0.05 when compared to control (Students t-test).
Figure 6.
Effect of SoRI-2827 on the hDAT BMAX and Kd. Two concentrations of [125I]RTI-55 (0.01 nM and 1.0 nM) were each displaced by ten concentrations of RTI-55 (.01 nM to 102 nM) in the absence and presence of the indicated concentrations of SoRI-2827. The data of three independent experiments were pooled and fit to a one site binding model for the best-fit estimates of the Kd and BMAX. Panel A. Effect of SoRI-2827 on the Kd and BMAX values expressed as a percent of control (±SD). Panel B. Percent increase in the Kd value produced by SoRI-2827. The Kd data in Panel A were fit to a one site binding model for the best-fit estimates of the EC50 and EMAX (±SD). * p<0.05 when compared to control (Students t-test).
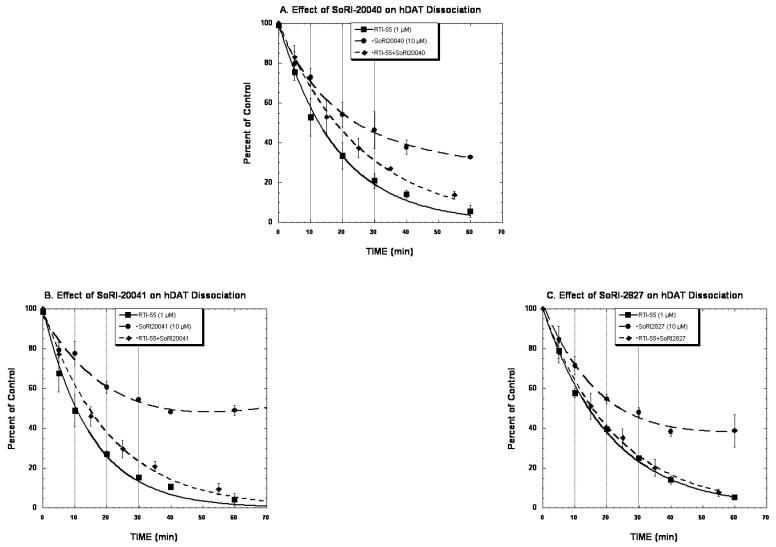
The next series of experiments determined the effect of the SoRI agents on the dissociation kinetics of [125I]RTI-55 binding to hDAT. Table 2 reports the experimental design used for these experiments. Briefly, addition of RTI-55 (1 μM) initiated the dissociation of [125I]RTI-55 binding, after which test drugs were added so that any effect of the test agent could not be due to an effect at the transporter binding site, as these were pre-bound with RTI-55. As reported in Fig. 7A and Table 3, the dissociation of [125I]RTI-55 from hDAT initiated by 1 μM RTI-55 proceeded in a monotonic manner and was well described by a single component dissociation model (K-1 = 0.055±0.002 min-1). The addition of SoRI-20040 after the addition of RTI-55 significantly slowed the dissociation rate (K = 0.038±0.001 min-1). The dissociation of [125I]RTI-55 initiated by the addition of SoRI-20040 alone was well described by a two component dissociation model. The dissociation rate of the “A1” component (K-2=0.059±0.029) was similar the dissociation rate observed in the RTI-55 condition. The dissociation rate of the “A2” component (k-1 = 0.0047±0.013) was quite slow and had a large SD. A similar pattern of results was observed for SoRI-20041, except that the addition of SoRI-20041 alone resulted in a zero dissociation rate for the “A2” component reflecting the trend for an increased level of binding at the 60 min point (Fig. 7B). Unlike SoRI-20040 and SoRI-20041, SoRI-2827 did not influence the dissociation rate of [125I]RTI-55 from hDAT (Fig. 7C, Table 3).
Table 2.
Experimental Design for Kinetic Dissociation Experiments
| Condition | 1st Addition (Time 0) | 2nd Addition (Time 10 min) |
|---|---|---|
| 1. Control | none | None |
| 2. RTI-55 | RTI-55 (1μM) | None |
| 3. Test Drug | none | Test Drug: SoRI-20040 (10 μM) or SoRI-20041 (10 μM) or SoRI-2827 (10 μM) |
| 4. RTI-55 + Test Drug | RTI-55 (1μM) | Test Drug: SoRI-20040 (10 μM) or SoRI-20041 (10 μM) or SoRI-2827 (10 μM) |
Binding of [125I]RTI-55 (0.01 nM) to hDAT proceeded for 2 hr at 25° C. At this point (Time 0), RTI-55 (1 μM) was added to conditions 2 and 4. Ten minutes later, test drugs were added to conditions 3 and 4. For the purpose of data analysis, the 100% of control point was “time 0 min” for conditions 1 and 2, and “time 10 min” for conditions 3 and 4. Each data point is the mean±SD of three experiments. The data were fit to a one (condition 1, 2 4) or two-component (condition 3) exponential decay model using KaleidaGraph version 3.6 to calculate the kinetic constants.
Figure 7.
Effect of SoRI 20040, SoRI 20041, and SoRI 2827 on the dissociation of [125I]-RTI55 binding from hDAT. Membranes were incubated with 0.01 nM [125I]-RTI55 for 2 hours at 25°C. At this point, baseline samples were filtered, and then RTI 55 (1 μM) was added to samples 2 and 4. Ten minutes later, test drug was added to samples 3 and 4 to generate the following conditions: control (no addition, sample 1), RTI-55 (1 μM, sample 2), test drug (10 μM, sample 3), and RTI55 (1 μM) + test drug (10 μM, sample 4). For the purpose of data analysis, the 100% of control point was “time 0 min” for conditions 1 and 2, and “time 10 min” for conditions 3 and 4. Samples were then filtered at the indicated time points. The data of conditions 2 and 4 were fit to a one component dissociation model and the data of condition 3 was fit to a two component dissociation model (see Tables 2 and 3). Each point is mean ± SD(n=3).
Table 3.
Effect of SoRI-Compounds on the Dissociation of [125I]RTI-55 from hDAT
| Condition | One Component Fit K-1 (min-1) | Two Component Fit |
|---|---|---|
| A. SoRI-20040 | ||
| RTI-55 | 0.055±0.002 | |
| SoRI-20040 | A1 = 57±35 K-1 = 0.059±0.036 A2 = 41±36 K-2= 0.0047±0.013 |
|
| RTI-55 + SoRI-20040 | 0.038±0.001* | |
| B. SoRI-20041 | ||
| RTI-55 | 0.066±0.003 | |
| SoRI-20041 | A1 = 51±17 K-1 = 0.063±0.026 A2 = 46±18 K-2= 0±0.006 |
|
| RTI-55 + SoRI-20041 | 0.038±0.001* | |
| C. SoRI-2827 | ||
| RTI-55 | 0.048±0.001 | |
| SoRI-2827 | A1 = 67±19 K-1 = 0.064±0.022 A2 = 36±20 K-2= 0±0.008 |
|
| RTI-55 + SoRI-2827 | 0.044±0.001 | |
Dissociation experiments were conducted as described in Table 2 and Methods. Each parameter is ±SD.
p<0.05 when compared to the RTI-55 condition (Students t-test).
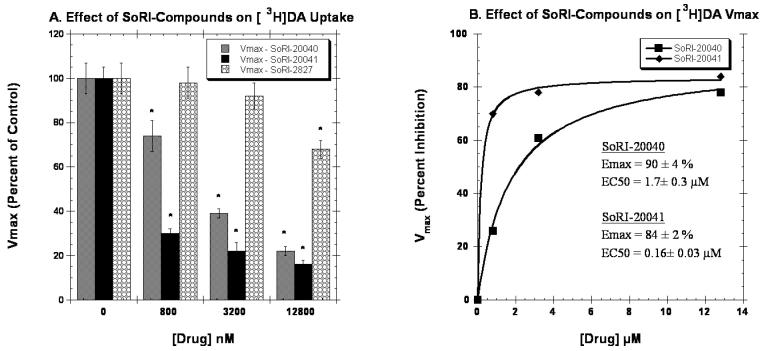
We next determined the effect of the SoRI-compounds on [3H]DA uptake by rat caudate synaptosomes. As reported in Table 4, the SoRI-compounds partially inhibited [3H]DA uptake with EMAX values ranging from 68% to 78%, and EC50 values ranging from 1770 nM to 3120 nM. In contrast, indatraline and GBR12909 did not partially inhibit [3H]DA uptake. All three SoRI-compounds inhibited [3H]DA uptake in a manner inconsistent with competitive inhibition (Fig. 8, Table 5). SoRI-20040 increased the apparent KM by ∼35% at all three doses tested and decreased the VMAX in a dose-dependent manner. As reported in Fig. 8B, the EC50 value for SoRI-20040 decreasing the VMAX was 1.7 μM, with an EMAX value of 90%. Similar results were observed for SoRI-20041, except that the lowest concentration of SoRI-20041 tested (0.8 μM) had already decreased the VMAX by 70%. The estimated EC50 value for SoRI-20041 was 0.16 μM. SoRI-2827, in contrast to the other agents, was less potent at decreasing the VMAX.
Table 4.
SoRI-Analogs Partially Inhibit [3H]DA Uptake Binding
| EC50 (nM) | EMAX (%) | |
|---|---|---|
| GBR12909 | 8.8±1.5 | 120±7* |
| Indatraline | 6.6±0.6 | 105±2 |
| SoRI-20040 | 3120±580 | 68±3* |
| SoRI-20041 | 1770±130 | 77±1* |
| SoRI-2827 | 2385±440 | 78±4* |
[3H]DA uptake into striatal synaptosomes was conducted as described in Methods. Ten point inhibition curves for were generated for each test drug using 5 nM [3H]DA. The data were transformed to percent inhibition and fit to the dose-response curve for the best-fit estimates of the EC50 and EMAX, using Kaleidagraph (Version 3.6.4). All curves were an n=3. Each value is ±SD.
p<0.05 when compared to indatraline (Students t-test).
Figure 8.
Effect of SoRI-compounds on the VMAX of [3H]DA uptake in rat brain. Two concentrations of [3H]DA (2.0 nM and 20 nM) were each displaced by ten concentrations of DA (2 nM to 4096 nM) in the absence and presence of the indicated concentrations of test compounds. The data of three independent experiments were pooled and fit to a one site binding model for the best-fit estimates of the KM and VMAX. Panel A. Effect of SoRI-compounds on the VMAX values expressed as a percent of control (±SD). Panel B. Percent increase in the VMAX values produced by SoRI-compounds. The VMAX data in Panel A were fit to a one site binding model for the best-fit estimates of the EC50 and EMAX (±SD). * p<0.05 when compared to control (Students t-test).
Table 5.
SoRI Compounds Noncompetitively Inhibit [3H]DA Uptake
| Condition | VMAX (Percent of Control) | Apparent KM (nM) |
|---|---|---|
| A. SoRI-20040 | ||
| Control | 100±7 | 36.8±1.4 |
| 0.8 μM | 74±7* | 50.7±2.2* |
| 3.2 μM | 39±2* | 48.6±3.0* |
| 12.8 μM | 22±2* | 50.4±5.0* |
| B. SORI-20041 | ||
| Control | 100±5 | 52.9±3.0 |
| 0.8 μM | 30±2* | 65.7±5.1* |
| 3.2 μM | 22±4* | 78.5±8.9* |
| 12.8 μM | 16±2* | 87.4±9.0* |
| C. SORI-2827 | ||
| Control | 100±7* | 41.7±2.1 |
| 0.8 μM | 98±7 | 72.1±2.3* |
| 3.2 μM | 92±6 | 89.8±3.5* |
| 12.8 μM | 68±4* | 84.6±5.6* |
Uptake binding surfaces were generated as described in Methods in the absence and presence of the indicated concentrations of test drugs. The data of 3 experiments (132 data points) were pooled and fit to the one component uptake equation for the best-fit estimates of the Vmax and Km. Each value is ±SD, n=3.
p<0.01 (F-test).
Cocaine and indatraline are competitive inhibitors of [3H]DA uptake. Using indatraline as a control drug, we assessed the effect of the SoRI-compounds on cocaine-induced inhibition of [3H]DA uptake. As reported in Table 6, 7 nM indatraline reduced specific [3H]DA uptake to 31 percent of control, and increased the IC50 of cocaine from 278 nM to 894 nM. SoRI-20040 (12.8 μM) reduced specific [3H]DA uptake to 43 percent of control, and produced a much smaller increase in the IC50 value of cocaine (450 nM) than indatraline did. Similar results were obtained with SoRI-20041 and SoRI-2827.
Table 6.
Effect of Test Agents on Cocaine-Induced Inhibition of [3H]DA Uptake by Striatal Synaptosomes
| Drug | IC50 (nM±SD) | Specific Uptake1 (% of Control±SD) |
|---|---|---|
| Cocaine (n=6, 60 data points) | 278±9 | 100 |
| Cocaine+SoRI-20040 (12.8 μM) (n=3, 30 data points) | 402±30* | 43±10 |
| Cocaine+SoRI-20041 (12.8 μM) (n=3, 30 data points) | 450±20* | 27±4 |
| Cocaine+SoRI-2827 (12.8 μM) (n=3, 30 data points) | 582±45* | 44±6 |
| Cocaine+Indatraline (7 nM) (n=3, 30 data points) | 894±100* | 31±7 |
Ten point cocaine inhibition curves (50 - 5052 nM) were generated using 2 nM [3H]DA in the absence and presence of the indicated test agents. The data of several independent experiments were pooled and fit to the two parameter logistic equation for the best-fit estimate of the IC50 (±SD).
Each test agent reduced specific [3H]DA uptake and the degree of reduction is reported as a percent of control.
p<0.05 when compared to the IC50 of cocaine (Students t-test).
Table 7.
Effect of Test Agents on D-Amphetamine-Induced Release of [3H]MPP+ via the Dopamine Transporter
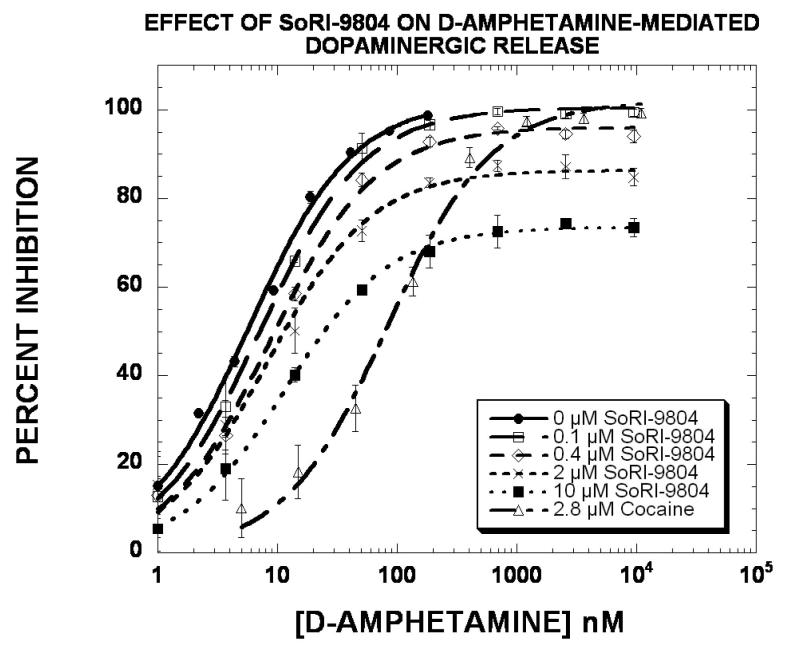
| Drug | EC50 (nM±SD) [Ke, nM] | EMAX (%±SD) |
|---|---|---|
| Experiment 1 (Fig. 9) | ||
| D-AMPH | 5.8±0.4 | 102±2 |
| +SoRI-9804 (0.1 μM) | 7.2±0.4* | 100±0.8 |
| +SoRI-9804 (0.4 μM) | 8.7±0.6* | 96±1* |
| +SoRI-9804 (2.0 μM) | 8.3±1.0* | 86±2* |
| +SoRI-9804 (10 μM) | 11.5±0.4* | 73±0.5* |
| +Cocaine (2.8 μM) | 82±9* | 102±2 |
| Experiment 2 (Fig. 10) | ||
| D-AMPH | 6.5±0.3 | 103±1 |
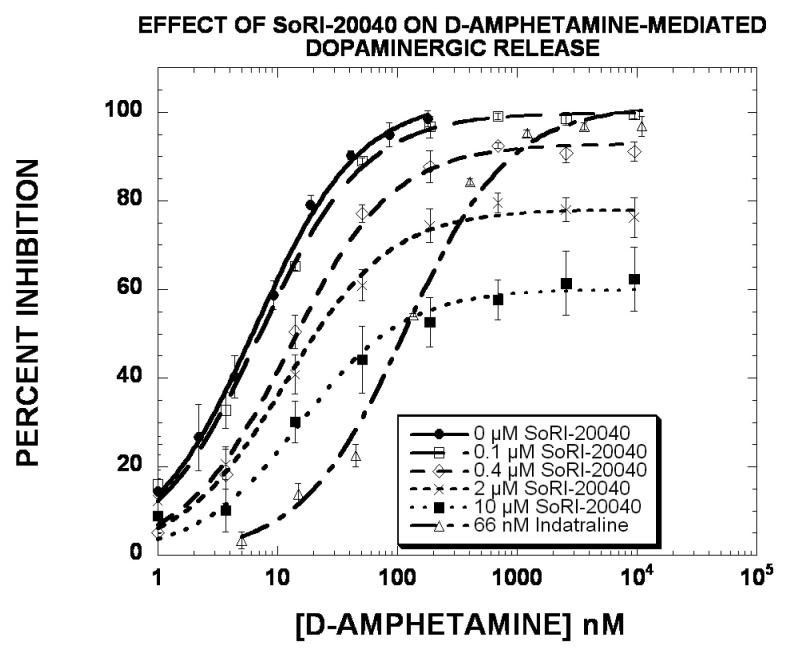
| +SoRI-20040 (0.1 μM) | 7.1±0.4 | 100±0.9 |
| +SoRI-20040 (0.4 μM) | 12.4±0.9* | 93±1.1* |
| +SoRI-20040 (2.0 μM) | 11.6±1.5* | 78±2* |
| +SoRI-20040 (10 μM) | 15.7±2.5* | 60±2* |
| +Indatraline (66 nM) | 116±14* | 101±3 |
Eight point dose-response curves were generated using 5 nM [3H]MPP+ in the absence and presence of the indicated test agents. The data of three independent experiments were pooled (24 data points) and fit to the dose-response equation for the best-fit estimate of the EC50 and EMAX (±SD).
p<0.05 when compared to the value of the control condition (Students t-test).
In light of the profound effect of the SoRI-compounds on the VMAX of [3 H]DA uptake (Table 5), we determined the effect of these agents on D-amphetamine-induced release of [3H]MPP+ from striatal dopamine nerve terminals (Rothman and Baumann, 2006). As reported in Fig. 9 and Table 7, D-amphetamine produced a dose-dependent release of [3H]MPP+, with an EC50 value of ∼6 nM and an EMAX value of 100%. Cocaine (2.8 μM) shifted the D-amphetamine curve to the right (EC50 = 82 nM) without altering the EMAX value. SoRI-9804 produced a dose-dependent decrease in the EMAX value, resulting in an EMAX value of 73% with the 10 μM dose. Similar results were obtained with SoRI-20040 (Fig. 10 and Table 7). In these experiments, indatraline (66 nM) shifted the D-amphetamine curve to the right (EC50 = 116 nM) without altering the EMAX value. SoRI-20040 produced a dose-dependent decrease in the EMAX value, resulting in an E value of 60% with the 10 μM dose. At 10 μM, SoRI-9804 did not affect [3H]MPP+ release and SoRI-20040 had a minimal effect (∼15%). The effects of SoRI-20041 and SoRI-2827 on D-amphetamine-induced release of [3H]MPP+ are more complex than observed for SoRI-9804 and SoRI-20040 (data not shown) and will be published in due course.
Figure 9.
Effect of SoRI-9804 and cocaine on D-amphetamine induced DAT-mediated release of [3H]MPP+. Eight point dose-response curves were generated using 5 nM [3H]MPP+ in the absence and presence of the indicated test agents. The data of three independent experiments were pooled (24 data points) and fit to the dose-response equation for the best-fit estimate of the EC50 and EMAX (±SD) (Table 7).
Figure 10.
Effect of SoRI-20040 and indatraline on D-amphetamine induced DAT-mediated release of [3H]MPP+. Eight point dose-response curves were generated using 5 nM [3H]MPP+ in the absence and presence of the indicated test agents. The data of three independent experiments were pooled (24 data points) and fit to the dose-response equation for the best-fit estimate of the EC50 and EMAX (±SD) (Table 7).
Discussion
Based on our experience screening hundreds of compounds in biogenic amine transporter binding assays (Prisinzano et al., 2004), most agents inhibited rat brain DAT binding with slope factors (Hill coefficients) close to 1, a finding strongly suggestive of a binding process governed by simple mass action kinetics. SoRI-9804 was the first compound we came across that inhibited [125I]RTI-55 binding to DAT in a qualitatively different manner (Rothman et al., 2002). As observed in this study with SoRI-20040, SoRI-20041 and SoRI-2827, SoRI-9804 partially inhibited DAT binding and [3H]DA uptake. We reported previously on other compounds that allosterically modulate SERT (Nandi et al., 2004; Nightingale et al., 2005).
Early hints of allosteric interactions at the biogenic amine transporters included our finding that pre-treatment of guinea pig membranes with paroxetine increased the dissociation rate of [3H]cocaine from SERT (Akunne et al., 1992). Using rat SERT expressed in HEK cells, Sur et al. (Sur et al., 1998) presented evidence that imipramine allosterically modulated the ability of citalopram to inhibit [3H]5-HT transport. Others reported apparent allosteric interactions between 5-HT and [3H]paroxetine binding to human platelet SERT (Andersson and Marcusson, 1989) and between β-estradiol and SERT (Chang and Chang, 1999). More recently, we reported novel allosteric modulators of both DAT (Rothman et al., 2002) and SERT (Nandi et al., 2004), and Chen et al. reported evidence for allosteric modulation of [3H]-S-citalopram binding (Chen et al., 2005).
Several lines of evidence support the hypothesis that SoRI-20040, SoRI-20041 and SoRI-2827 allosterically modulate hDAT. First, all three agents partially inhibit [125I]RTI-55 binding to hDAT. The partial inhibition is most apparent with the higher concentrations of [125I]RTI-55. In this case, the EMAX values range from 39% inhibition for SoRI-2827 to 62% for SoRI-20040. We observed similar results for the partial inhibition of mu opioid receptor binding by Salvinorin A (Rothman et al., 2007). These observations suggest that the fractional occupation of the receptor by the radioligand affects the ability of the allosteric drug to displace binding. Second, all three SoRI-compounds affected the Kd and BMAX of [125I]RTI-55 binding to hDAT in a manner unlike that of a competitive inhibitor. All three agents decreased the BMAX, and increased the apparent Kd value in a dose-dependent manner (Figs. 3-6) (mixed inhibition model). The dose response curves were well described by a sigmoidal dose-response curve, rather than the linear curve expected of a competitive inhibitor. The low micromolar EC50 values for increasing the apparent Kd (Figs. 4-6) were similar to the EC50 values for inhibition of [125I]RTI-55 binding to hDAT (Table 1).
The dissociation experiments provide a third line of evidence indicating that the SoRI-20040 and SoRI20041 allosterically modulate hDAT (Fig. 7). Dissociation experiments are classically used to detect allosteric effects, specifically comparing the dissociation rate observed when dissociation is initiated by dilution versus the addition of an excess of a competing ligand. However, as described in our previous work (Nandi et al., 2004), the dilution method does not work in the case of the hDAT binding assay, since re-association of the radioligand occurs during the dissociation experiment. Thus, we determined the ability of a test agent to alter [125I]RTI-55 dissociation initiated by the addition of 1 μM RTI-55. The test agents were added 10 min after the RTI-55, insuring that any effect observed could not be due to interactions at the RTI-55 hDAT binding site (see Table 2). As reported in Table 3, SoRI-20040 and SoRI-20041, but not SoRI-2827, slowed the dissociation rate, clear evidence of an allosteric effect. The addition of the SoRI compounds in the absence of RTI-55 resulted in biphasic dissociation curves, the faster component of which (“A1”) was similar to that observed with the addition of RTI-55. Since these compounds do not completely inhibit [125I]RTI-55 binding, the simplest explanation of the biphasic dissociation curves is that these compounds initiated a more rapid dissociation (K-1) followed by a much slower (K-2) dissociation and a reassociation of [125I]RTI-55 binding.
The [3H]DA uptake experiments provide the fourth line of evidence that SoRI-20040, SoRI-20041, and perhaps, SoRI-2828 are allosteric modulators of DAT. All three compounds increased the apparent KM in a non-linear fashion. For example, SoRI-20040 increased the KM from 36.8 nM to ∼50 nM at all three concentrations tested (0.8 μM, 3.2 μM, 12.8 μM). Only one compound (SoRI-20041) increased the KM in a dose-dependent manner. In this case, the data were well described by a sigmoidal dose-response curve with an EC50 value of 1.6±0.02 μM and an EMAX value of 73±0.2% (data not shown). All three SoRI-compounds decreased the VMAX of [3H]DA uptake. SoRI-20040 and SoRI-20041 decreased the VMAX in a dose-dependent manner (Fig. 8). Interestingly, with an EC50 value of 0.16 μM, SoRI-20041 was especially potent at decreasing the VMAX.
Finally, the experiments reported in Figs. 9-10 and Table 7 strongly suggest that SoRI-9804 and SoRI-20040 do not interact with DAT in a competitive manner. Cocaine and indatraline, competitive inhibitors at DAT, shifted the d-amphetamine dose response curve for releasing preloaded [3H]MPP+ via DAT to the right without altering the EMAX value. In contrast, 10 μM SoRI-9804 (Fig. 9) and 10 μM SoRI-20040 (Fig. 10), which by themselves had minimal effects on [3H]MPP+ release, substantially decreased the EMAX value for the D-amphetamine dose-response curve with minimal changes in the EC50 value. These data indicate that SoRI-9804 and SoRI-20040 act as partial inhibitors of D-amphetamine-induced DAT-mediated [3H]MPP+ release. Similar data were obtained using [3H]DA instead of [3H]MPP+ (data not shown). To our knowledge, such partial inhibitors of DAT-mediated release have not been reported.
In summary, various studies over the years hint of an allosteric binding site associated with the biogenic amine transporters. The data presented here indicate that SoRI-20040 and SoRI-20041 allosterically modulate DAT, and that SoRI-2827 interacts with DAT in a manner not consistent with that of simple competitive inhibitor. Our study therefore presents strong evidence for such an allosteric modulatory site and identifies novel partial inhibitors of DAT-mediated dopamine release. Such partial inhibitors, by reducing the effects of amphetamine, might be of use in the treatment of methamphetamine dependence.
Acknowledgements
HEK cells expressing hDAT were kindly provided by Dr. Randy Blakely (Vanderbilt University School of Medicine). The hDAT cells originate in the laboratory of Dr. Marc Caron (Duke University Medical Center).
This work was supported by the Intramural Research Program, National Institute on Drug Abuse, NIH, DHHS.
List of non-standard abbreviations
- SoRI-20040
N-(2,2-Diphenylethyl)-2-phenyl-4-quinazolinamine
- SoRI-20041
N-(3,3-Diphenylpropyl)-2-phenyl-4-quinazolinamine
- SoRI-2827
[4-Amino-6-[(diphenylmethyl)amino]-5-nitro-2-pyridinyl]carbamic acid ethyl ester
- SoRI-9804
N-(Diphenylmethyl)-2-phenyl-4-quinazolinamine
- SoRI-6238
[5-amino-3-(3,4-dichlorophenyl)-1,2-dihydropyrido[3,4-b]pyrazin-7-yl]carbamic acid ethyl ester
- RTI-55
3β-(4′-iodophenyl)tropan-2β-carboxylic acid methyl ester
- TB-1-099
4-(2-[bis(4-fluorophenyl)methoxy]ethyl)-1-(2-trifluoromethyl-benzyl)-piperidine
- GBR12909
1-[2-[bis(4-fluorophenyl)methoxy]ethyl]-4-(3-phenylpropyl)piperazine
- [125I]RTI-55
3β-(4′-125iodophenyl)tropan-2β-carboxylic acid methyl ester
- hSERT
cloned human 5-hydroxytryptamine transporter
- hNET
cloned human norepine phrine transporter
- hDAT
cloned human dopamine transporters
References
- Akunne HC, de Costa BR, Jacobson AE, Rice KC, Rothman RB. [3H]Cocaine labels a binding site associated with the serotonin transporter in guinea pig brain: allosteric modulation by paroxetine. Neurochem.Res. 1992;17:1275–1283. doi: 10.1007/BF00968412. [DOI] [PubMed] [Google Scholar]
- Andersson A, Marcusson J. Inhibition and dissociation of [3H]-paroxetine binding to human platelets. Neuropsychobiology. 1989;22:135–140. doi: 10.1159/000118607. [DOI] [PubMed] [Google Scholar]
- Chang AS, Chang SM. Nongenomic steroidal modulation of high-affinity serotonin transport. Biochim Biophys Acta. 1999;1417:157–166. doi: 10.1016/s0005-2736(98)00255-7. [DOI] [PubMed] [Google Scholar]
- Chen F, Larsen MB, Neubauer HA, Sanchez C, Plenge P, Wiborg O. Characterization of an allosteric citalopram-binding site at the serotonin transporter. J Neurochem. 2005;92:21–28. doi: 10.1111/j.1471-4159.2004.02835.x. [DOI] [PubMed] [Google Scholar]
- Christopoulos A, Kenakin T. G protein-coupled receptor allosterism and complexing. Pharmacol Rev. 2002;54:323–374. doi: 10.1124/pr.54.2.323. [DOI] [PubMed] [Google Scholar]
- Gorman JM, Kent JM. SSRIs and SMRIs: broad spectrum of efficacy beyond major depression. J.Clin.Psychiatry. 1999;60(Suppl 4):33–38. [PubMed] [Google Scholar]
- Nandi A, Dersch CM, Kulshrestha M, Ananthan S, Rothman RB. Identification and characterization of a novel allosteric modulator (SoRI-6238) of the serotonin transporter. Synapse. 2004;53:176–183. doi: 10.1002/syn.20048. [DOI] [PubMed] [Google Scholar]
- Nightingale B, Dersch CM, Boos TL, Greiner E, Calhoun WJ, Jacobson AE, Rice KC, Rothman RB. Studies of the Biogenic Amine Transporters. XI. Identification of a 1-[2-[Bis(4-fluorophenyl)methoxy]ethyl]-4-(3- phenylpropyl)piperazine ( GBR12909) Analog That Allosterically Modulates the Serotonin Transporter. J Pharmacol Exp Ther. 2005;314:906–915. doi: 10.1124/jpet.105.084376. [DOI] [PubMed] [Google Scholar]
- Prisinzano T, Rice KC, Baumann MH, Rothman RB. Development of Neurochemical Normalization ("Agonist Substitution") Therapeutics for Stimulant Abuse: Focus on the Dopamine Uptake Inhibitor, GBR12909. Current Medicinal Chemistry (CNSA) 2004;4:47–59. [Google Scholar]
- Rothman RB. Binding surface analysis: an intuitive yet quantitative method for the design and analysis of ligand binding studies. Alcohol.Drug.Res. 1986;6:309–325. [PubMed] [Google Scholar]
- Rothman RB, Baumann MH. Therapeutic potential of monoamine transporter substrates. Curr Top Med Chem. 2006;6:1845–1859. doi: 10.2174/156802606778249766. [DOI] [PubMed] [Google Scholar]
- Rothman RB, Baumann MH, Dersch CM, Romero DV, Rice KC, Carroll FI, Partilla JS. Amphetamine-type central nervous system stimulants release norepinephrine more potently than they release dopamine and serotonin. Synapse. 2001;39:32–41. doi: 10.1002/1098-2396(20010101)39:1<32::AID-SYN5>3.0.CO;2-3. [DOI] [PubMed] [Google Scholar]
- Rothman RB, Dersch CM, Carroll FI, Ananthan S. Studies of the biogenic amine transporters. VIII: identification of a novel partial inhibitor of dopamine uptake and dopamine transporter binding. Synapse. 2002;43:268–274. doi: 10.1002/syn.10046. [DOI] [PubMed] [Google Scholar]
- Rothman RB, Murphy DL, Xu H, Godin JA, Dersch CM, Partilla JS, Tidgewell K, Schmidt M, Prisinzano TE. Salvinorin A: allosteric interactions at the mu-opioid receptor. J Pharmacol Exp Ther. 2007;320:801–810. doi: 10.1124/jpet.106.113167. [DOI] [PubMed] [Google Scholar]
- Rothman RB, Reid AA, Mahboubi A, Kim C-H, de Costa BR, Jacobson AE, Rice KC. Labeling by [3H]1,3-Di(2-tolyl)guanidine of two high affinity binding sites in guinea pig brain: evidence for allosteric regulation by calcium channel antagonists and pseudoallosteric modulation by s ligands. Mol.Pharmacol. 1991;39:222–232. [PubMed] [Google Scholar]
- Rothman RB, Silverthorn ML, Glowa JR, Matecka D, Rice KC, Carroll FI, Partilla JS, Uhl GR, Vandenbergh DJ, Dersch CM. Studies of the biogenic amine transporters. VII. Characterization of a novel cocaine binding site identified with [125I]RTI-55 in membranes prepared from human, monkey and guinea pig caudate. Synapse. 1998;28:322–338. doi: 10.1002/(SICI)1098-2396(199804)28:4<322::AID-SYN8>3.0.CO;2-B. [DOI] [PubMed] [Google Scholar]
- Rothman RB, Vu N, Partilla JS, Roth BL, Hufeisen SJ, Compton-Toth BA, Birkes J, Young R, Glennon RA. In vitro characterization of ephedrine-related stereoisomers at biogenic amine transporters and the receptorome reveals selective actions as norepinephrine transporter substrates. J. Pharmacol. Exp. Ther. 2003;307:138–145. doi: 10.1124/jpet.103.053975. [DOI] [PubMed] [Google Scholar]
- Rudnick G, Clark J. From synapse to vesicle: the reuptake and storage of biogenic amine neurotransmitters. Biochimica et Biophysica Acta. 1993;1144:249–263. doi: 10.1016/0005-2728(93)90109-s. Review. [DOI] [PubMed] [Google Scholar]
- Sanchez C. Allosteric modulation of monoamine transporters - new drug targets in depression. Drug Discovery Today: Therapeutic Strategies. 2006;3:483–488. [Google Scholar]
- Schwartz TW, Holst B. Allosteric enhancers, allosteric agonists and ago- allosteric modulators: where do they bind and how do they act? Trends Pharmacol Sci. 2007;28:366–373. doi: 10.1016/j.tips.2007.06.008. [DOI] [PubMed] [Google Scholar]
- Sur C, Betz H, Schloss P. Distinct effects of imipramine on 5- hydroxytryptamine uptake mediated by the recombinant rat serotonin transporter SERT1. J Neurochem. 1998;70:2545–2553. doi: 10.1046/j.1471-4159.1998.70062545.x. [DOI] [PubMed] [Google Scholar]
- Zohar J, Westenberg HG. Anxiety disorders: a review of tricyclic antidepressants and selective serotonin reuptake inhibitors. Acta Psychiatr.Scand.Suppl. 2000;403:39–49. doi: 10.1111/j.1600-0447.2000.tb10947.x. [DOI] [PubMed] [Google Scholar]


