

Abstract
Inflammation including local accumulations of tumor necrosis factor alpha (TNFα) is a part of Alzheimer’s disease (AD) pathology and may exacerbate age-related neurodegeneration. Most studies on TNFα and TNF neuronal receptors are conducted using embryonic neurons. Few studies consider age-related deficits that may occur in neurons. Age-related changes in susceptibility to TNFα through TNF receptor 1 (TNFR1) and receptor 2 (TNFR2) expression could increase susceptibility to β-amyloid (1-42, Abeta42). Evidence is conflicting about which receptor mediates survival and/or apoptosis. We determined how aging affects receptor expression in cultured adult rat cortical neurons. Old neurons were more susceptible to Abeta42 toxicity than middle-age neurons and the addition of TNFα was neuroprotective in middle-age, but exacerbated the toxicity from Abeta42 in old neurons. These pathologic and protective responses in old and middle-age neurons respectively correlated with higher starting TNFR1 and TNFR2 mRNA levels in old versus middle-age neurons. Middle-age neurons treated with TNFα plus Abeta42 did not show an increase in either TNFR1 or TNFR2 mRNA but old neurons showed an upregulation in TNFR2 mRNA and not TNFR1 mRNA. Despite these mRNA changes, surface immunoreactivity of both TNFR1 and TNFR2 increased with dose of TNFα in middle-age neurons. However, middle-age neurons treated with TNFα plus Abeta42 showed an upregulation in both TNFR1 and TNFR2 surface expression, whereas old neurons failed to upregulate surface expression of either receptor. These findings support the hypothesis that age-related changes in TNFα surface receptor expression contribute to the neuronal loss associated with inflammation in AD.
Keywords: Inflammation, Alzheimer’s disease, Cortical Neurons, Immunocytochemistry, TNFα
Introduction
The Inflammatory response in the brain of Alzheimer’s disease (AD) patients may exacerbate neurodegeneration (Akiyama et al., 2000). AD is marked by over-expression of certain cytokines and other inflammatory molecules, but these changes in brain chemistry happen after plaques and tangles have developed (Maes et al., 1999; Meda et al., 1995). It is unclear whether age-related responses to the early inflammatory processes contribute to disease development and/or progression.
Epidemiological studies suggest that nonsteroidal anti-inflammatory drugs (NSAIDS) reduce the risk of AD. Clinical trials suggest target specificity. Indomethacin (Rogers et al., 1993) and diclofenac (Scharf et al., 1999) trials showed positive results, but rofecoxib and naproxen trials failed (Aisen et al., 2003). Furthermore, in APP transgenic mice, ibuprofen reduced amyloid plaque numbers, reduced activated microglia, and reduced IL-β1 levels (Lim et al., 2000) at least partly by altering APP processing (Weggen et al., 2003). These studies lead to questions of how inflammation affects AD progression.
Increasing basic science and clinical data implicate tumor necrosis factor alpha (TNFα) in AD pathology. A prospective pilot study of 15 AD patients given a TNFα antagonist, etanercept for 6 months showed significant improvement in 3 cognitive tests instead of the decline seen for untreated patients (Tobinick et al., 2006). However, no studies have addressed the issue of how aging affects TNF receptor function and/or expression. Mice with transgenes for human APPSwe, human tauP301L, and presenilin 1 (PS1M146V), showed a 10-fold increase in TNFα RNA before noticeable plaque buildup at 3 months and 14-fold at 6 months (Janelsins et al., 2005). AD patients carrying the TNFα -308 A/G polymorphism and the apolipoproteinE (APOE) 4 allele had a lower mean age of AD onset (Lio et al., 2006). AD brain microglia produce 1.5 times more TNFα than age-matched controls (Lue et al., 2001).
TNFα binds to two receptors in the tumor necrosis factor receptor superfamily: TNFR1 (with a death domain) and TNFR2 (no death doman, MacEwan, 2002). There are two pathways initiated when TNFα binds to TNFR1; one leads to apoptosis and the other to cell survival. TNFα mediates cell survival via the activation of NFκB (Mattson et al., 1997). Apoptosis is mediated via TNF receptor death domain and subsequent activation of caspases (Micheau and Tschopp, 2003). Studies using TNFR1 and TNFR2 knockouts show conflicting results and do not take into account any compensatory mechanisms that may be activated when either receptor is not expressed (Gary et al., 1998; Kim et al., 2001; Fontaine et al., 2002; Yang et al., 2002).
To understand TNF receptor function in AD, we first need to understand age-related changes to the TNFα system. There is little data regarding TNFα in old or middle-age brains. Most in vitro studies use murine or rat embryonic neurons or measure inflammatory cytokine levels in cerebral spinal fluid (CSF) of AD patients and age-matched controls. Here, we used neurons isolated from middle-age and old rats as a culture model of brain aging (Brewer, 1998; Patel & Brewer, 2003; Brewer et al., 2005; 2006) to examine age-related changes to neuronal TNFα receptors. This age-related neuron culture model is able to control hormonal, inflammatory, and vascular variables that otherwise confound neuron responses. Our results show that age was a factor in cell survival when neurons were exposed to Abeta42 and increasing concentrations of TNFα. We hypothesized that in neurons exposed to Abeta42, additional exposure to TNFα would cause an age-related failure to up-regulate TNFR1 and TNFR2 at the cell surface that detrimentally affects neuron survival. We provide evidence for our hypothesis from immunocytology and semi-quantitative PCR for TNFR1 and TNFR2 mRNA in neurons cultured from middle-age and old rats, near their median lifespan.
Materials and Methods
Adult neurons
Cortical neurons were isolated from 10 month old (middle-age) and 24 month old (old) male rats (Fisher 344, Harlan, Indianapolis, IN; Brewer, 1997; Brewer and Torricelli, 2007). Isoflurane (Baxter, Deerfield, IL) was used to anaesthetize the animals. Rats were decapitated and their brains removed. The cortices were isolated in Hibernate A (www.BrainBitsLLC.com)/ 2% B27/0.5 mM Glutamax (Invitrogen, Carlsbad, CA) and chopped into 500 μm slices (McIwain tissue chopper, Mickle Laboratory Engineering, Guilford, UK). Next, the tissue was placed in 5 ml Neurobasal A/ 2% B27/0.5 mM Glutamax for 8 min in a shaking water bath at 30°C. The tissue was then treated with 2 mg/ml papain (Worthington, Lakewood, NJ) for 30 min in a shaking water bath at 30°C. The cortical tissue was triturated 3 times. Using two 4 ml density gradients of Optiprep (Sigma, St. Louis, MO), neurons were separated from other non-neuronal cells by centrifugation at 800 × g for 15 min. Fractions containing neurons were collected and mixed with 5 ml of Hibernate A/2% B27/0.5 mM Glutamax and centrifuged at 200 × g for 2 min. The supernatant was aspirated and the pellet was resuspended in 5 ml of Hibernate A/2% B27/0.5 mM Glutamax and centrifuged a third time at 200 × g for 2 min. The pellet was resuspended in 8 ml of Neurobasal A/2% B27/0.5 mM Glutamax and viable cells counted by trypan blue exclusion. Cells were plated in Neurobasal A medium supplemented with 2% B27/0.5 mM Glutamax, 1 μg/ml Gentamycin (Invitrogen) and 5 ng/ml human fibroblast growth factor 2 (FGF2, Invitrogen). Neurons were cultured on glass coverslips (Carolina Biologicals, Burlington, NC) coated with 100 μg/ml poly-d-lysine (Sigma)., They were plated at a density of 32,000 cells/cm2 on either 1 cm2 for imaging or 12 cm2 glass cover slips for western blots. Adult cultures were incubated at 37°C in 5% CO2 and 9% O2 (Thermo-Forma, Waltham, MA) until 8-10 days in vitro. Cultures immunostained with neuronal and glial markers showed more than 80% of the cell population positive for the neuronal marker neurofilament (Brewer, 1997; Patel & Brewer, 2003).
Treatment of middle-age and old culture
Cultures were treated with TNFα (Peprotech, Rocky Hill, NJ) and/or fibrllar Abeta (1-42; US Peptides, Rancho Cucamonga, CA). Fibrillar Abeta42 was prepared by dissolving solid peptide in water at 2.5 mM and diluting in Dulbecco’s phosphate-buffered saline (dPBS, Invitrogen) to a final concentration of 0.5 mM. Next the Abeta42 was incubated for 3 days at 37°C for aggregation before use (Simmons et al., 1994). To begin treatment (day 1) adult cortical cultures were placed in fresh medium containing Neurobasal A/B27/Glutamax and TNFα (10 ng/ml to 1 μg/ml). The cells were incubated for 24 hr at 37 °C in 5% CO2 and 9% O2. After 24 hr, 10 μM fibrillar Abeta42 was added to the cultures and incubated for another 24 hr at 37 °C in 5% CO2 and 9% O2. On day 3, cultures were either used in viability assays, fixed for immunocytochemistry, lysed for RNA isolation or protein collection for westernblot.
Viability assay
After two days of treatment as described above, on the third day, viability was assessed using fluorescein diacetate and propidium iodide to stain live and dead cells respectively as follows. Coverslips were rinsed twice in warm Hank’s balance salt solution (HBSS, Invitrogen). Cells were incubated in HBSS containing 15 μg/ml fluorescein diacetate and 4.6 μg/ml propidium iodide for 12 min. They were rinsed once with HBSS and pictures were taken using an epifluorescence microscope under 20x objective with B1A520 and G1B580 filters (Nikon, Melville, NY) and a digital SPOT camera (Diagnostic Instruments, Sterling Heights, MI). All rinses were saved to count any dead cells that detached from the coverslips. The percentage of dead cells was determined by dividing the total dead cells (numerator) by the number of total cells. Twelve microscopic fields were counted for live and dead cells per condition. To eliminate bias, 3 consecutive fields were photographed from each of the 4 coverslips per condition.
RNA isolation, Reverse Transcription and Polymerase Chain Reaction (PCR)
Middle-age and old cortical cultures were treated with 100 ng/ml TNFα only, 10 μM Abeta42 only, or 100 ng/ml TNFα and 10 μM Abeta42 together. RNA isolation and 1st strand synthesis were performed using Cells-to-cDNA kit (Ambion, Austin, TX) as directed by the manufacturer. After RNA isolation, RNA was quantified using Ribogreen quantitation kit (Molecular Probes, Eugene, OR). One microgram of total RNA was reverse transcribed in 40 μl per condition. From this reaction, 2 μl of cDNA was amplified using Platinum Quanitative PCR supermix-UDG (Invitrogen) in 25 μl volume. Carboxyfluorescein (FAM) labeled light upon extension (LUX) primers were purchased for TNFR1 (Invitrogen, RLUX3602749), and TNFR2 forward primer: 5′ TGCTCTAAGTCTGGCCTCCTCA 3′, TNFR2 reverse primer: 5′ cgggtGCAGTCATTGTTCAGACCcG 3′, and β-actin primers (Invitrogen, 101M-01). The PCR conditions were 50°C for 2 min for uracil DNA glycosylase incubation, 95°C for 2 min hotstart activation of DNA polymerase, 50 cycles at 95 °C for 30 s, 64°C for 20 s, 72°C for 30 s, followed by melting curve analysis. Samples were cooled to 62°C and heated slowly until they reached 95°C. The relative change in mRNA levels between control (untreated cultures) and all experimental conditions was measured using the formula 2 ˆ (Ct target gene control - Ct β-actin gene) - (Ct target gene experimental conditions - Ct β-actin gene). Cycle threshold (Ct) is the intersect of the baseline fluorescence and logarithmic amplification. Changes in mRNA for TNFR1 and TNFR2 were expressed as relative fold change from untreated middle-age neurons. Real-time PCR product size was verified by melting curve analysis and electrophoresis on a 2% agarose gel stained with SYBR Green (Molecular Probes; data not shown).
Immunocytochemistry
Neurons were treated as described above and then fixed in 4% paraformaldehyde, blocked with 5% normal goat serum (NGS, Invitrogen,), and 0.5% TX-100 (Sigma) in PBS. Staining of TNFR1 was not detected without the addition of 0.5% TX-100. Antibodies were diluted in 5% NGS and 0.05% TX-100 in PBS. Primary antibodies for extracellular domains of TNFR1 (from hamster IgG, diluted 1:300, R and D Systems, Minneapolis, MN) and extracellular TNFR2 (from rabbit IgG, diluted 1:400, Stressgen, San Diego, CA) were added to the neurons for overnight incubation at 4°C. Both antibodies react to rat receptors. Twenty-four hours later, after 2 rinses with PBS, secondary antibodies Cy3 goat anti-hamster IgG (Jackson Immuno Research, West Grove, PA) and Alexa fluor 488 goat anti-rabbit (Molecular Probes, Eugene, OR) were added for 60 min at room temperature. Coverslips were rinsed and mounted onto a clean glass microscope slide with Aquamount (Fisher). These mounted slides were imaged using a Nikon epifluorescence microscope under 60 x objectives with B1A520 and G1B580 filters and a digital SPOT camera. All images were taken at a set exposure time and gain. Twelve microscopic fields were photographed per condition. To eliminate bias, 6 consecutive fields were photographed from each of the 2 coverslips per condition. The images were analyzed for fluorescent density at constant threshold using Image-Pro Software (Media Cybernetics, Silver Springs, MD).
Western blotting
Cell extracts with nuclei removed were used to quantify TNFR1 and TNFR2 protein levels. In preliminary attempts to isolate a membrane fraction, yields were too low for immunodetection of TNF receptors. Middle-age and old cortical cultures on 12 cm2 coverslips were treated with 100 ng/ml TNFα only, 10 μM Abeta42 only, or 100 ng/ml TNFα and 10 μM Abeta42 together. Cell extracts (Dignam et al., 1983) were prepared in buffer A (10 mM Hepes, pH 7.9, 1.5 mM MgCl2, 10 mM KCl, 0.5 mM dithiothretol (DTT), 0.2% nonidet P 40 (NP-40), and protease inhibitor cocktail (Sigma)). The cells were scraped off coverslips in Buffer A, vortexed for 15 s, and incubated on ice for 10 min. Next, 10% NP-40 was added to each tube (final NP-40 =1%), vortexed for 5 s, incubated on ice for 1 min, and centrifuged at 16,000 × g for 5 min. The membrane containing supernatant was collected and protein was quantitated using Micro BCA protein assay kit (Pierce). Ten micrograms of protein were electrophoresed on a 10% acrylamide gel and transferred to nitrocellulose membrane. The membrane was blocked in 5% skim milk (DIFCO, Detroit, MI) in Tris-buffered saline with 0.1% Tween-20 (TBST) overnight at 4°C, and then incubated with rabbit primary antibodies for TNFR1 (Stressgen), TNFR2 (Stressgen), and β-actin (Sigma) overnight at 4°C. After four 5 min washes in TBST, membranes were incubated with secondary antibody conjugated to goat anti-rabbit horseradish peroxidase (Chemicon, Temecula, CA) for 1 hr at room temperature. The membrane was washed 4 times in TBST, treated with Supersignal West Pico Chemiluminescent Substrate (Pierce) and visualized using a charged-coupled device (CCD) camera (Hitachi Genetic Systems, MiraiBio Inc., Alameda, CA). Bands were quantified using Image-Pro Plus software.
Statistical Analysis
All values were averaged and standard errors computed per experiment using Microsoft Excel. Analysis of variance and post hoc tests were conducted using SAS for Windows (Cary, NC). All experiments were analyzed using ANOVA followed by Student’s t-test.
Results
Cortical neurons were isolated from Fisher344 rats of two ages, middle-age (10 months) and old (24 months) near the median life span of this strain (Solleveld et al., 1984), and sustained under common culture conditions. The 10 month old adult rat represents a 40 year human and the 24 month old adult rat represents an 80 year old human. Prior results indicted age-related toxicity of Abeta40 alone (Brewer, 1998) and in combination with TNFα (Viel et al., 2001). We repeated these experiments with better characterized and more important fibrillar Abeta 1-42, known to be more critical for AD pathogenesis (Pike et al., 1991; Lorenzo and Yankner 1994). At 9 days in vitro, neurons were treated with increasing concentrations of TNFα for 24 hr, followed by 10 μM Abeta42 for another 24 hr. Figure 1 shows that the percentage of dead cells was similar for untreated middle-age and old neurons (p=0.71) and those treated with TNFα alone (p=0.43). TNFα alone was not toxic to either middle-age or old neurons at any of the concentrations used. Both middle-age and old neurons treated with 10 μM Abeta42 alone showed a significant increase in cell death (MA: p<0.001; Old: p <0.0001) compared to untreated neurons. Middle-age and old neurons treated with Abeta42 and 10 ng/ml TNFα showed a similar cell death percentage as those treated with Abeta42 alone. However, for the old neurons treated with Abeta42 and increasing concentrations of TNFα, neuron death continued to rise. In contrast, middle-age neurons actually showed a decrease in cell death at 100 ng/ml TNFα plus 10 μM Abeta42. The protective effect was reversed at higher TNFα. Results from ANOVA indicated a significant effect of age (p<10-5) and an interaction effect of age and treatment (p <0.01).
Fig. 1.
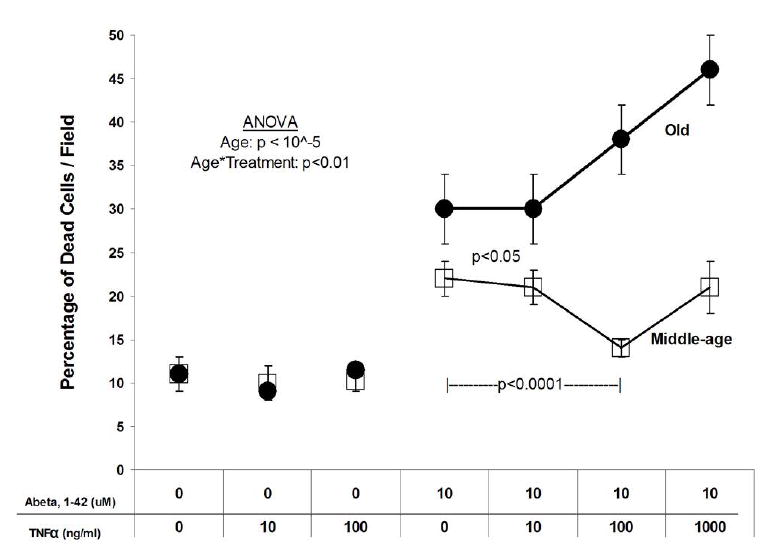
Percentage of cell death. Middle-age (square) and old (circle) cortical neurons treated with 10 μM Abeta42 and increasing concentrations of TNFα. Controls are neurons that were not treated with either TNFα or Abeta42. Both ages have a low percentage of cell death (~ 10%) when the cells are untreated or treated only with 10-100 ng/ml TNFα. Old neurons treated with Abeta42 have significantly greater cell death than middle-age neurons, and increase in a dose dependent manner with TNFα. Middle-age neurons do not show a significant increase in cell death with increasing concentrations of TNFα. Results represent means ± SEM of 3 independent experiments (n=36 fields). ANOVA shows an effect of age (p < 10-5) and an interaction effect of age and treatment (p< 0.01).
To determine if an age-related up-regulation in TNFR1 gene expression (with death domain) correlates with the higher cell death percentages seen in old neurons compared to middle-age neurons, we quantitated TNFR1 and TNFR2 mRNA. Four experimental conditions were examined per age: untreated, 100 ng/ml TNFα, 10 μM Abeta42, and 100 ng/ml TNFα plus 10 μM Abeta42 that was neuroprotective for middle-age neurons, but neurotoxic for old neurons. Untreated middle-age neuron TNFR1 and TNFR2 mRNA were considered the baselines to which all other experimental conditions were compared. Untreated old neurons showed a 3-fold increase in both TNFR1 (p=0.03) and TNFR2 (p=0.04) mRNA relative to untreated middle-age neurons (Fig. 2A, B). When TNFα alone was added, middle-age neurons non-significantly up-regulated expression of TNFR1 mRNA two fold and old neurons down-regulated TNFR1 mRNA (Fig. 2A). When exposed to Abeta42 alone, middle-age and old neurons showed a 4.5 fold increase in TNFR1 mRNA (p=0.04), but the elevated baseline levels in untreated old neurons did not change. For TNFR2 mRNA (Fig. 2B), the addition of TNFα, non-significantly increased TNFR2 mRNA in middle-age neurons, but levels in old neurons did not change. When Abeta42 was added, middle-age neurons did not change TNFR2 mRNA levels compared to untreated controls, old neurons decreased TNFR2 mRNA levels (p=0.05). For either age, the addition of Abeta42 tended toward more TNFR1 mRNA production than TNFR2 mRNA but the effect was not statistically different (Middle-age: p=0.21, n=9; Old: p=0.11, n=11).
Fig. 2.
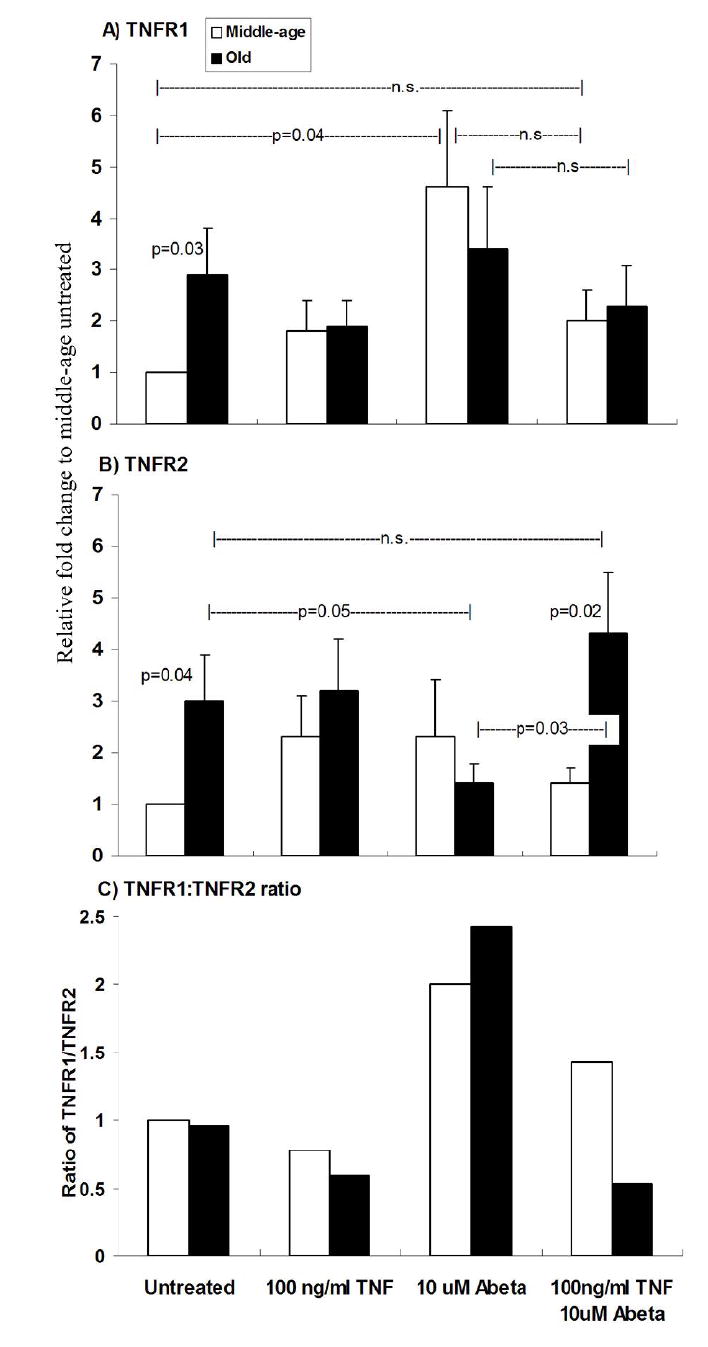
Real-time RT-PCR of TNFR1 and TNFR2 from middle-age and old neurons. Middle-age and old neurons were treated with TNFα and/or Abeta42 and total RNA was isolated. Controls are neurons that were not treated with either TNFα or Abeta42. Results were normalized to beta-actin and relative fold change of mRNA was compared to middle-age untreated mRNA. A) Untreated old neurons have a 3 fold increase in TNFR1 mRNA compared untreated middle-age neurons (p=0.03). For all other treatments middle-age and old are not significantly different. Abeta42 treated middle-age neurons have a 4 fold increase to compared to untreated middle-age (p=0.04). B) Untreated old neurons have a 3 fold increase in TNFR2 mRNA compared to untreated middle-age neurons (p=0.04). Also, TNFα and Abeta42 treated old neurons significantly increase TNFR2 mRNA than middle-age neurons with the same treatment (p=0.02) and Abeta42 treated old neurons (p=0.03). Abeta42 treated old neurons decrease TNFR2 mRNA compared to untreated old neurons (p=0.05). C) TNFα plus Abeta42 treated old neurons show a drop in TNFR1 mRNA: TNFR2 mRNA ratio compared to middle-age. Results represent mean ± SEM of 4 independent experiments.
The combination of 100 ng/ml TNFα plus 10 μM Abeta42 failed to significantly reduce TNFR1 mRNA levels in middle-age or old neurons compared to untreated levels or levels after treatment with TNFα alone (Fig. 2A; Middle-age, p=0.14; Old, p =0.12). However, the same combination treatment caused TNFR2 mRNA levels (Fig. 2B) in old neurons to increase relative to treatment with Abeta42 alone (p=0.03) and remain 3-fold higher than middle-age neurons (p=0.02). Figure 2C shows the ratio of TNFR1 to TNFR2 mRNA as a function of treatment and age. Untreated and TNFα treated middle-age and old neurons maintained similar ratios of TNFR1 to TNFR2 mRNA. However, Abeta42 treated middle-age and old neurons showed a similar up-regulation with larger increases of TNFR1 relative to TNFR2 mRNA. The combination of TNFα plus Abeta42 treatment of middle-age neurons slightly decreased the TNFR1:TNFR2 mRNA ratio relative to Abeta alone, but the same combination treatment of old neurons produced a large decline in the TNFR1:TNFR2 ratio.
To determine how well plasma membrane protein expression followed mRNA expression the density of TNFR1 and TNFR2 protein immunoreactivity on the cell surface was examined at the soma and at the dendrites. Based on the PCR data we expected that old neurons would increase surface TNFR1 and TNFR2 expression compared to middle-age neuron, but such a direct correlation depends on translational controls. Cortical neurons at 9 days in vitro were treated with increasing concentrations of TNFα for 24 hr, followed by 10 μM Abeta42 for another 24 hr similar to the viability experiment. Figures 3A-L show fluorescent images of TNFR1 and TNFR2 staining for both middle-age and old neurons at 11 days in vitro either untreated or treated with TNFα and Abeta42. Following treatment with the combination of TNFα and Abeta42, compared to untreated controls, these images show an upregulation of TNFR1 (G) and TNFR2 (K) in middle-age cells, but not in cells from old rats. Fig. 3M shows that most of these cells are neurons.
Fig. 3.
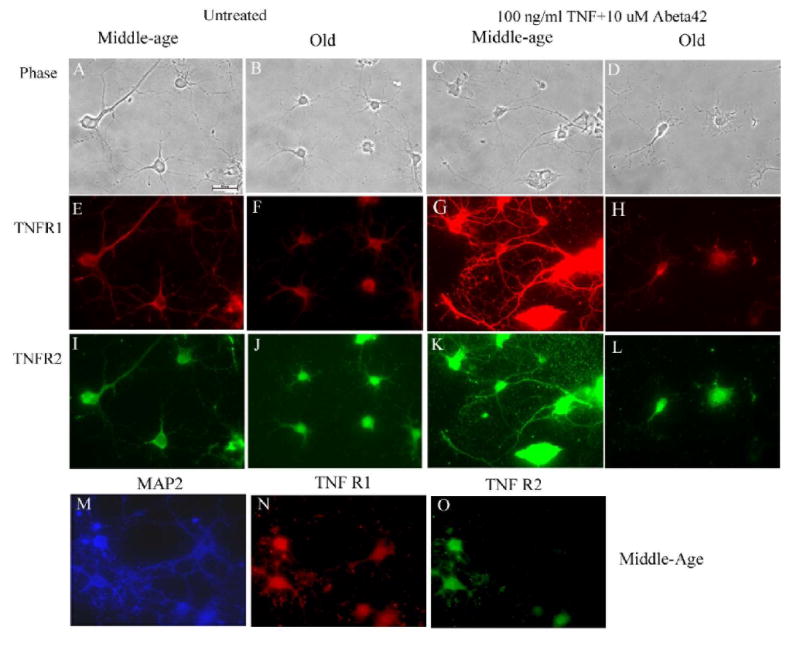
Phase contrast (A-D) and corresponding fluorescent (E-L) images of untreated controls and TNFα and Abeta42 treated cortical neurons stained with anti-TNFR1 and anti-TNFR2 in both middle-age (A, C, E, G, I, K) and old (B, D, F, H, J, L) rat neurons. Middle-age neurons treated with TNF + Abeta42 show an increase in TNFR1 and TNFR2 immunoreactivity compared to untreated controls. Old neurons do not show a change in immunoreactivity. To indicate the neuronal origin of these cells, another preparation of middle-age cells were stained for MAP2 (M, blue), TNFR1 (N, red) and TNFR2 (O, green). Scale bar in A is 10 μm.
We digitally analyzed immunoreactive mean density separately in the soma and dendrites. Digital analysis of TNFR1 on the soma (Fig. 4A) under baseline conditions shows similar fluorescent density values for middle-age and old neurons. Following treatment with TNFα, middle-age neuron immunoreactivity in the soma for TNFR1 increased (p=0.001) while that for old neurons decreased (p<0.0001) compared to untreated neurons. TNFα treated middle-age TNFR1 immunoreactivity increased over that of old neurons (p<0.0001). Abeta42 treatment of middle-age neurons showed no significant difference compared to untreated middle-age neurons, whereas the old neurons showed a decrease in TNFR1 immunoreactivity compared to untreated old neurons (p<0.0001). The TNFR1 immunoreactivity of middle-age neurons treated with Abeta42 was higher than that of old neurons (p<0.001; Fig 4A). The lowest concentration of 10 ng/ml TNFα combined with 10 μM Abeta42 treated middle-age neurons did not show a significant difference from somal TNFR1 immunoreactivity of untreated middle-age neurons. The immunoreactivity of old neurons declined when compared to untreated old neurons (p<0.0001, Fig. 4A). This combination also showed a significant somal TNFR1 density decrease of old over middle-age neurons (p<0.0001). The addition of a higher concentration of TNFα (100 ng/ml) plus Abeta42 to middle-age neurons caused a significant 2-fold increase in TNFR1 immunoreactivity compared to untreated control (p<0.0001). The somal TNFR1 immunoreactivity of old neurons with similar treatment was not different from untreated controls, but was significantly less than the elevated somal TNFR2 immunoreactivity. The addition of even higher TNFα (1 μg/ml) plus Abeta42 to middle-age neurons reduced the increase in TNFR1 immunoreactivity, but values remained higher than untreated control (p<0.0001). The somal TNFR1 immunoreactivity of old neurons remained significantly lower than untreated old neurons (p<0.0001) and significantly lower than middle-age somal TNFR1 immunoreactivity (p<0.001). Similar results were observed in the soma for TNFR2 (Fig. 4B) and in the processes for both receptors (Fig. 4C, D). In the soma and processes, after the addition of 100 ng/ml TNFα plus Abeta42 to middle-age neurons, the TNFR1 and TNFR2 fluorescent density values were upregulated compared to untreated controls. A more subtle difference was that old neurons treated with Abeta42 alone or in combination with TNFα produced lower TNFR1 density values than TNFR2 density values both in the soma (p<0.01) and process (p<0.05).
Fig. 4.
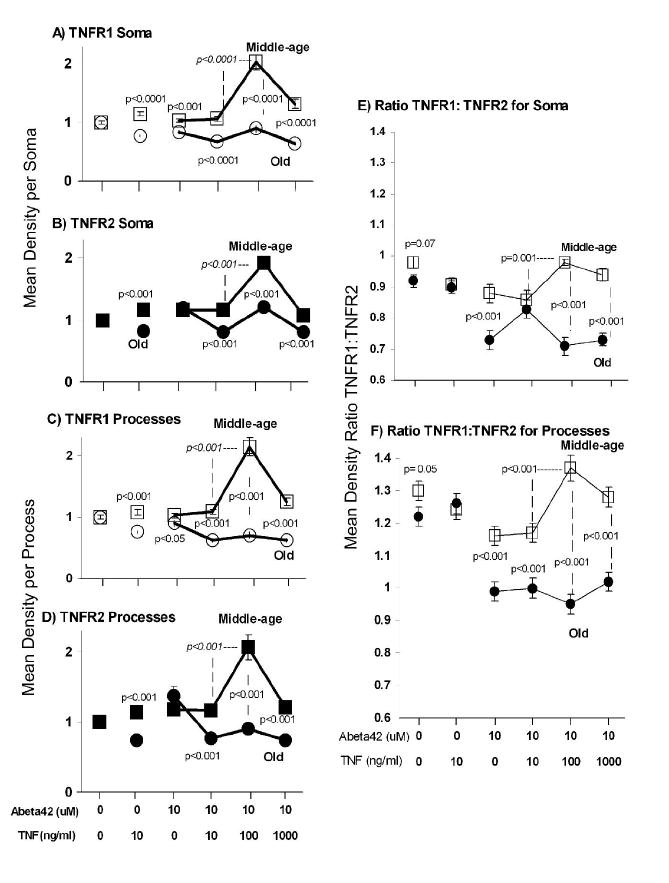
Surface TNFR1 and TNFR2 immunoreactivity for middle-age and old neurons. Middle-age TNFR1 (□), Middle-age TNFR2 (■), Old TNFR1 (○) Old TNFR2 (●) Controls were neurons not treated with either TNFα or Abeta42 A-D) Analysis of TNFR1 and TNFR2 immunoreactivity. P values are t-tests for middle-age versus old or (italics) Abeta42 treated middle-age neurons with either 10 ng/ml or 100 ng/ml TNFα. A) Mean middle-age and old TNFR1 somal densities. For treatment with either TNFα (10 ng/ml) or Abeta alone, middle-age neurons displayed greater density values for TNFR1 than old neurons. As the concentration of TNFα was increased from 10 to 100 ng/ml in the presence of Abeta, middle-age neurons show an increase in somal density values that was significantly greater than old neurons at the same treatment (p<0.0001). Fig. 4B, C, D show results similar to Fig 4 A. B) TNFR2 somal densities. C) TNFR1 process densities. D) TNFR2 process densities. E) Somal TNFR1:TNFR2 ratios. Relative to middle-age neurons, old neurons treated with Abeta42 have a lower TNFR1:TNFR2 ratio (p<0.001) and a much lower ratio in response to the two higher levels of TNFα + Abeta42 (p<0.001). The combination of Abeta42 and TNFα concentration above 10 ng/ml caused an increase in TNFR1:TNFR2 ratio in middle-age neurons, whereas old neurons showed a decrease. F) Process fiber TNFR1:TNFR2 ratios. Overall levels are higher in processes than soma for both ages. Comparisons between the ages show a marked decline in ratio for all treatments of old neurons with Abeta42 and a failure to upregulate the ratio at higher TNFα levels in old neurons like that in middle-age neurons. Results represent means ± SEM of 3 independent experiments (n=57-147 cells). ANOVA indicates a treatment effect for both middle-age (p<10-5) and old (p<10-5) neurons. Some error bars are smaller than symbols. Data for graphs A-D were normalized to untreated controls and data for graphs E-F were calculated using raw numbers. Middle-age neurons treated with TNF + Abeta42 increase surface TNFR1 and TNFR2 immunoreactivity compared to untreated controls, but old neurons fail to upregulate surface immunoreactivity in the soma and the processes. The ratios of TNFR1:TNFR2 show even larger differences in responses of old and middle-age neurons.
Computing the ratio of TNFR1:TNFR2 surface immunoreactivity (Fig. 4 E.F) emphasizes the point that the addition of Abeta42 to old neurons caused a decline in the TNFR1:TNFR2 ratio. Also, the addition of 100 ng/ml TNFα plus Abeta42 to middle-age neurons increased TNFR1:TNFR2 ratio both for the soma and the processes more than 10 ng/ml TNFα plus Abeta42. Either the decrease in TNFR1:TNFR2 ratio for old neurons and/or the increase in the ratio for middle-age neurons suggests that the ratio was an important factor in neuron survival. The failure of old neurons to upregulate their TNFR1:TNFR2 ratio correlated with higher neuron death than middle-age neurons.
We hypothesized that western blots of neuron extracts results would correlate with the above immunocytochemistry data. However, western blot results showed no difference between TNFR1 and TNFR2 levels (Fig. 5). The ratios of TNFR1:TNFR2 were similar between middle-age and old neurons for all experimental treatments (Fig. 5D). This indicated that total cellular protein levels, including intracellular protein, of either TNFR1 or TNFR2 were not decreased due to age but that old neurons were defective in surface expression of the receptors. The antibodies used for immunocytochemistry recognize extracellular epitopes, i.e., receptor expression at the membrane. Hence, it is possible for neurons to upregulate either receptor at the plasma membrane without actually changing total cellular protein.
Fig. 5.
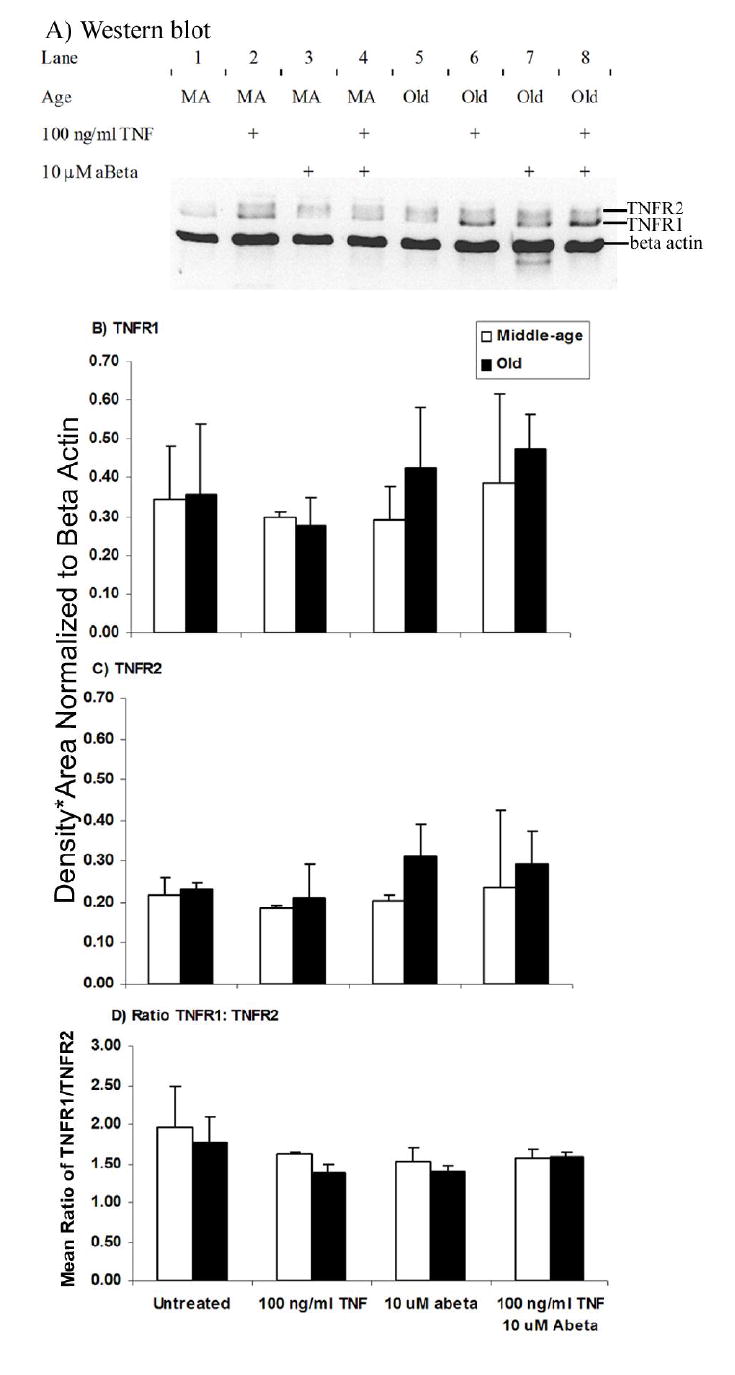
Western blot of TNFR1, TNFR2, and α-actin from cell extracts of cultured cortical neurons. Neurons that were not treated with TNFα or Abeta42 were considered controls. A) Lanes 1-4 are middle-age (MA) neurons and 5-8 are old neurons. Neurons were treated with TNFα and/or Abeta42 and cell extracts collected. Molecular weight of TNFR1 is 55 kD, TNFR2 is 75 kD, and β-actin is 46 kD. TNFR1 (B) and TNFR2 (C) protein is not significantly different between middle-age and old neurons. D) TNFR1: TNFR2 ratio show no statistically differences between middle-age and old neurons for all experimental conditions. Results represent mean ± standard deviation of 2 independent experiments.
Discussion
We extended previous results with Abeta(1-40) in cultured adult neurons (Viel et al., 2001), that Abeta42 plus TNFα was neuroprotective for middle-age neurons and dose-dependently toxic to old neurons. Our results showed that despite adequate mRNA and bulk protein levels of TNFR1 and TNFR2, surface expression of these receptors increased in middle-age neurons, but failed to increase in old neurons treated with TNFα + Abeta42. This surface upregulation in middle-age neurons correlated with survival while the failure to upregulate surface TNFR1 and TNFR2 in old neurons correlated with greater toxicity. The mechanisms underlying the regulation of mRNA or surface expression of TNFR1 and TNFR2 in response to Abeta42 alone or in combination with TNFα are not clearly understood, but we show that the interaction of TNFα and Abeta42 produced different responses depending on the concentration of TNFα and the age of animal from which neurons were removed.
In support of involvement of TNFR1 in Abeta toxicity, Li et al. (2004) showed that activation of the TNFR1 pathway is a necessary component of Abeta induced apoptosis in embryonic neurons and that increased TNFR1 expression increases neuron death from Abeta. But, since we observe higher TNFR1 mRNA in untreated old neurons than middle-age neurons (Fig. 2A), but no difference in viability (Fig. 1), the mechanism is likely to be more complex, with compensatory mechanisms in genetic models or at least different mechanisms in adult neurons. The equal surface expression of TNFR1 in untreated middle-age and old neurons supports the equal viability of these neurons, despite age-related differences in TNFR1 mRNA levels. However, treatment with Abeta42 alone increased TNFR1 mRNA, decreased TNFR2 mRNA, but left surface expression of these receptors relatively unchanged. Relative to Abeta treatment, the combined addition of TNF + Abeta42 resulted in increased TNFR2 mRNA levels in old neurons but a failure to upregulate surface expression of TNFR2. TNFR2 is capable of eliciting either a survival or cell death signal by competing with TNFR1 for RIP and TRAF (Fotin-Mleczek et al., 2002). By upregulating TNFR2 mRNA in the presence of Abeta and TNFα relative to Abeta alone, old neurons may be responding to low TNFR2 signaling at the cell membrane. We examined mRNA and protein expression on the cell surface of TNFR1 and TNFR2 to determine the basis of this age-related toxicity of TNFα. Although RNA levels in untreated old neurons are higher for TNFR1 and TNFR2, protein expression is not changed either globally or at the surface. Following Abeta treatment, TNFR1 and TNFR2 mRNA levels were upregulated for middle-age but down-regulated for old neurons. Further, the combination of TNFα + Abeta reversed this response. These results suggest complex age-related differences in signaling mechanisms. These age-related differences in mRNA regulation may be the first component of failed transcriptional regulation as we show in a follow-up study (Patel & Brewer, submitted).
In addition to these age and treatment-related differences in TNFR1 and TNFR2 mRNA levels, total cellular protein levels remained largely unchanged with age and treatment. Protein expression would not follow mRNA levels if translational controls and turnover differ with age or treatment. In yeast cells, mRNA and protein levels do not correlate for a number of genes (Gygi et al., 1999). Also tristetraprolin, a zinc finger protein, has been shown to destabilize TNFα mRNA (Carballo et al., 1998). Tristetraprolin or similar zinc finger proteins may also destabilize TNFR1 and TNFR2 mRNA depending on the treatment and age of neurons.
Viel et al. (2001) found that old microglia release more TNFα compared to middle-age and embryonic microglia after 48 h treatment with Abeta40. TNFα is both neurotoxic and neuroprotective with greater neurotoxicity against old neurons in response to Abeta40 (Viel et al., 2001). This response depends upon the concentration of TNFα. At lower concentrations (10-100 ng/ml) cell death was low and at high concentrations (>100 ng/ml) cell death was high. The apparent dichotomy of our results and those from other labs (Gary et al., 1998; Kim et al., 2001; Fontaine et al., 2002; Yang et al., 2002) shows the age and dose-dependence of survival on TNFα. In Fig. 1, we produced similar results to Viel et al. (2001) using Abeta42, instead of Abeta40. The question remains why are old neurons more susceptible to TNFα plus Abeta42 and why do they fail to increase TNFR1 and TNFR2 at the surface. Understanding this mechanism may provide insight into whether the use of a TNFα antagonist could decrease the progression of Alzheimer’s disease or exacerbate neurodegeneration.
Several groups have used TNFR1 and TNFR2 knockouts to define TNFR1 and TNFR2 roles in cell survival and apoptosis. The results were conflicting, suggesting that compensatory mechanisms of other cytokines may have affected the results obtained. Also, these studies did not consider aging affecting TNFR1 and TNFR2 function. The interaction between TNFR1 and TNFR2 and the signals that influence cell survival and apoptosis are not fully understood. Neurons from TNFR1-/- mice after spinal cord injury produced more apoptotic cells, larger lesions, and reduced functional recovery compared to wild type mice (Kim et al., 2001). This suggests that TNFR2 mediates apoptosis and TNFR1 inhibits apoptosis, however, similar results were found when experiments were repeated using TNFR2-/- mice (Kim et al., 2001). This means a more complex interaction exists between TNF receptors and downstream signaling molecules.
Hippocampal neurons and retinal cells from TNFR1-/- mice responded with decreased degeneration, whereas TNFR2-/- mice showed increased degeneration following retinal ischemia or TNFα addition (Gary et al., 1998; Fontaine et al., 2002; Yang et al., 2002). These studies suggest that TNFR2 elicits protective signals, whereas TNFR1 elicits apoptotic signals. These contradictory results imply other more complex mechanisms such as crosstalk between the receptors or cell-type specific responses are needed to explain the differences. The presence of both receptors does not necessarily mean one receptor stimulates one set of signals and the other attenuates those same signals. The sequence of receptor activation, health of the cells, and even the age of the cells could produce variations in responses. Fotin-Mleckzek et al. (2002) found greater cytotoxicity when TNFR2 was pre-stimulated through the use of a TNFR2 agonist in Hela cells. However, they also found that exclusive stimulation of TNFR1 by soluble TNFα was protective to cells. Either co-stimulation of both receptors or double receptor knockouts increased apoptosis (Bruce et al., 1996; Gary et al., 1998; Fotin-Mleckzek et al., 2002). TNFα receptor knockout experiments appear to be complicated by unknown compensatory mechanisms. Clearly the downstream signaling from these receptors needs to be evaluated. Therefore, the exact function of each receptor remains undetermined.
Under certain conditions both receptors are toxic, but both are also needed to protect cells from toxicity. The answer to which receptor mediates apoptosis and which receptor mediates cell survival may depend on TNFR1/TNFR2 ratios and receptor affinity for TNFα (Yang et al., 2002). TNFR2 has a lower affinity for TNFα of 1.14 nM compared to a Kd = 0.6 nM for TNFR1 (Yang et al., 2002). This suggests that TNFR2 becomes activated only at higher concentrations of TNFα. Also, only TNFR2 can be fully activated by membrane-bound TNFα, but not soluble TNFα (sTNF; Grell et al., 1995). The ratio of the receptors may produce a certain ratio of signaling that is more important than the individual levels of receptor expression.
Our findings of adequate cellular TNFR1 and TNFR2 protein and message despite altered surface expression suggest a problem in exocytosis of receptors in old neurons. Previously, we found old neurons, stressed with glutamate and mitochondrial inhibitors, were unable to upregulate surface expression of glucose transporter 3 (Patel and Brewer, 2003). The observed differences in immunocytology and western blot could be a failure to promote surface expression in old neurons. Together these results suggest a problem in exocytosis. There may be a problem in lipid raft movement of TNFR1. In rat brain, TNFR1 is distributed in lipid raft microdomains (Lotocki et al., 2004). During traumatic brain injury, TNFR1 is rapidly recruited into a microdomain, and a survival signaling complex is formed (Lotocki et al., 2004). In old neurons, a deficit in this mechanism could produce increased cell death and decreased immunoreactivity. Caveolin, an important protein in lipid raft protein-protein interactions, is reduced in 34 month old rat brains and specifically, in lipid rafts (Dremina et al., 2005). This reduction in caveolin could create deficits in TNFR1 recruitment to lipid rafts. Another possibility would be mitochondrial failure to provide energy for exocytosis in old neurons (Parihar and Brewer, 2007a).
Old neurons have several age-related deficits: upregulated caspase 3 activity, oxyradical-induced protein carbonyls (Brewer et al., 2005), deficits in demand-induced upregulation of glucose transport (Patel and Brewer, 2003), dysregulated Ca2+ responses (Brewer et al., 2006), chronically depolarized mitochondria, and elevated ROS production (Parihar and Brewer, 2007b). In combination with Abeta toxicity, we found additional detrimental effects from an inflammatory mediator, TNFα, in old neurons. Alzheimer’s disease has a strong inflammatory component (Akiyama et al., 2000) that could exacerbate cell death; therefore, finding interventions to promote the protective component of the inflammatory response in the brain could significantly slow down the progression of the disease. However, caution is necessary for the use of such intervention. The age of the person needs to be considered before administration of this drug. For middle-age rat neurons, moderate levels of TNF are neuroprotective, therefore, the use of interventions for middle-age individuals may actually be detrimental. Our results add mechanistic caution for interventional use of etaneracept (Tobinick et al., 2006) or target specific NSAIDS like indomethacin (Rogers et al., 1993) and ibuprofen for therapeutic interventions that may dampen any residual protective effects of TNF and thus promote pathology.
References
- Aisen PS, Schafer KA, Grundman M, Pfeiffer E, Sano M, Davis KL, Farlow MR, Jin S, Thomas RG, Thal LJ. Effects of rofecoxib or naproxen vs placebo on Alzheimer disease progression: a randomized controlled trial. JAMA. 2003;289:2819–2826. doi: 10.1001/jama.289.21.2819. [DOI] [PubMed] [Google Scholar]
- Akiyama H, Barger S, Barnum S, Bradt B, Bauer J, Cole GM, Cooper NR, Eikelenboom P, Emmerling M, Fiebich BL, Finch CE, Frautschy S, Griffin WS, Hampel H, Hull M, Landreth G, Lue L, Mrak R, Mackenzie IR, McGeer PL, O’Banion MK, Pachter J, Pasinetti G, Plata-Salaman C, Rogers J, Rydel R, Shen Y, Streit W, Strohmeyer R, Tooyoma I, Van Muiswinkel FL, Veerhuis R, Walker D, Webster S, Wegrzyniak B, Wenk G, Wyss-Coray T. Inflammation and Alzheimer’s disease. Neurobiol Aging. 2000;21:383–421. doi: 10.1016/s0197-4580(00)00124-x. [DOI] [PMC free article] [PubMed] [Google Scholar]
- Brewer GJ. Isolation and culture of adult rat hippocampal neurons. J Neurosci Methods. 1997;71:143–155. doi: 10.1016/s0165-0270(96)00136-7. [DOI] [PubMed] [Google Scholar]
- Brewer GJ. Age-related toxicity to lactate, glutamate, and beta-amyloid in cultured adult neurons. Neurobiol Aging. 1998;19:561–568. doi: 10.1016/s0197-4580(98)00091-8. [DOI] [PubMed] [Google Scholar]
- Brewer GJ, Lim A, Capps NG, Torricelli JR. Age-related calcium changes, oxyradical damage, caspase activation and nuclear condensation in hippocampal neurons in response to glutamate and beta-amyloid. Exp Gerontol. 2005;40:426–437. doi: 10.1016/j.exger.2005.03.007. [DOI] [PubMed] [Google Scholar]
- Brewer GJ, Reichensperger JD, Brinton RD. Prevention of age-related dysregulation of calcium dynamics by estrogen in neurons. Neurobiol Aging. 2006;27:306–317. doi: 10.1016/j.neurobiolaging.2005.01.019. [DOI] [PubMed] [Google Scholar]
- Brewer GJ, Torricelli JR. Isolation and culture of adult neurons and neurospheres. Nature Protocols. 2007;2:1490–1498. doi: 10.1038/nprot.2007.207. [DOI] [PubMed] [Google Scholar]
- Bruce AJ, Boling W, Kindy MS, Peschon J, Kraemer PJ, Carpenter MK, Holtsberg FW, Mattson MP. Altered neuronal and microglial responses to excitotoxic and ischemic brain injury in mice lacking TNF receptors. Nat Med. 1996;2:788–794. doi: 10.1038/nm0796-788. [DOI] [PubMed] [Google Scholar]
- Carballo E, Lai WS, Blackshear PJ. Macrophage tumor necrosis factor-α production by tristetraprolin. Science. 1998;281:1001–1005. doi: 10.1126/science.281.5379.1001. [DOI] [PubMed] [Google Scholar]
- Dignam JD, Lebovitz RM, Roeder RG. Accurate transcription initiation by RNA polymerase II in a soluble extract from isolated mammalian nuclei. Nucleic Acids Res. 1983;11:1475–1489. doi: 10.1093/nar/11.5.1475. [DOI] [PMC free article] [PubMed] [Google Scholar]
- Dremina ES, Sharov VS, Schoneich C. Protein tyrosine nitration in rat brain is associated with raft proteins, flotillin-1 and alpha-tubulin: effect of biological aging. J Neurochem. 2005;93:1262–1271. doi: 10.1111/j.1471-4159.2005.03115.x. [DOI] [PubMed] [Google Scholar]
- Fontaine V, Mohand-Said S, Hanoteau N, Fuchs C, Pfizenmaier K, Eisel U. Neurodegenerative and neuroprotective effects of tumor Necrosis factor (TNF) in retinal ischemia: opposite roles of TNF receptor 1 and TNF receptor 2. J Neurosci. 2002;22:RC216. doi: 10.1523/JNEUROSCI.22-07-j0001.2002. [DOI] [PMC free article] [PubMed] [Google Scholar]
- Fotin-Mleczek M, Henkler F, Samel D, Reichwein M, Hausser A, Parmryd I, Scheurich P, Schmid JA, Wajant H. Apoptotic crosstalk of TNF receptors: TNF-R2-induces depletion of TRAF2 and IAP proteins and accelerates TNF-R1-dependent activation of caspase-8. J Cell Sci. 2002;115:2757–2770. doi: 10.1242/jcs.115.13.2757. [DOI] [PubMed] [Google Scholar]
- Gary DS, Bruce-Keller AJ, Kindy MS, Mattson MP. Ischemic and excitotoxic brain injury is enhanced in mice lacking the p55 tumor necrosis factor receptor. J Cereb Blood Flow Metab. 1998;18:1283–1287. doi: 10.1097/00004647-199812000-00001. [DOI] [PubMed] [Google Scholar]
- Grell M, Douni E, Wajant H, Lohden M, Clauss M, Maxeiner B, Georgopoulos S, Lesslauer W, Kollias G, Pfizenmaier K. The transmembrane form of tumor necrosis factor is the prime activating ligand of the 80 kDa tumor necrosis factor receptor. Cell. 1995;83:793–802. doi: 10.1016/0092-8674(95)90192-2. [DOI] [PubMed] [Google Scholar]
- Gygi SP, Rochon Y, Franza BR, Aebersold R. Correlation between Protein and mRNA abundance in yeast. Mol Cell Bio. 1999;19:1720–1730. doi: 10.1128/mcb.19.3.1720. [DOI] [PMC free article] [PubMed] [Google Scholar]
- Janelsins MC, Mastrangelo MA, Oddo S, LaFerla FM, Federoff HJ, Bowers WJ. Early correlation of microglial activation with enhanced tumor necrosis factor-alpha and monocyte chemoattractant protein-1 expression specifically within the entorhinal cortex of triple transgenic Alzheimer’s disease mice. J Neuroinflammation. 2005;2:23. doi: 10.1186/1742-2094-2-23. [DOI] [PMC free article] [PubMed] [Google Scholar]
- Kim GM, Xu J, Xu J, Song SK, Yan P, Ku G, Xu XM, Hsu CY. Tumor necrosis factor receptor deletion reduces nuclear factor-kappaB activation, cellular inhibitor of apoptosis protein 2 expression, and functional recovery after traumatic spinal cord injury. J Neurosci. 2001;21:6617–6625. doi: 10.1523/JNEUROSCI.21-17-06617.2001. [DOI] [PMC free article] [PubMed] [Google Scholar]
- Lim GP, Yang F, Chu T, Chen P, Beech W, Teter B, Tran T, Ubeda O, Ashe KH, Frautschy SA, Cole GM. Ibuprofen suppresses plaque pathology and inflammation in a mouse model for Alzheimer’s disease. J Neurosci. 2000;20:5709–5714. doi: 10.1523/JNEUROSCI.20-15-05709.2000. [DOI] [PMC free article] [PubMed] [Google Scholar]
- Li R, Yang L, Lindholm K, Konishi Y, Yue X, Hampel H, Zhang D, Shen Y. Tumor necrosis factor death receptor signaling cascade is required for amyloid-β protein-induced neuron death. J Neurosci. 2004;24:1760–1771. doi: 10.1523/JNEUROSCI.4580-03.2004. [DOI] [PMC free article] [PubMed] [Google Scholar]
- Lio D, Annoni G, Licastro F, Crivello A, Forte GI, Scola L, Colonna-Romano G, Candore G, Arosio B, Galimberti L, Vergani C, Caruso C. Tumor necrosis factor-alpha -308A/G polymorphism is associated with age at onset of Alzheimer’s disease. Mech Ageing Dev. 2006;127:567–571. doi: 10.1016/j.mad.2006.01.015. [DOI] [PubMed] [Google Scholar]
- Lorenzo A, Yankner BA. Beta-amyloid neurotoxicity requires fibril formation and is inhibited by congo red. Proc Natl Acad Sci U S A. 1994;91:12243–12247. doi: 10.1073/pnas.91.25.12243. [DOI] [PMC free article] [PubMed] [Google Scholar]
- Lotocki G, Alonso OF, Dietrich WD, Keane RW. Tumor necrosis factor receptor 1 and its signaling intermediates are recruited to lipid rafts in the traumatized brain. J Neurosci. 2004;24:11010–11016. doi: 10.1523/JNEUROSCI.3823-04.2004. [DOI] [PMC free article] [PubMed] [Google Scholar]
- Lue LF, Rydel R, Brigham EF, Yang LB, Hampel H, Murphy GM, Jr, Brachova L, Yan SD, Walker DG, Shen Y, Rogers J. Inflammatory repertoire of Alzheimer’s disease and nondemented elderly microglia in vitro. Glia. 2001;35:72–79. doi: 10.1002/glia.1072. [DOI] [PubMed] [Google Scholar]
- Maes M, DeVos N, Wauters A, Demedts P, Maurits VW, Neels H, Bosmans E, Altamura C, Lin A, Song C, Vandenbroucke M, Scharpe S. Inflammatory markers in younger vs elderly normal volunteers and in patients with Alzheimer’s disease. J Psychiatr Res. 1999;33:397–405. doi: 10.1016/s0022-3956(99)00016-3. [DOI] [PubMed] [Google Scholar]
- MacEwan DJ. TNF receptor subtype signalling: differences and cellular consequences. Cell Signal. 2002;14:477–492. doi: 10.1016/s0898-6568(01)00262-5. [DOI] [PubMed] [Google Scholar]
- Mattson MP, Barger SW, Furukawa K, Bruce AJ, Wyss-Coray T, Mark RJ, Mucke L. Cellular signaling roles of TGFβ, TNFα and βAPP in brain injury responses and Alzheimer’s disease. Brain Res Rev. 1997;23:47–61. doi: 10.1016/s0165-0173(96)00014-8. [DOI] [PubMed] [Google Scholar]
- Meda L, Cassatella MA, Szendrei GI, Otvos L, Jr, Baron P, Villalba M, Ferrari D, Rossi F. Activation of microglial cells by beta-amyloid protein and interferon- gamma. Nature. 1995;374:647–650. doi: 10.1038/374647a0. [DOI] [PubMed] [Google Scholar]
- Micheau O, Tschopp J. Induction of TNF receptor I-mediated apoptosis via two sequential signaling complexes. Cell. 2003;114:181–190. doi: 10.1016/s0092-8674(03)00521-x. [DOI] [PubMed] [Google Scholar]
- Parihar MS, Brewer GJ. Mitoenergetic failure in Alzheimer’s disease. Am J Physiol Cell Physiol. 2007a;292:C8–C23. doi: 10.1152/ajpcell.00232.2006. [DOI] [PubMed] [Google Scholar]
- Parihar MS, Brewer GJ. Simultaneous age-related depolarization of mitochondrial membrane potential and increased mitochondrial reactive oxygen species production correlate with age-related gulatamate excitotoxicity in rat hippocampal neurons. J Neurosci Res. 2007b;85:1018–1032. doi: 10.1002/jnr.21218. [DOI] [PubMed] [Google Scholar]
- Patel JR, Brewer GJ. Age-related changes in neuronal glucose uptake in response to glutamate and beta-amyloid. J Neurosci Res. 2003;72:527–536. doi: 10.1002/jnr.10602. [DOI] [PubMed] [Google Scholar]
- Pike CJ, Walencewicz AJ, Glabe CG, Cotman CW. In vitro aging of beta-amyloid protein causes peptide aggregation and neurotoxicity. Brain Res. 1991;563:311–314. doi: 10.1016/0006-8993(91)91553-d. [DOI] [PubMed] [Google Scholar]
- Rogers J, Kirby LC, Hempelman SR, Berry DL, McGeer PL, Kaszniak AW, Zalinski J, Cofield M, Mansukhani L, Willson P. Clinical trial of indomethacin in Alzheimer’s disease. Neurology. 1993;43:1609–1611. doi: 10.1212/wnl.43.8.1609. [DOI] [PubMed] [Google Scholar]
- Scharf S, Mander A, Ugoni A, Vajda F, Christophidis N. A double-blind, placebo-controlled trial of diclofenac/misoprostol in Alzheimer’s disease. Neurology. 1999;53:197–201. doi: 10.1212/wnl.53.1.197. [DOI] [PubMed] [Google Scholar]
- Simmons LK, May PC, Tomaselli KJ, Rydel RE, Fuson KS, Brigham EF, Wright S, Lieberburg I, Becker GW, Brems DN. Secondary structure of amyloid beta peptide correlates with neurotoxic activity in vitro. Mol Pharmacol. 1994;45:373–379. [PubMed] [Google Scholar]
- Solleveld HA, Haseman JK, McConnell EE. Natural history of body weight gain, survival, and neoplasia in the F344 rat. J Natl Cancer Inst. 1984;72:929–940. [PubMed] [Google Scholar]
- Tobinick E, Gross H, Weinberger A, Cohen H. TNF-alpha Modulation for Treatment of Alzheimer’s Disease: A 6-Month Pilot Study. MedGenMed. 2006;8:25. [PMC free article] [PubMed] [Google Scholar]
- Viel JJ, McManus DQ, Smith SS, Brewer GJ. Age- and concentration-dependent neuroprotection and toxicity by TNF in cortical neurons from beta-amyloid. J Neurosci Res. 2001;64:454–465. doi: 10.1002/jnr.1097. [DOI] [PubMed] [Google Scholar]
- Weggen S, Eriksen JL, Sagi SA, Pietrzik CU, Golde TE, Koo EH. Abeta42-lowering nonsteroidal anti-inflammatory drugs preserve intramembrane cleavage of the amyloid precursor protein (APP) and ErbB-4 receptor and signaling through the APP intracellular domain. J Biol Chem. 2003;278:30748–30754. doi: 10.1074/jbc.M304824200. [DOI] [PubMed] [Google Scholar]
- Yang L, Lindholm K, Konishi Y, Li R, Shen Y. Target depletion of distinct tumor necrosis factor receptor subtypes reveals hippocampal neuron death and survival through different signal transduction pathways. J Neurosci. 2002;22:3025–3032. doi: 10.1523/JNEUROSCI.22-08-03025.2002. [DOI] [PMC free article] [PubMed] [Google Scholar]