

Summary
The energy of producing a fracture is considered one of the most important factors relating to injury severity, prognosis, and risk of complications, yet there has been no objective way to measure this important variable. The purpose of this study was to compare assessments of fracture severity made using new objective CT-based methods, versus the expert opinion of experienced orthopaedic traumatologists. Fracture energy, fragment displacement, and soft tissue swelling were quantified in twenty tibial plafond fractures by analyzing injury CT scans. Three experienced orthopaedic traumatologists then independently performed a rank order analysis of fracture severity, using plain radiographs.
The concordance between the three clinicians ranged from 87 to 91%. Objective fracture severity measurements made with the CT algorithm agreed well with the clinical assessments (fracture energy concordance from 73 to 76%, fragment displacement 82 to 89%, and soft tissue swelling 61 to 65%). These are the first objective, CT-based measures of fracture severity. With further refinement, this conceptually novel method has the potential to serve as a valuable tool to provide objective measurement of fracture severity, allowing one to control for this previously confounding variable in large multi-center studies.
Keywords: fracture severity, intra-articular, post, traumatic arthritis
Introduction
Intra-articular fractures often portend secondary osteoarthritis (OA), chronic pain, and decreased joint function. The success of peri-articular fracture management is dependent not only on how the fracture is treated but also on the fracture type and severity.1–5 Decision-making in treating complex articular injuries with comminution (Figure 1) requires that a surgeon assess the relative injury severity of a given case, and with this information, factor in the complexity of available treatment techniques, estimate prognosis, and weigh the risk for complications.
Figure 1.
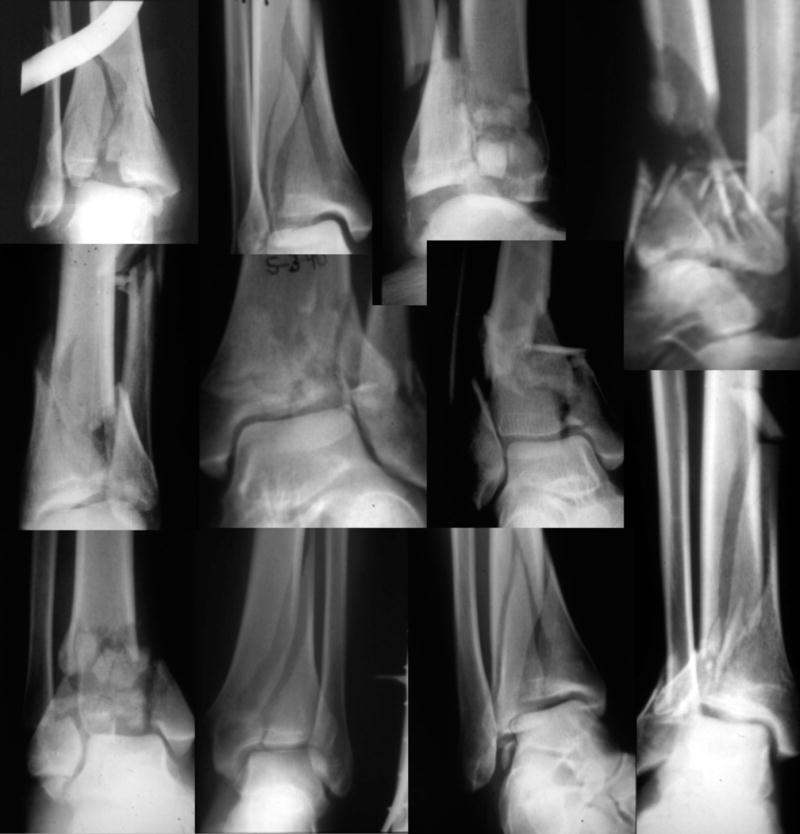
A montage of radiographs from comminuted tibial plafond fractures demonstrates the range of variation in both the number of fragments and in the degree of intra-articular extension.
Currently, there is no practical way to objectively measure injury severity. Existing methods for assessing fracture severity have generally taken the form of fracture classification systems, based upon visual assessment of specified characteristics. Poor interobserver reliability is a persistent problem with these observer-based techniques,20,22 with inaccurate fracture surface identification and inconsistent interpretation of classification guidelines explaining much of the variability. With such poor reliability, use of these systems to compare outcomes from different studies results in an “apples to oranges” comparison. This hinders the compilation of a body of literature and collective experience to guide the care of these patients.
The concept that “the extent of bone, cartilage, and soft tissue damage is directly related to the energy imparted to these structures6” is widely accepted among orthopaedic traumatologists, and it provides a basis for objectively quantifying injury severity. In order to assess the mechanical energy involved in a fracture, a new CT-based methodology was recently developed,7 exploiting the principle that mechanical energy liberates new surface area in a brittle solid, the amount of energy required being proportional to the amount of interfragmentary surface area.8 This approach was originally piloted using laboratory models (first, a bone surrogate material,9,10 then bovine bone segments7), in which known energies were used to create fractures. Highly significant (p<0.0001) increases in measured interfragmentary surface area were observed with increases in fragmentation energy.
The fracture energy assessment technique was subsequently extended for use in human clinical cases.11 Since the energy-absorbing capacity of bone is both density- and age-dependent in humans,12–14 a bone density-based weighting was integrated into the fracture energy algorithm. There was strong agreement (Figure 2) between the CT-inferred fracture energy values and the energy actually absorbed in fracturing bovine bone specimens. Fragment displacement/dispersion and fracture-associated soft tissue swelling are two other factors of clinical significance in these cases, though lesser contributors to frank energy absorption. Both fracture displacement and soft tissue swelling are likewise amenable to quantification from CT studies.
Figure 2.

Controlled fracture experiments performed in bovine bone showed a highly linear relationship (R=0.83) between CT-inferred fracture energy and the physically measured energy absorbed in fracturing the cortical bone specimens. Inset: The data also showed that fragment size distribution correlated with fracture energy, shifting from a relatively high proportion of large fragments at lower energies to a higher proportion of smaller fragments at higher energies.
Despite the previously stated limitations in existing fracture classification systems, the opinion of experienced traumatologists remains the gold standard against which objective measures of injury severity must be gauged. The purpose of this study was to assess the reliability of fracture severity results obtained using image analysis techniques, as compared to experienced clinician opinion. Establishing this agreement represents an important step toward wider acceptance and future potential application of this methodology in the clinical arena.
Materials and Methods
The study group consisted of twenty tibial plafond fractures (13 male, 7 female, patient ages from 20 to 64 years), selected from a larger group treated at our institution. Tibial plafond fractures were chosen for study because the fracturing energy is delivered to the tibia directly through ankle joint cartilage, thus providing an indirect measure of cartilage insult. An Institutional Review Board approved the use of these patients’ imaging studies. Cases were specifically chosen to represent the spectrum of injury from mild partial articular fractures to severely comminuted fractures involving the entire tibial plafond. To be in the study, the initial CT scan needed to have included both ankles in the scanner, for purposes of fracture severity analysis. A spanning external fixator was applied prior to CT scan acquisition, thereby restoring length and alignment across all cases. Fifteen of the twenty cases involved fractures of both the tibia and the fibula.
Liberated fracture surface areas were quantified utilizing CT studies obtained during standard clinical care. Helical CT spatial resolutions were either 2 mm slice thickness × 0.5 mm reconstruction, or 0.63 mm slice thickness × 0.3 mm reconstruction, with 512×512 pixel matrix in-plane spatial resolutions from 0.25 to 0.5 mm. Since pre-existing and de novo bone surfaces could both be present in fracture fragments, contralateral limb scans were used to provide intact bone surface areas over a comparable distal segment of the patient’s limb, to enable identification of de novo bone surface. As fibular fracture generally involves much less energy absorption, and arguably bypasses the tibio-talar articular surface, bone surface area calculations were restricted to the tibia alone.
Bone margins were identified slice-by-slice in CT datasets, using validated digital image analysis routines (Figure 3).7 This process involved first an automated pass through the CT data to identify candidate bone edges. Limited manual intervention was then used to correct spuriously identified or missed edges, especially in those cases where fragments were only minimally displaced. With the bone edges successfully delineated, the perimeter of bone (both periosteal and endosteal) in each slice was then calculated. Multiplying the bone perimeters in a given CT slice times the slice thickness yielded the bone surface area over the slice volume. Summing areas across slices provided the amount of free surface area of bone. Finally, subtraction of previously intact bone surface area from the fractured area gave the interfragmentary surface area for each of the fracture cases (grayed region, Figure 3).7
Figure 3.

Fragment surface area is calculated by identifying bone perimeters at each CT slice. Bone perimeters (matched intact and fractured) for each slice, plotted along the length of the distal tibia, help to clarify how the fracture energy measure is calculated. The interfragmentary surface area is calculated by summing the areas (for each slice, the product of perimeter and slice thickness) over the length of the fractured tibia, and then subtracting the areas of the intact contralateral tibia summed over the same length. Inset: CT slice from fracture case, with identified tibia bone edges highlighted.
Both the patients’ bone densities and their ages were incorporated into a formal fracture energy measure based upon the interfragmentary surface area. Bone density values were obtained by first calculating the median Hounsfield intensity of all pixels identified as bone in the course of surface area calculations in the intact proximal tibias. Apparent bone density was then regressed using an established nonlinear relationship.15,16 The energy required to liberate fracture surfaces can be related to the apparent density through multiplication by a single material constant (impact energy, with units of J/m2), once the densities are normalized to the density of the base bone material.14 The impact energy constant was adjusted for patient age utilizing an inverse logarithmic relationship.13
Quantifying fragment displacement and the soft tissue injury required further supplemental analysis. When fracture fragments are displaced, the bony areas in given cross-sections are generally translated away from their intact positions, the bone structure is disrupted, and fragments are dispersed relative to one another. The limb trauma elicits a swelling of the soft tissues, to varying amounts depending upon the specifics of the injury, which evolves over time in the subsequent post-injury period.
The bone surfaces identified in fracture energy analysis were used to quantify fragment displacement/dispersion, indexed by the volume of tissues through which fracture fragments were dispersed, relative to their intact position. This first required alignment of the proximal base of the fractured tibia with a mirrored image of its uninjured contralateral counterpart (Figure 4a). The alignment was performed using Geomagic Studio software (Geomagic Inc., Research Triangle Park, NC). In each CT slice, a convex hull (the smallest convex polygon circumscribing an object) of both the mirrored intact, and of the composite aligned intact and fractured tibias was generated (Figure 4b). The difference in circumscribed volumes (stacked areas multiplied by slice spacing) between the aggregate intact/fractured and isolated intact convex hulls was calculated to quantify the amount of fragment dispersion and axial malalignment in a single aggregate displacement metric. The degree of fracture-associated soft tissue swelling was quantified by calculating the volume of non-osseous regions in the fractured limb, and then subtracting the analogous measure for the intact contralateral limb (Figure 4c).
Figure 4.
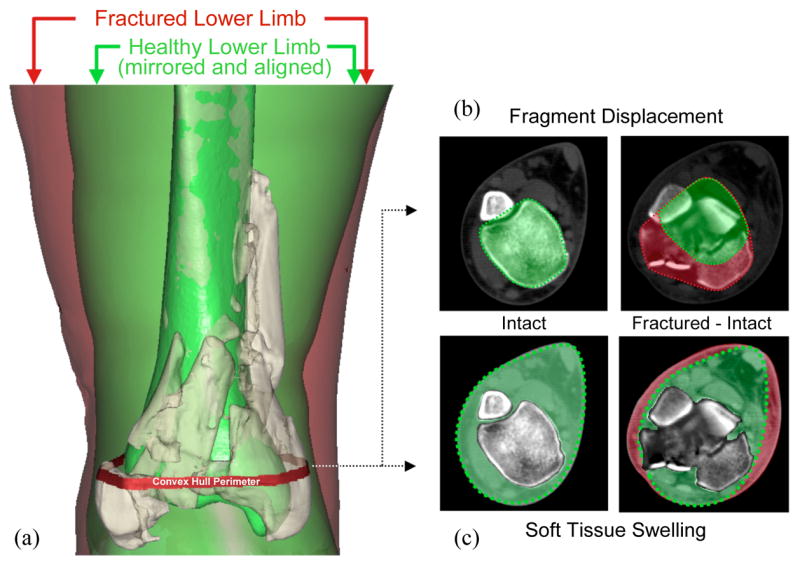
Assessment of fragment displacement and soft tissue injury began with (a) alignment of the proximal base of the fractured tibia with a mirrored image of its healthy contralateral limb. (b) In each CT slice, a convex hull (the smallest convex polygon circumscribing an object) of both the mirrored intact, and of the composite aligned intact and fractured tibias was generated. The difference in circumscribed volumes between these convex hulls was used to quantify fragment dispersion and axial mal-alignment in a single aggregate displacement metric. (c) Fracture-associated soft tissue swelling was quantified by calculating the mathematical difference in volume of non-osseous regions in the fractured and intact limbs.
In independent grading sessions, the fracture cases were ranked for injury severity by three experienced orthopaedic traumatologists. The rankings were from lowest to highest severity (i.e., ordered from 1 to 20, with 1 the least and 20 the most severe), based on the appearance of A-P and lateral radiographs.17 The graders were the three most senior orthopaedic trauma surgeons at our institution, with a combined fifty years of experience in full-time trauma practices. The only instructions given to the raters were to rank the cases in order of least to most severely injured. Subjectively, they used the number and size of fragments, the amount and direction of displacement, percentage of articular surface involved, and whatever other features they felt were important based on their clinical experience. The rankings were done in separate sessions on different days, and no information was exchanged between the raters. Raters were blinded to the CT-derived data, and all identifying information on plain films was totally obscured.
Concordance rates were calculated to determine agreement between the three raters and between each rater’s assessment of fracture severity and the CT-based severity measures. For the purposes of these comparisons, CT-based measures were rank ordered according to their respective magnitudes. A pair of cases’ injury severity rankings was deemed concordant if the case with the higher ranking of injury severity for one rater also had the higher ranking for a second rater. The rate of concordance was thus simply the number of concordant pairs divided by the total number of possible pairings. This sample-based statistical measure was used to estimate the probability that two fracture cases would be ranked with the same ordering. If there were no agreement (i.e., agreement no better than by chance), then the proportion of concordant pairs would be 0.5.
Results
The range of different fractures encountered in the study is illustrated by plain radiographs in Figure 1, with further details provided in Table 1. Fracture energies ranged from 11 to 53 J, with a median value of 23 J. The energy magnitudes were evenly distributed, with a standard deviation of 13, and first and third quartiles demarcated at 17 and 35 J, respectively. The fragment displacement volumes ranged from 3.4 to 47.4 cm3. Each CT dataset took eight to ten person-hours to process, using semi-automated analysis tools developed for this purpose.
Table 1.
Patient information for cases included in this study.
| Gender | Age | AO/OTA Fracture classification | Mechanism of injury | Rater 1* | Rater 2 | Rater 3 | Fragment Displacement Metric (cm3) | Fracture Energy (J) |
|---|---|---|---|---|---|---|---|---|
| M | 41 | B21 | fall from height (20 ft) | 1 | 1 | 1 | 3.40 | 12.58 |
| F | 26 | B22 | ATV accident | 2 | 7 | 5 | 3.78 | 16.55 |
| M | 29 | B12 | ATV accident | 3 | 5 | 2 | 10.37 | 28.04 |
| M | 20 | C13 | motorcycle accident | 4 | 2 | 7 | 11.31 | 17.49 |
| F | 57 | B23 | fall (ice) | 5 | 3 | 9 | 13.49 | 17.24 |
| F | 48 | C11 | fall from height (12 ft) | 6 | 6 | 3 | 6.31 | 18.42 |
| F | 36 | C11 | automobile accident | 7 | 8 | 4 | 16.40 | 14.37 |
| F | 55 | B21 | fall from height (4 ft) | 8 | 11 | 8 | 5.22 | 10.70 |
| M | 28 | B21 | fall from height (8 ft) | 9 | 9 | 10 | 6.94 | 16.82 |
| M | 40 | C11 | fall from height (16 ft) | 10 | 4 | 6 | 18.20 | 22.49 |
| M | 22 | B22 | automobile accident | 11 | 10 | 11 | 23.80 | 39.71 |
| M | 21 | B13 | fall from height (30 ft) | 12 | 14 | 12 | 25.92 | 34.96 |
| M | 26 | C23 | fall from height (12 ft) | 13 | 13 | 14 | 24.21 | 33.05 |
| F | 38 | C32 | automobile accident | 14 | 12 | 13 | 24.36 | 20.12 |
| F | 41 | C21 | automobile accident | 15 | 17 | 17 | 32.42 | 22.81 |
| M | 34 | C33 | fall from height (16 ft) | 16 | 15 | 16 | 27.49 | 53.42 |
| M | 25 | C33 | fall from height (16 ft) | 17 | 18 | 15 | 24.46 | 45.02 |
| M | 24 | C21 | motorcycle accident | 18 | 26 | 18 | 34.62 | 36.95 |
| M | 64 | C31 | fall from height (16 ft) | 19 | 20 | 20 | 27.68 | 27.34 |
| M | 26 | C33 | fall from height (16 ft) | 20 | 19 | 19 | 47.35 | 46.21 |
The numeric values here represent a rank ordering of fracture severity amongst the twenty cases from 1 (indicating least severe) to 20 (most severe).
The raw rank ordering data are depicted graphically in Figure 5. The concordance rate between the three raters averaged 89% (87, 89, and 91%). The rank ordering of the fracture energy metric agreed well with the raters’ judgment, with concordance rates of 73, 74, and 76%. The concordance rate between raters’ assessment of fracture severity and the aggregate fragment displacement metric was 82, 86, and 89%. The clinical rank orderings of fracture severity were concordant with a soft tissue swelling metric at rates of 61, 63, and 65%.
Figure 5.

Agreement between injury severity rankings and CT-based metrics. Raters were blinded as to the CT-based data and to patient age. The graphs compare the rank ordering of rater 1 versus that of raters 2 and 3, and of the individual CT-based metrics. Concordance values are enclosed in parentheses following the rater/metric.
Although not formally pursued in this study, the CT-based analyses provide additional useful information concerning the proximity of the fracture to the articular surface, and the distribution of fracture surface along the distal tibia (Figure 6). In particular, distinction can be made between a long spiral oblique fracture and a more highly comminuted fracture, and between comminution concentrated peri-articularly versus metaphyseally.
Figure 6.
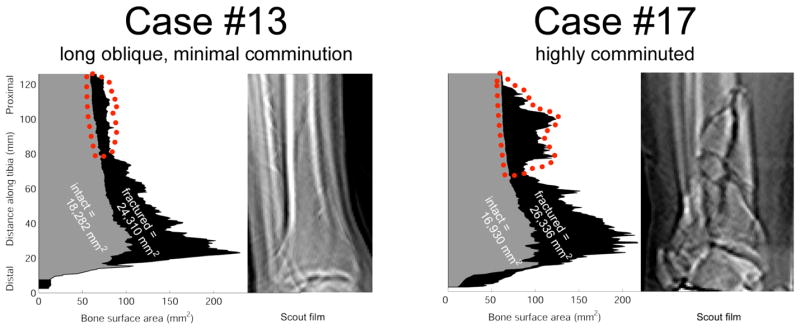
A plot of bone surface areas as they vary over the length of two fractured tibias (plotted regions shaded black), along with the areas of their contralateral intact tibias (shaded gray), shows the unique signatures of different fractures. The fractured surface areas plotted are the total over all fragments within a given CT slice. The region outlined in red shows characteristic differences in the degree of proximal comminution, confirmed on scout films.
Discussion
The purpose of this study was to compare the grading of fracture severity obtained using new CT-based techniques, versus severity assessed by experienced orthopaedic traumatologists using standard-of-care plain film radiography. The objective severity assessment techniques apply principles from fracture mechanics, to quantify both the extent of a fracture and its degree of comminution. This semi-automated technique physically links an injury severity metric to the energy absorbed in the initial injury, as inferred from post-fracture CT scans. This methodology provides opportunity to formalize the long-standing practice of labeling fractures as “low energy” or “high energy,” and it presents a platform to enable assessment of the relationship between severity of acute insult and eventual clinical outcomes. Importantly, since the methodology is objective and highly automated, it is conducive to use (with further refinement) in multi-center studies to pool otherwise small numbers of cases of similar injury severity.
Clinical decision-making in treating complex articular injuries with comminution requires that a surgeon assess the relative injury severity of a given case and with this information, factor in the complexity of available treatment techniques, estimate prognosis, and weigh the risk for complications. These decisions rely primarily upon examining the injured limb and classifying the fracture on radiographs and CT scans, to identify features empirically shown to correlate with outcome. The degree of bony comminution, the extent of injury to the surrounding soft tissues, and proximity of the fracture to the articular surface all potentially influence the patient’s prognosis. However, assessing these variables lies largely in the realm of subjective judgment. The degree of bony comminution in particular is of primary importance as a fracture severity metric.18,19 Unfortunately, “comminuted” is “comminuted” in most current fracture classification systems, whether the fracture involves five fragments or twenty-five. Categorical classification of comminuted intra-articular fractures has therefore proven problematic, with no scale able to reliably and reproducibly provide agreement among different observers.20
Ideally, injury and comminution severity would be stratified on a continuous scale, allowing comparison between cases for treatment, prognosis of individual cases, and for clinical research. The method that has come closest to this ideal uses the concept of a rank ordering from least to most severely injured, based on experienced physician judgment. Two studies have demonstrated a high degree of agreement among orthopaedic surgeons (Cronbach α=0.89 and 0.9417 and intraclass correlation = 0.9421) when ranking fractures for injury severity based upon plain radiographic appearance, a point confirmed in the present study (mean concordance = 89%). However, rank ordering depends upon the rater having several cases to compare to one another, which is not generally practical in settings where fracture cases are encountered one at a time. In addition, there is a practical limit on the total number of cases that can be subjectively compared in a clinical trial. It is for these reasons that classification systems, despite their acknowledged shortcomings, have continued to be the most commonly used measure of injury severity.
In the present study, the concordance rates between the individual raters and the CT-based image analysis (from 73 to 76% for fracture energy, and from 82 to 89% for fragment displacement) confirms strong agreement between the subjective expert opinion of fracture severity and the objective CT-based measures. While not directly comparable to the Kappa statistic (for which values of 0.4 to 0.5 have been reported for fracture classification studies on tibial plafond fractures 20,22,23), these concordance levels represent a substantially higher level of agreement. Of course, whether or not a subjective assessment or an objective CT image analysis-based measure is a more meaningful “gold standard” for rating fracture severity is an open question. Although not directly tested in this study, the differences in concordance between the two different CT based bony metrics and the clinical rank orderings would suggest that fragment displacement influences clinicians’ assessment of severity more than the degree of comminution. The more modest concordance observed between individual raters and a CT-based soft tissue swelling metric may reflect the fact that raters had access only to plain radiographs for their assessments, and that they were tasked with assessing fracture severity, first and foremost. Clinically, severity of soft tissue injury may not directly correlate with either comminution or dispersal – a strong argument for a direct measurement of soft tissue injury.
Among the limitations of our current analytical technique, our present soft tissue injury metric is based upon swelling, which can arise and resolve fairly quickly in the post-injury period. Also, pending availability of data to support improved prediction of outcomes (a study toward that end is presently in progress), the additional effort to perform the CT-based measurement is such that the new method’s application is at present more appropriate in research settings rather than in routine clinical practice.
The main goal of this study was to compare experienced orthopaedic traumatologists’ opinions of fracture severity versus that of the CT-based image analysis. It was found that experienced orthopaedic surgeons agree on radiographic injury severity, and that they in turn agree with the CT-derived measures of fracture severity. This constitutes the first objective, CT image-analysis-based measure of fracture severity. Complementary soft tissue injury assessment provides additional valuable measurement of the overall injury severity. With further refinement, this conceptually novel method has the potential to serve as a valuable tool to provide objective measurement of fracture severity, allowing one to control for this previously confounding variable in large multi-center studies.
Acknowledgments
Financial support was provided by grants from the National Institutes of Health (AR46601, AR48939, and AR55533) and from the Orthopaedic Trauma Association. The assistance of Dr. Steven L. Hillis in performing statistical analyses and of Drs. James V. Nepola and Todd O. McKinley in ranking the cases is also gratefully acknowledged. Ms. Valerie Muehling and Mr. Andrew Pick helped collect clinical case data.
References
- 1.Wyrsch B, McFerran MA, McAndrew M, et al. Operative treatment of fractures of the tibial plafond. J Bone Joint Surg Am. 1996;78:1646–1657. doi: 10.2106/00004623-199611000-00003. [DOI] [PubMed] [Google Scholar]
- 2.Crutchfield E, Seligson D, Henry S, Warnholtz A. Tibial pilon fractures: a comparative clinical study of management techniques and results. Orthopedics. 1995;18:613–617. doi: 10.3928/0147-7447-19950701-06. [DOI] [PubMed] [Google Scholar]
- 3.Evangelopoulos D, Anastasakis D, Samelis P, Vlachopoulos J. Articular fractures of the tibia (pilon) grade III. Treatment with external fixator and minimal internal fixation. J Bone Joint Surg Br. 1999;81(Suppl II):181. [Google Scholar]
- 4.Hernandez JA, Rodriguez D, Garreta JL, et al. Fractures of the tibial plafond. Influence of fracture type and accuracy of articular reduction in their prognosis. J Bone Joint Surg Br. 1999;81(Suppl II):181. [Google Scholar]
- 5.Stojkovska E, Saveski J, Todorov I, et al. Results of surgical treatment of displaced pilon fractures. J Bone Joint Surg Br. 1999;81(Suppl II):181. [Google Scholar]
- 6.Bartlett CS, III, D’Amato MJ, Weiner LS. Fractures of the tibial pilon. In: Browner BD, Jupiter JB, Levine AM, Trafton PG, editors. Skeletal Trauma. 2. Philadelphia: W.B. Saunders; 1998. pp. 2295–2325. [Google Scholar]
- 7.Beardsley CL, Anderson DD, Marsh JL, Brown TD. Interfragmentary surface area as an index of comminution severity in cortical bone impact. J Orthop Res. 2005;23:686–690. doi: 10.1016/j.orthres.2004.09.008. [DOI] [PMC free article] [PubMed] [Google Scholar]
- 8.Von Rittinger P. Lehrbruch der Aufbereitskunde [Textbook of Unit Operations] Berlin, Germany: Ernst and Kokn; 1867. [Google Scholar]
- 9.Beardsley CL, Bertsch CR, Marsh JL, Brown TD. Interfragmentary surface area as an index of comminution energy: proof of concept in a bone fracture surrogate. J Biomech. 2002;35:331–338. doi: 10.1016/s0021-9290(01)00214-7. [DOI] [PubMed] [Google Scholar]
- 10.Beardsley CL, Heiner AD, Brandser EA, et al. High density polyetherurethane foam as a fragmentation and radiographic surrogate for cortical bone. Iowa Orthop J. 2000;20:24–30. [PMC free article] [PubMed] [Google Scholar]
- 11.Beardsley CL, Marsh JL, Brown TD. Quantifying comminution as a measurement of severity of articular injury. Clin Orthop Relat Res. 2004;423:74–78. doi: 10.1097/01.blo.0000131637.04391.40. [DOI] [PubMed] [Google Scholar]
- 12.Currey JD. Changes in the impact energy absorption of bone with age. J Biomech. 1979;12:459–69. doi: 10.1016/0021-9290(79)90031-9. [DOI] [PubMed] [Google Scholar]
- 13.Currey JD, Brear K, Zioupos P. The effects of ageing and changes in mineral content in degrading the toughness of human femora257–60. J Biomech. 1996;29 doi: 10.1016/0021-9290(95)00048-8. Erratum in: J Biomech 30:1001. [DOI] [PubMed] [Google Scholar]
- 14.Gibson LJ, Ashby MF. Cellular Solids: Structure and Properties. 1 paperback. Cambridge, UK: Cambridge University Press; 1999. pp. 429–452. [Google Scholar]
- 15.Snyder SM, Schneider E. Estimation of mechanical properties of cortical bone by computed tomography. J Orthop Res. 1991;9:422–431. doi: 10.1002/jor.1100090315. [DOI] [PubMed] [Google Scholar]
- 16.Ciarelli MJ, Goldstein SA, Kuhn JL, et al. Evaluation of orthogonal mechanical properties and density of human trabecular bone from the major metaphyseal regions with materials testing and computed tomography. J Orthop Res. 1991;9:674–82. doi: 10.1002/jor.1100090507. [DOI] [PubMed] [Google Scholar]
- 17.DeCoster TA, Willis MC, Marsh JL, et al. Rank order analysis of tibial plafond fractures: does injury or reduction predict outcome? Foot Ankle Int. 1999;20:44–49. doi: 10.1177/107110079902000110. [DOI] [PubMed] [Google Scholar]
- 18.Helfet DL, Koval K, Pappas J, et al. Intraarticular “pilon” fracture of the tibia. Clin Orthop Relat Res. 1994;298:221–228. [PubMed] [Google Scholar]
- 19.Trumble TE, Schmitt SR, Vedder NB. Factors affecting functional outcome of displaced intra-articular distal radius fractures. J Hand Surg Am. 1994;19:325–340. doi: 10.1016/0363-5023(94)90028-0. [DOI] [PubMed] [Google Scholar]
- 20.Swiontkowski MF, Sands AK, Agel J, et al. Inter-observer variation in the AO/OTA fracture classification system for pilon fractures: is there a problem? J Orthop Trauma. 1997;11:467–470. doi: 10.1097/00005131-199710000-00002. [DOI] [PubMed] [Google Scholar]
- 21.Williams TM, Nepola JV, DeCoster TA, et al. Factors affecting outcome in tibial plafond fractures. Clin Orthop Relat Res. 2004;423:93–98. doi: 10.1097/01.blo.0000127922.90382.f4. [DOI] [PubMed] [Google Scholar]
- 22.Dirschl DR, Adams GL. A critical assessment of factors influencing reliability in the classification of fractures, using fractures of the tibial plafond as a model. J Orthop Trauma. 1997;11:471–476. doi: 10.1097/00005131-199710000-00003. [DOI] [PubMed] [Google Scholar]
- 23.Martin JS, Marsh JL, Bonar SK, et al. Assessment of the AO/ASIF fracture classification for the distal tibia. J Orthop Trauma. 1997;11:477–483. doi: 10.1097/00005131-199710000-00004. [DOI] [PubMed] [Google Scholar]