

Abstract
Many mechanisms of neurodegeneration have been implicated in Parkinson’s disease, but which ones are most important and potential interactions among them are unclear. To provide a broader perspective on the parkinsonian neurodegenerative process, we have performed a global analysis of gene expression changes caused by chronic, low-level exposure of neuroblastoma cells to the mitochondrial complex I inhibitor and parkinsonian neurotoxin rotenone. Undifferentiated SK-N-MC neuroblastoma cells were grown in the presence of rotenone (5 nM), and RNA was extracted at three different time points (baseline, 1 week, and 4 weeks) for labeling and hybridization to Affymetrix Human U133 Plus 2.0 GeneChips. Our results show that rotenone induces concerted alterations in gene expression that change over time. Particularly, alterations in transcripts related to DNA damage, energy metabolism, and protein metabolism are prominent during chronic complex I inhibition. These data suggest that early augmentation of capacity for energy production in response to mitochondrial inhibition might be deleterious to cellular function and survival. These experiments provide the first transcriptional analysis of a rotenone model of Parkinson’s disease and insight into which mechanisms of neurodegeneration may be targeted for therapeutic intervention.
Keywords: Parkinson’s disease, rotenone, mitochondria, microarray, oxidative stress, neurodegeneration
Parkinson’s disease (PD) is a common neurodegenerative disorder that causes debilitating motor symptoms, including tremor, slowness of movement, rigidity, and postural instability. These symptoms are primarily the result of death of dopamine neurons in the substantia nigra. Many mechanisms of neurodegeneration are thought to be involved in the pathogenesis of PD, but which ones are most important and the interactions among them are unknown.
Several lines of evidence have recently converged to suggest that environmental exposure to pesticide neurotoxicants may be a causative or exacerbating factor in dopamine neuron damage. First, pesticide exposure has been epidemiologically linked to PD for years (Ben-Shlomo, 1997, Petrovitch et al., 2002), and recently, pesticide levels were found to be elevated in brains from PD patients (G.W. Miller, personal communication). Second, a systemic deficiency in mitochondrial complex I activity has been demonstrated repeatedly in PD patients, which is provocative since many pesticides are complex I inhibitors (Parker et al., 1989, Schapira et al., 1989, Krige et al., 1992). Finally, low-level exposure to rotenone, a prevalent organic pesticide and the classical mitochondrial complex I inhibitor, has been shown to mimic aspects of PD pathology in experimental animals (Betarbet et al., 2000).
Evaluating mechanisms of rotenone-induced neurotoxicity may provide valuable information relevant to PD pathogenesis, but mechanistic investigation of rotenone toxicity in the whole animal is complicated by the heterogeneous nature of the tissue under study and substantial inter-animal variability in the response to rotenone. Previously, we showed that chronic exposure of SK-N-MC neuroblastoma cells to rotenone recapitulates in vitro certain aspects of PD (Sherer et al., 2002). In this system, cells are exposed to a low concentration of rotenone that produces a level of complex I inhibition similar to what is seen in PD and does not cause acute toxicity, yet causes a low level of apoptosis after 4 weeks of exposure. In addition, pathology appears in a progressive manner whereby cells accumulate α-synuclein after 1 week, oxidative protein damage after 2 weeks, and increased susceptibility to oxidative stress after 4 weeks (Sherer et al., 2002, Sherer et al., 2003). These findings and the sequence in which they occur are consistent with many pathological findings of PD.
We have used this model to analyze transcriptional alterations that occur during induction of parkinsonism. This system-wide approach provides a broader vision (or bird’s eye view) of the entire neurodegenerative process that is lacking in ‘candidate-mechanism’ experiments. Analysis of our data using sensitive pathways-based methodology shows that chronic complex I inhibition by rotenone induces concerted alterations in gene expression that change over time and highlights several mechanisms that may interact to bring about cellular dysfunction and death in parkinsonism.
Experimental Procedures
Cell culture and sample collection
SK-N-MC neuroblastoma cells were cultured in minimum essential medium (MEM) with Earle's salts containing 5 mM glucose (Mediatech, Herndon, VA), 15% fetal bovine serum (Invitrogen, Carlsbad, CA), 50 U/ml penicillin and streptomycin, 5 mM sodium pyruvate, and nonessential amino acid solutions for MEM (Mediatech). Preliminary experiments revealed that doubling time of the cell line progressively increased in a concentration-dependent manner above 10 nM rotenone. Growth kinetics were unaffected by 5 nM rotenone, even after 5 weeks of exposure, and there was no necrotic cell death as assessed by LDH release at any time point (not shown). In addition, rotenone (5 nM) did not alter cellular morphology throughout 5 weeks of exposure. We chose to evaluate the transcriptional response to the 5 nM dose due to its lack of acute toxic effect and previous evidence indicating that it induces chronic cell death (~ 5% apoptosis) and Parkinson-like pathology after long-term exposure (Sherer et al., 2002). Media were supplemented with 5 nM rotenone (Sigma, St. Louis, MO) or vehicle (0.1% ethanol) for up to 4 weeks. Cells were grown in 100 mm plates, fed three times per week, and passaged approximately once a week on reaching confluence.
The entire 4-week experiment was repeated three times over approximately 6 months. Within each experiment, equal amounts of total RNA from 3 independent culture dishes were pooled to create one sample. Thus, for each experimental group, there were three independent samples, each of which consisted of pooled RNA from 3 independent culture dishes. Samples were: Untreated (N=3), EtOH vehicle (1 week and 4 weeks; N=3 each), and 5 nM Rotenone (1 week and 4 weeks; N=3 each). Total RNA was extracted using the RNeasy Mini Kit with DNase digestion (Qiagen, Valencia, CA).
Microarray hybridization
Sample labeling, microarray hybridization, and preliminary analyses were performed by the NINDS NIMH Microarray Consortium at the Translational Genomics Institute in Phoenix, AZ (TGEN; http://arrayconsortium.tgen.org). Briefly, we sent the Consortium total RNA, which was reverse transcribed and used to produce biotinylated cRNA using the EnzoBioArray High Yield RNA Transcript Labeling Kit (Affymetrix, Santa Clara, CA). Samples (10 µg) were hybridized to Affymetrix Human U133 Plus 2.0 Gene Chips. The U133 Plus 2.0 is a high-density microarray that surveys over 18,000 transcripts in a near-complete genome scan. Chips were developed, scanned, and normalized by global scaling. Visual inspection was performed to identify arrays with production defects or uneven hybridization. Image files and data from all of the hybridizations are available online at the TGEN website.
Microarray analysis
The relative abundance of each probe set and an evaluation of whether a particular transcript was expressed above background were calculated using Microarray suite (MAS 5.0, Affymetrix). The assignment of each probe pair on the Human U133 Plus 2.0 GeneChip to a gene was originally based by Affymetrix on the sequences available in Unigene build #99. The probe pair assignments have not been updated by Affymetrix, and approximately 18% of the original accession numbers assigned to probe sets on the Human U133 Plus 2.0 chip either match fewer than half of the probe pairs in the corresponding set or are retired from current databases. Dai et al. (Dai et al., 2005) created a custom CDF file (http://brainarray.mbni.med.umich.edu/Brainarray/Database/CustomCDF/genomic_curated_CDF.asp) that can be read by the MAS 5.0 program to assign signal intensities of each probe pair to genes . All probe pairs for a particular transcript are pooled into a single probe set, which eliminates duplicate or triplicate instances of genes on the Chip. Moreover, probes hybridizing to the non-coding strand of a transcript are deleted from analysis, which greatly reduces the number of expressed sequence tags (ESTs) called. Discrimination scores of the signal intensities for each spot on an individual chip were determined to be significantly different from background (i.e., present, marginally present, or absent calls) using a one-sided Wilcoxon’s Sign Ranked test. We selected genes for subsequent analyses if signal intensities were significantly above background (i.e., called “present”) in all 3 arrays from at least one sample group.
Gene set enrichment analysis (GSEA)
Gene set enrichment analysis was performed using the GSEA-P software available at http://www.broad.mit.edu/gsea/ (Subramanian et al., 2005). This method does not require prior statistical determination of which genes are differentially expressed, but instead evaluates all transcripts expressed above background. For this reason, GSEA provides a very sensitive approach to detecting concerted expression changes in functional cellular pathways. Using GSEA, we compared the effect of rotenone on 522 predefined functional groups of transcripts or “gene sets” originally described by Subramanian et al (curated “c2” gene set from MSigDB 1.0) (Subramanian et al., 2005). For the broad comparison of rotenone and vehicle, input was all genes expressed at any time point with corresponding signal intensities. To compare the rotenone effect at 4 weeks v. 1 week, input was normalized to vehicle at each time point by using the log2 ratio of rotenone versus vehicle expression. Default program settings were used for analysis, including a minimum gene set size of 15 to exclude very small sets. Gene sets with a nominal p-value < 0.05 and FDR < 0.3 were considered significantly different between groups, as suggested by Subramanian et al. (Subramanian et al., 2005).
Analysis of Conserved Transcription Factor Binding Sites
Promoter regions of several gene sets determined to be different by GSEA were analyzed for conserved transcription factor binding sites using the web-based application CONFAC (Karanam and Moreno, 2004). Briefly, accession numbers from the gene set were uploaded to the program, and mouse homologs were determined. Promoters (3 kb upstream from the transcription start site) were scanned for transcription factor binding sites conserved between human and mouse. Using a Mann-Whitney test, the mean number of binding sites per promoter was compared between the tested gene sets and a set of 62 genes expressed in SK-N-MC cells that had the lowest variability between groups in this experiment. Comparison was also made to a random set of 75 genes expressed in this experiment. Using this approach allowed us to determine which transcription factor binding elements were more or less prominent in our gene sets of interest as compared to the overall population of expressed genes.
Differential expression and categorical analysis
In order to further inform our GSEA, differentially expressed genes were determined by a two-tailed t-test with Benjamini-Hochberg (B-H) correction for multiple comparisons (Hochberg and Benjamini, 1990) using a false discovery rate (FDR) < 5% independently on rotenone and vehicle samples from 1 or 4 weeks in culture. Input was all expressed genes with corresponding log2 transformed signal intensities. Due to the large number of expressed genes, the expression sets were filtered using a variance-based technique whereby only genes for which rotenone expression values were more than three standard deviations removed from the corresponding vehicle value were admitted to the subsequent B-H analysis (Levenson et al., 2004).
Differentially expressed transcripts were categorized using the web-based application eGOn (Explore Gene ONtology; http://www.genetools.microarray.ntnu.no/common/intro.php) (Beisvag et al., 2006). eGOn automatically categorizes genes into gene ontology classifications under three main GO headings: biological process, molecular function, and cellular compartment. Fisher’s exact test was used to evaluate the statistical significance of categorical differences between gene lists. Several comparisons were made using eGOn. The list of transcripts increased by rotenone at any time point was compared to the list of transcripts decreased by rotenone. In addition, genes increased at 4 weeks were compared to those decreased at 4 weeks. P-values of < 0.01 were considered significant. To get a more detailed picture of the time-dependent nature of the gene expression changes, time-dependent clusters determined by hierarchical clustering were compared to the entire set of differentially expressed genes (Fig 4). Categorical over-representation in individual time-dependent clusters was compared to the entire set of differentially expressed genes. GO biological process categories were considered significantly different from the whole if a cluster contained more than 50% of the total differentially expressed genes in a category and the p-value was < 0.01.
Figure 4. Time-dependent effects of rotenone on gene expression.
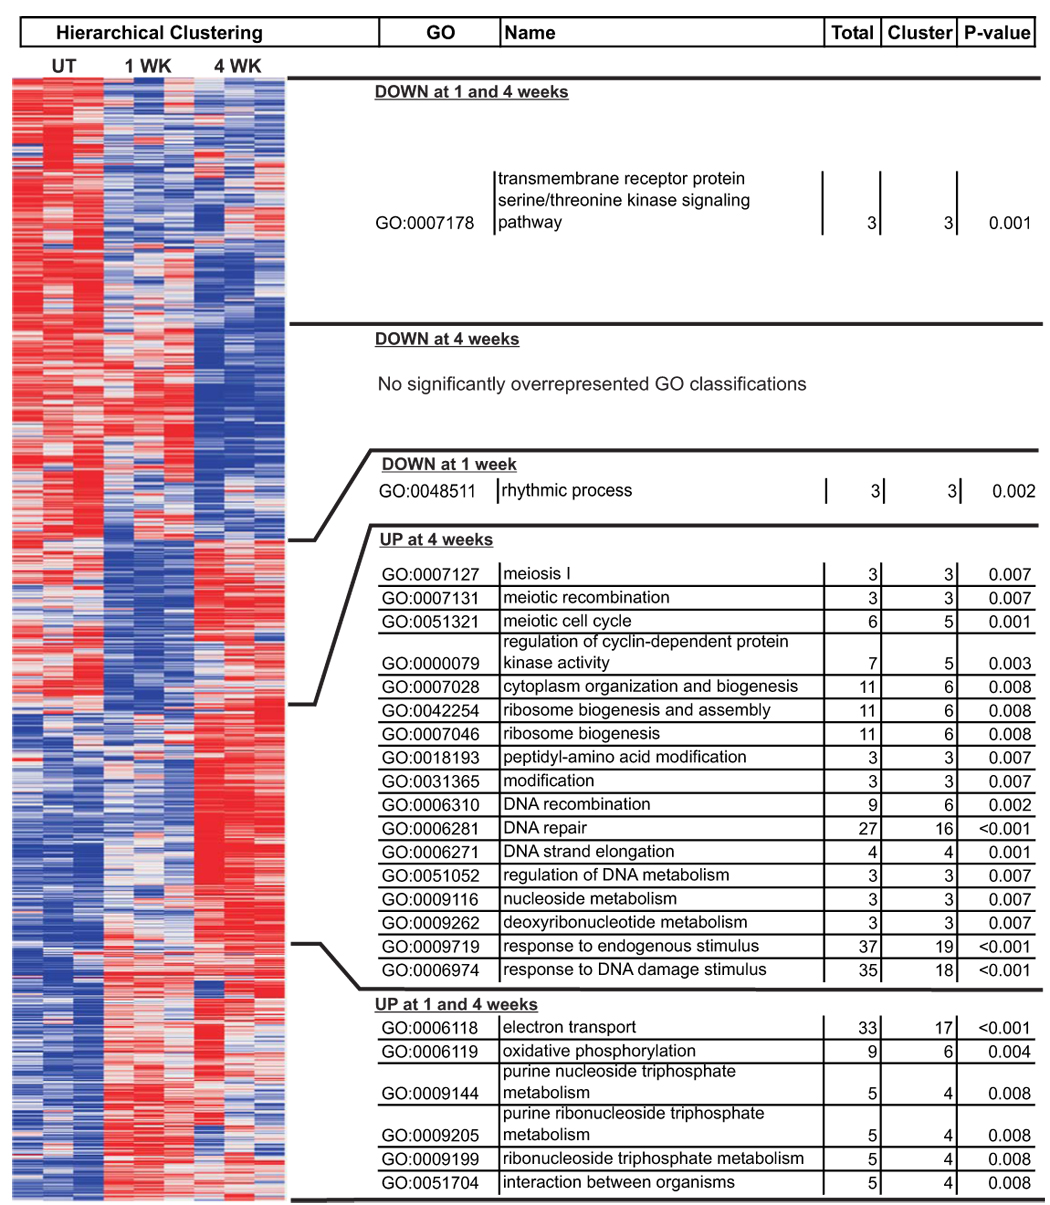
Each cell in the heat map represents the expression level of a gene (row) in a single sample (column) normalized to the average of that transcript in vehicle-treated samples. Note that samples cluster together based on gene expression profile. The right side of the figure denotes GO biological process classifications that are overrepresented in the adjacent cluster as compared to the whole. The number of genes in that cluster fitting a particular classification are compared with the total number of differentially expressed genes in that classification using Fisher’s exact test (eGOn).
When necessary, conversion from Unigene ID to other public ID types (e.g., gene symbol or GenBank Accession number) was performed using the Database for Annotation, Visualization, and Integrated Discovery (DAVID), available online at NIAID (http://david.abcc.ncifcrf.gov/) (Dennis et al., 2003).
Hierarchical clustering
Unsupervised hierarchical clustering was performed by GenePattern (http://www.broad.mit.edu/cancer/software/genepattern/index.html) using Pearson’s correlation (Reich et al., 2006). For analysis of time-dependent clusters of differentially expressed genes, input was normalized to control at each time point by using the log2 ratio of rotenone versus vehicle expression at time zero (untreated), 1 week, or 4 weeks.
Results
Basic expression data
All 15 samples and corresponding microarrays met quality control standards. 8445 out of 18810 unique transcripts on the array were expressed under at least one condition in culture (45%).
Gene set enrichment analysis (GSEA) implicates selected pathways in rotenone toxicity
Gene set enrichment analysis was used to compare vehicle-treated control samples with rotenone-treated samples from both time points. Out of 178 sets of functionally-related genes that were sufficiently represented in our samples, 16 were significantly overrepresented in rotenone-treated samples with a nominal p-value < 0.05 and an FDR q-value < 0.3 (Table 1). As such, 11 of these sets are expected to be truly increased by rotenone exposure. A majority of the gene sets (9 of 16) was related to mitochondrial function and energy production. Leading edge analysis confirmed that genes related to mitochondrial energy production are the primary drivers for these differentially expressed genes. The concerted upregulation of 30 of 61 oxidative phosphorylation (VOXPHOS) transcripts is graphically represented in Fig. 1. Each cell in the heatmap represents the relative fold change in expression (red = high, blue = low). Sixteen of the top thirty genes are subunits of complex I. Transcripts encoding proteins involved in protein degradation, purine/pyrimidine metabolism, and fatty acid metabolism were also upregulated during rotenone exposure. No gene sets were coordinately downregulated by rotenone.
Table 1.
Gene sets increased by rotenone treatment.
| GENESET NAME | TOTAL | CORE | p-value | FDR |
|---|---|---|---|---|
| *VOXPHOS | 61 | 42 | 0.006 | 0.268 |
| *ELECTRON_TRANSPORT_CHAIN | 64 | 40 | 0.004 | 0.192 |
| *HUMAN_MITODB_6_2002 | 289 | 131 | 0.010 | 0.172 |
| *MAP00010_GLYCOLYSIS_GLUCONEOGENESIS | 20 | 12 | 0.008 | 0.157 |
| *MITOCHONDR | 289 | 131 | 0.006 | 0.131 |
| MAP00240_PYRIMIDINE_METABOLISM | 30 | 12 | 0.018 | 0.177 |
| PROTEASOMEPATHWAY | 19 | 14 | 0.021 | 0.188 |
| *PGC | 236 | 90 | 0.006 | 0.215 |
| *KREBS-TCA_CYCLE | 17 | 11 | 0.039 | 0.202 |
| *GO_0005739 (MITOCHONDRION) | 112 | 50 | 0.011 | 0.188 |
| MAP00230_PURINE_METABOLISM | 46 | 16 | 0.006 | 0.203 |
| MAP00071_FATTY_ACID_METABOLISM | 17 | 7 | 0.021 | 0.222 |
| GLUT_DOWN | 203 | 60 | 0.037 | 0.208 |
| PROTEASOME_DEGRADATION | 23 | 15 | 0.045 | 0.221 |
| *ELECTRON_TRANSPORTER_ACTIVITY | 59 | 26 | 0.036 | 0.273 |
| HTERT_DOWN | 36 | 9 | 0.014 | 0.274 |
GSEA of rotenone v. vehicle-treated cells. Geneset name is from MSigDB 1.0. Total is the number of genes from the geneset that are expressed in our dataset. Core is the number of genes in the 'leading edge' of the gene set; a higher ratio of core to total genes indicates a more robust enrichment. P-value and False Discovery Rate are measures of the significance of the enrichment.
indicates metabolism-related geneset.
Figure 1. Upregulation of oxidative phosphorylation genes in rotenone-treated cells.
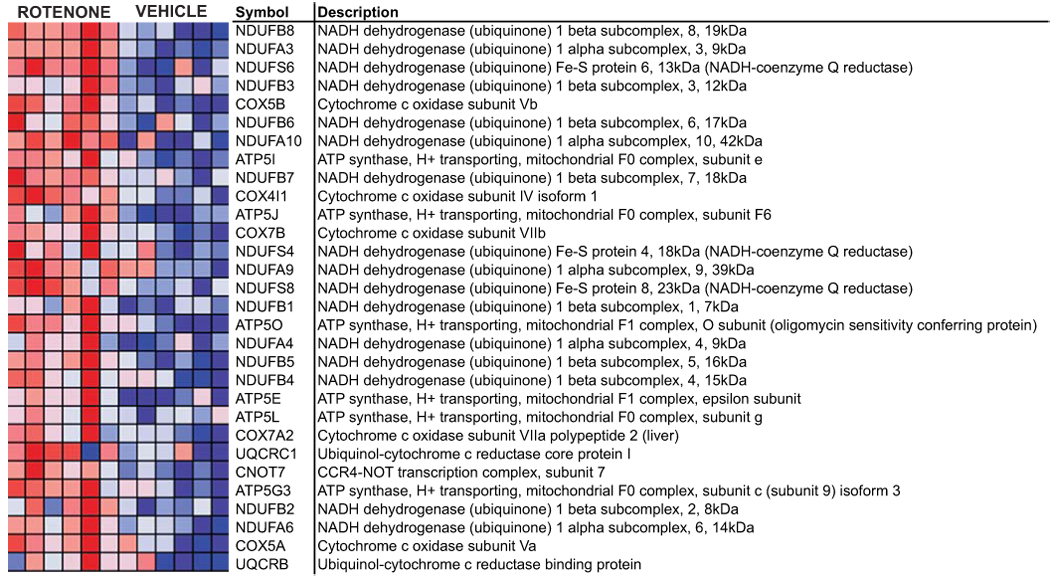
Each cell in the heatmap represents the expression level of a gene (row) in a single sample (column). N=6 for both control and rotenone-treated samples. Deep red reflects overexpression of the transcript, whereas deep blue represents underexpression.
Two gene sets were coordinately higher (p-value < 0.05 and FDR < 0.3) after 4 weeks of rotenone exposure as compared to 1 week, ATRBRCAPATHWAY and ATMPATHWAY. These sets contain genes related to recognition of DNA damage and DNA repair. The ATR-BRCA DNA repair pathway is highlighted in Fig 2. No gene sets were significantly higher at 1 week than 4 weeks, although the cell cycle checkpoint kinases ATM and ATR, and their checkpoint target protein RAD17, were early responders (Fig 2).
Figure 2. Upregulation of a DNA repair pathway involving ATR and BRCA (ATRBRCAPATHWAY) in cells treated with rotenone for 4 weeks.
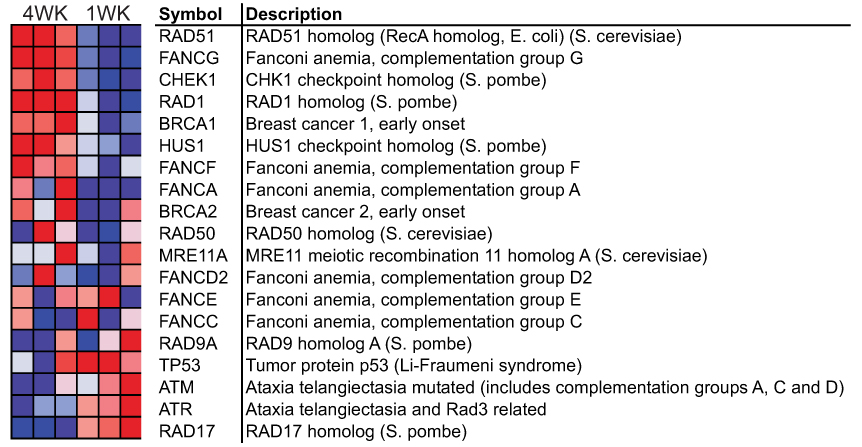
Each cell in the heatmap represents the expression level of a gene (row) in a single rotenone-treated sample (column) normalized to the average expression of that transcript in vehicle-treated samples. N=3 for both 1 and 4 week rotenone-treated samples. Deep red reflects overexpression of the transcript, whereas deep blue represents underexpression.
Categorical analysis of differentially expressed genes supports the GSEA results
Data concerning differentially expressed genes is summarized in Table 2. Of note, the magnitude of the expression changes induced by chronic rotenone exposure is relatively small, with the median change in intensity being 15% after 1 week and 30% after 4 weeks. Since the goal of these experiments was to identify concerted changes in cellular pathways, rather than to cherry-pick selected genes, subsequent analysis of expression differences is independent of the magnitude of change for any individual transcript.
Table 2.
Differential gene expression during rotenone exposure.
| Week 1 | Week 4 | |
|---|---|---|
| Number of differentially expressed probe sets (rotenone v. vehicle) | 657 (8.3%) | 888 (10.9%) |
| Range of expression change | −56% to +342% | −78% to +282% |
| Mean expression change | ± 25% | ± 32% |
| Median expression change | ± 15% | ± 30% |
For analysis of the broad rotenone effect, the 1 and 4 week lists were combined and duplicates removed. The entire list of differentially expressed genes was analyzed by Gene Ontology hierarchy using eGOn (Table 3). As in the gene set enrichment analysis, transcripts related to energy production and fatty acid metabolism were increased by rotenone, but the eGOn analysis suggests that transcripts related more specifically to steroid metabolism may be predominantly responsible for the fatty acid metabolism signature. In addition, nucleotide metabolism, rRNA metabolism, and alcohol metabolism appear to be enhanced by rotenone exposure, whereas regulation of signal transduction and metal ion transport (particularly of Zn2+) are diminished. The categorical differences in the biological process hierarchy are evident in the molecular function and cellular compartment classifications as well. Interestingly, in addition to transcripts encoding mitochondrial proteins being more prominent, proteasome transcripts are also more abundant after rotenone treatment. This correlates with a decrease in transcripts encoding endoplasmic reticulum proteins, suggesting an activation of one or more ER stress responses.
Table 3.
GO classifications altered by rotenone.
| GO Number | Name | UP | DOWN | p-value | CLASS |
|---|---|---|---|---|---|
| GO:0008150 | biological process | 436 | 458 | ||
| Categories increased by rotenone | |||||
| GO:0009117 | nucleotide metabolism | 15 | 4 | 0.010 | Met |
| GO:0006091 | generation of precursor metabolites and energy | 39 | 8 | <0.001 | Met |
| GO:0006118 | electron transport | 27 | 6 | <0.001 | Met |
| GO:0006066 | alcohol metabolism | 22 | 3 | <0.001 | Met |
| GO:0006694 | steroid biosynthesis | 9 | 1 | 0.010 | |
| GO:0016126 | sterol biosynthesis | 7 | 0 | 0.006 | |
| GO:0016072 | rRNA metabolism | 9 | 0 | 0.001 | Prot |
| GO:0006364 | rRNA processing | 8 | 0 | 0.003 | Prot |
| Categories decreased by rotenone | |||||
| GO:0030001 | metal ion transport | 0 | 13 | <0.001 | |
| GO:0009966 | regulation of signal transduction | 4 | 18 | 0.004 | |
| GO:0003674 | molecular function | 452 | 489 | ||
| Categories increased by rotenone | |||||
| GO:0016491 | oxidoreductase activity | 61 | 18 | <0.001 | Met |
| GO:0009055 | electron carrier activity | 22 | 7 | 0.002 | Met |
| GO:0016651 | oxidoreductase activity, acting on NADH or NADPH | 14 | 1 | <0.001 | Met |
| GO:0043167 | hydrogen ion transporter activity | 13 | 1 | 0.001 | Met |
| GO:0003954 | NADH dehydrogenase activity | 12 | 1 | 0.001 | Met |
| GO:0004298 | threonine endopeptidase activity | 7 | 0 | 0.006 | Prot |
| GO:0015077 | structural constituent of ribosome | 13 | 2 | 0.003 | Prot |
| Categories decreased by rotenone | |||||
| GO:0004871 | metal ion binding | 93 | 145 | 0.002 | |
| GO:0008270 | cation binding | 77 | 129 | 0.001 | |
| GO:0046872 | zinc ion binding | 49 | 88 | 0.002 | |
| GO:0004872 | signal transducer activity | 23 | 50 | 0.003 | |
| GO:0004888 | receptor activity | 14 | 37 | 0.002 | |
| GO:0004888 | transmembrane receptor activity | 5 | 21 | 0.003 | |
| GO:0005575 | cellular component | 422 | 464 | ||
| Categories increased by rotenone | |||||
| GO:0044428 | nuclear part | 53 | 33 | 0.006 | |
| GO:0000228 | nuclear chromosome | 8 | 0 | 0.003 | |
| GO:0005739 | mitochondrion | 66 | 13 | <0.001 | Met |
| GO:0031966 | mitochondrial membrane | 11 | 1 | 0.002 | Met |
| GO:0005743 | mitochondrial inner membrane | 10 | 1 | 0.004 | Met |
| GO:0005759 | mitochondrial matrix | 9 | 0 | 0.001 | Met |
| GO:0005761 | mitochondrial ribosome | 7 | 0 | 0.005 | Met/Prot |
| GO:0000502 | proteasome complex | 10 | 1 | 0.004 | Prot |
| GO:0005839 | proteasome core complex | 7 | 0 | 0.005 | Prot |
| Categories decreased by rotenone | |||||
| GO:0005783 | endoplasmic reticulum | 16 | 41 | 0.002 | Prot |
UP and DOWN columns indicate the number of transcripts altered by rotenone in a particular GO classification under each main GO hierarchy. Only statistically significant classifications (p ≤ 0.01, Fisher's exact test) are listed. Redundant or uninformaitve classifications were eliminated. Two overaching themes (CLASS) were noted in the data: Metabolism and Protein handling.
The greater number of expression changes after 4 weeks of rotenone exposure (Table 2) suggested a time-dependence of the expression changes, so we also examined categorical differences between rotenone and vehicle expression profiles at only the 4 week time point. EGOn analysis revealed an up-regulation of six categories, including alcohol metabolism (GO:0006066), DNA metabolism (GO:0006259), DNA replication (GO:0006260), and regulation of cyclin-dependent protein kinase activity (GO:0000079). Two representative categories, generation of energy (GO:0006091) and DNA repair (GO:0006281) are pictured in Fig 3. Although the mean expression change for each category is similar at 4 weeks, the temporal pattern for the gene categories is markedly different. Transcripts related to energy generation are increased after only 1 week, but DNA repair-related genes do not become prominent until 4 weeks of rotenone treatment. The pattern observed in both categories is concordant with the differences detected by GSEA.
Figure 3. Elevation of energy metabolism transcripts precedes elevation of DNA repair transcripts during rotenone intoxication.
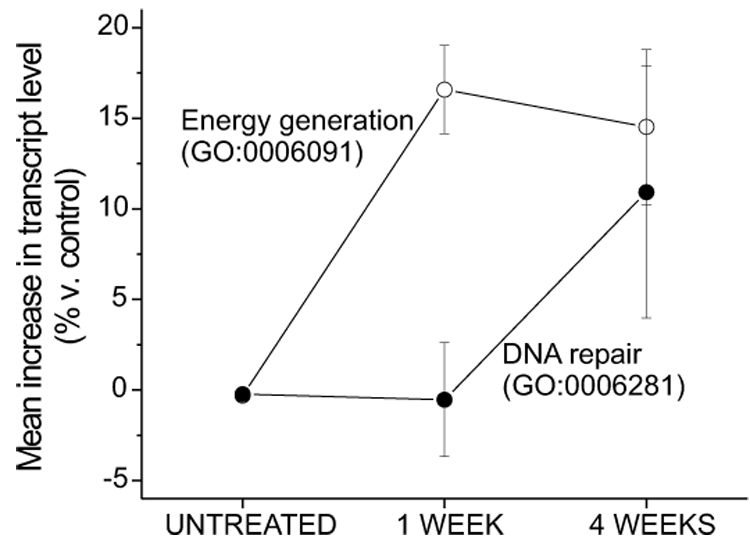
The mean percentage change (± SEM) is comprised of individual expression changes of transcripts in that category relative to control induced by rotenone treatment. The energy generation category contained 48 genes and the DNA repair category 26.
Clustering analysis reveals the time-dependent nature of the rotenone effect
Categorical analysis provided insight into the effect of time on rotenone-induced gene expression changes that was confirmed and expanded by hierarchical clustering analysis. The list of genes with expression changed by rotenone was automatically sorted by GenePattern into five prominent clusters based on the direction of the rotenone effect over time (Fig 4). The total number of differentially expressed genes and the number of those genes in the adjacent cluster are listed. Only categories significant at p < 0.01 containing more than 50% of the total genes are presented. Hierarchical clustering confirmed an early increase in expression of genes related to energy production that persisted through 4 weeks in culture (Fig 4; UP at 1 and 4 weeks). Transcripts related to nucleic acid metabolism, DNA damage and repair, and cell cycle regulation were increased by rotenone only after 4 weeks of treatment (Fig 4; UP at 4 weeks). Table 4 lists transcripts from the GO classification for response to DNA damage stimulus (GO:0006974) and the associated percentage increase at 4 weeks compared to vehicle-treated cells. Few categories were coherently down-regulated by rotenone exposure.
Table 4.
Transcripts that respond to DNA damage are increased after 4 weeks of rotenone treatment.
| Accession | Symbol | Name | Increase (%) |
|---|---|---|---|
| CR602562 | ATXN3 | Ataxin 3 | 26 |
| AW340307 | BARD1 | BRCA1 associated RING domain 1 | 35 |
| BX414303 | CHEK1 | CHK1 checkpoint homolog (S. pombe) | 86 |
| BU076880 | CCNH | Cyclin H | 29 |
| AF060479 | EXO1 | Exonuclease 1 | 68 |
| BM511575 | FANCG | Fanconi anemia, complementation group G | 44 |
| BU630449 | MUS81 | MUS81 endonuclease homolog (S. cerevisiae) | 17 |
| AW590882 | MRPS9 | Mitochondrial ribosomal protein S9 | 44 |
| D16581 | NUDT1 | Nudix (nucleoside diphosphate linked moiety X)-type motif 1 | 84 |
| NM_016937 | POLA1 | Polymerase (DNA directed), alpha 1 | 21 |
| CR615139 | POLE2 | Polymerase (DNA directed), epsilon 2 (p59 subunit) | 24 |
| AF169796 | RAD18 | RAD18 homolog (S. cerevisiae) | 40 |
| BE464128 | RAD51AP1 | RAD51 associated protein 1 | 74 |
| CN396137 | RAD54B | RAD54 homolog B (S. cerevisiae) | 24 |
| CA773606 | RFC4 | Replication factor C (activator 1) 4, 37kDa | 31 |
| AB208992 | RFC5 | Replication factor C (activator 1) 5, 36.5kDa | 28 |
| CR598187 | UBE2N | Ubiquitin-conjugating enzyme E2N (UBC13 homolog, yeast) | 28 |
List of transcripts increased at 4 weeks from GO:0006974, "response to DNA damage stimulus" (Fig 4). Percent increase is compared to vehicle-treated cells at 4 weeks.
Analysis of transcription factor binding sites
We examined transcription factor binding sites in several gene sets shown to be different by GSEA in an attempt to determine whether or not specific transcription factors might be responsible for the observed concerted changes. No significant commonalities in transcription factor binding sites between metabolic genes were identified. When compared to a random set of expressed genes or a set comprising the least variable genes in this analysis, sets of energy metabolism genes had no regulatory binding sequences that were significantly overrepresented in their promoter regions. When the opposite comparison was made (random set v. VOXPHOS) nearly 20 transcription factor binding sites were more prominent in the random set. The comparative lack of regulatory binding sites in metabolic gene sets suggests that their increase may not be mediated by transcriptional activation. There is the possibility that increased abundance of metabolic transcripts results from their stabilization in the face of complex I inhibition. In fact, mRNA stability has been previously reported to be altered in the face of metabolic inhibition (Crawford et al., 1997). More detailed experiments involving transcriptional profiling in the presence of transcription inhibitors would be necessary to further clarify this issue.
Discussion
We have found that chronic exposure to the mitochondrial complex I inhibitor rotenone causes concerted alterations in gene expression in human neuroblastoma cells. This is the first comprehensive analysis of gene expression in a rotenone model of Parkinson’s disease (PD), and it sheds light on the progression of pathology that occurs during chronic low-level mitochondrial inhibition.
This particular model has many similarities to PD pathology that make it a good starting point for exploration of transcriptional alterations during induction of parkinsonism. First, the SK-N-MC neuroblastoma cell line used represents a well-characterized, relatively homogeneous population of cells that can be cultured in the presence of rotenone for an extended period. This meets a critical need to begin exploring cellular responses to parkinsonian toxins over longer periods than the 4–48 hours that have been typically reported, especially since PD pathology in patients is thought to develop chronically. Second, the concentration of rotenone used for these experiments was carefully chosen to avoid acute effects on cell growth or induction of frank necrotic cell death precisely so longer-term effects and compensatory responses could be examined. Using this dose, an increase in apoptotic cells not apparent until after 4 weeks of rotenone exposure is preceded by other harbingers of PD pathology, such as α-synuclein aggregation and oxidative damage (Sherer et al., 2002, Sherer et al., 2003). Finally, the time points prior to (1 week) and during (4 weeks) low-levels of apoptotic death induced by rotenone represent critical junctures leading to their ultimate fate.
Evaluating cellular pathways, instead of individual genes, dramatically lowers false positive findings and provides power for detecting relevant differences in gene expression (Toronen, 2004, Subramanian et al., 2005, Greene, 2006, Ye and Eskin, 2007). Since this analysis method is independent of the magnitude of individual expression differences, it eliminates bias associated with arbitrarily selecting individual transcripts for further investigation. Comparison of our dataset to both a manually curated group of gene sets (GSEA) and the Gene Ontology hierarchy (eGOn) gave qualitatively similar results, an important point since pathway analyses such as this are dependent on accurate classification of genes based on function. Analysis of microarray data in this manner has been shown to be more robust than the more traditional method of ‘validating’ individual genes of interest using other techniques that are less sensitive, such as real-time PCR or Northern blotting (Subramanian et al., 2005). In conjunction with previous data from our laboratory indicating a high correlation between data from Affymetrix microarrays and quantitative real-time RT-PCR (Greene et al., 2005), we are confident in the validity of these results, which suggest that several mechanisms are particularly important in the manifestation of chronic rotenone toxicity, including DNA damage; dysregulation of energy metabolism; and dysfunctional protein metabolism.
DNA damage
Damage to DNA is recognized by rotenone-treated SK-N-MC cells and causes a vigorous repair response. This indicates that the DNA damage is functionally relevant to the cell and to the manifestation of chronic rotenone toxicity. Our work extends and accentuates the significance of previous reports from our lab in the same model, which described a qualitative increase in 8-hydroxydeoxyguanosine (8-OHdG) immunoreactivity after long-term exposure to rotenone (Sherer et al., 2002). Based on the gene expression profile, we can infer that damage to DNA becomes progressively worse as complex I inhibition continues. For instance, there are abnormalities in DNA synthesis, replication, damage sensing, and repair that occur solely after 4 weeks of rotenone exposure.
Dividing SK-N-MC cells are likely to be more susceptible to DNA damage and more dependent on DNA repair than post-mitotic dopamine neurons in situ, which may magnify the response to DNA damage in this cell population. However, the finding that DNA damage occurs in response to rotenone intoxication remains generalizable to other cell types and is particularly interesting in light of the fact that dopamine neurons from PD patients accumulate significant nuclear and mitochondrial DNA damage (Alam et al., 1997, Bender et al., 2006, Hegde et al., 2006). Evidence that the DNA repair enzyme hMUTYH, which acts to repair 8-OHdG-induced mutations, is specifically upregulated in substantia nigra dopamine neurons in PD brains (Arai et al., 2006) correlates with our finding of DNA repair upregulation in response to rotenone. Furthermore, attempts to repair DNA damage may exacerbate neuronal death in the setting of metabolic compromise (Mandir et al., 1999). As such, complex I inhibition may initiate a vicious cycle between metabolic inhibition and DNA damage that stands out as a prominent mechanism of neurodegeneration.
Dysregulation of energy metabolism
In the presence of worsening genotoxic stress, there appeared to be a widespread cellular attempt to maintain oxidative metabolism in the face of rotenone intoxication that persisted for the duration of exposure to the toxin. The breadth of this response encompassed all aspects of energy metabolism including glycolysis, the tricarboxylic acid cycle, fatty acid metabolism, and electron transport. The response of NADH dehydrogenase transcripts was particularly robust, as evidenced by the large number of complex I subunits contributing to the leading edge of metabolic gene sets. This response has been noted in response to rotenone in other cell lines and is similar to that which occurs in PC12 cells after 8 hours of exposure to a different parkinsonian toxin, 6-OHDA (Lister et al., 2004, Ryu et al., 2005, Coe et al., 2007).
It is relatively straightforward to understand why an increase in oxidative damage to DNA mobilizes repair mechanisms in an attempt to mitigate that injury. It is less clear, presuming that oxygen radicals are deleterious in this setting, whether an increase in energy metabolism would be, on balance, beneficial to cells. Based on the totality of these gene expression results, we hypothesize that the early increase in oxidative metabolism gene expression worsens the ultimate outcome. For instance, with more metabolic machinery available, the absolute flux of electrons through mitochondria would increase. While mitochondrial function might be augmented, generation of free radicals would also increase, especially in the continued presence of rotenone. Thus, in the continued presence of rotenone, an increase in metabolic machinery would cause a deleterious increase in the absolute amount of oxidant stress. In fact, as mentioned above oxidative damage to proteins, lipids, and DNA increases progressively with persistent complex I inhibition in this model (Sherer et al., 2002, Sherer et al., 2003).
Addressing this theory experimentally hinges on interrupting the signaling cascade responsible for upregulating metabolic transcripts. Our transcription factor analysis revealed no particularly prominent binding sites in the promoter regions of 62 oxidative phosphorylation genes that would account for the observed increase in the pathway. Given that complex I subunits are so dramatically induced by rotenone treatment, investigation of transcriptional and posttranslational regulation of complex I is a logical next step toward determining the signaling mechanism by which rotenone causes a potentially harmful augmentation of all facets of cellular energy metabolism. Oxidative radicals, NADH/NAD+ ratio, ATP level, and complex I subunit concentration, among other things, may be relevant signals in this context. For further investigation, it will be important to remember that electron flux, not capacity, is the relevant issue, so measurement of enzyme amount or maximal activity will not address it adequately. Real-time measurement of metabolic parameters such as oxygen utilization and oxygen radical production will likely be required.
Dysfunctional protein metabolism
Overall, SK-N-MC cells treated with rotenone exhibit a transcriptional response consistent with protein damage. Transcripts related to the proteasome and proteasome degradation were up-regulated during exposure to rotenone; this was coupled with a decrease in transcripts encoding proteins targeted to the endoplasmic reticulum (ER). These data are consistent with an ER stress or unfolded protein response (Schroder and Kaufman, 2005, Schroder, 2006, Zhang and Kaufman, 2006).
Protein stress has been a common and robust theme in studies of acute exposure to parkinsonian toxins in neuroblastoma cells (Ryu et al., 2002, Holtz and O'Malley, 2003, Holtz et al., 2006). Our data support abnormalities in protein handling in chronic rotenone toxicity by demonstrating an increase in proteasome transcripts and a decrease in ER transcripts. Interestingly, further temporal analysis of one specific transcript important in ER stress pathways, GADD153/CHOP, suggests that the cell’s response to protein damage in this model is dependent on time. After 4 hours of rotenone exposure, GADD153 transcript level increased by about 25% (not shown) in agreement with previously reported results (Conn et al., 2002, Ryu et al., 2002, Silva et al., 2005). However, our data show that during chronic exposure to rotenone, GADD153 is decreased. Consistent with the biphasic response seen in this study, activation of the unfolded protein response is thought to be temporally limited (Schroder and Kaufman, 2005). Since therapeutic opportunities for neurodegenerative diseases are currently only available after pathology has begun, targeting pathways involved in maintaining, rather than initiating, responses to damaged proteins could be an effective strategy for slowing the gradual apoptotic cellular loss seen in this model and hypothesized to occur in PD.
Relevance to human PD
These data illuminate the sequential nature of transcript alterations induced by chronic inhibition of complex I. In particular, a late increase in transcripts related to DNA damage and repair was preceded by an upregulation of cellular energy metabolism, with complex I itself being most noticeably affected. This improved understanding of the temporal characteristics of complex I inhibition and the resulting cellular response provides insight into the neurodegenerative process occurring in PD and suggests that appropriate neuroprotective intervention will depend as much on timing as target.
Another key finding from this study is confirmation that meaningful results can be obtained by analyzing broad-based small magnitude changes beyond the sensitivity of other techniques like quantitative PCR or immunoblotting (Subramanian et al., 2005). As such, this type of experiment and analysis may be particularly important for understanding the evolution of neurodegenerative diseases, when damage occurs slowly over a long period of time. In fact, GSEA or other categorical approaches may allow evaluation of mild chronic neurodegenerative phenotypes that have been previously unrevealing, and comparisons between different model systems and humans might be fruitful in delineating particularly important pathogenic mechanisms (Fortunel et al., 2003, Subramanian et al., 2005).
Acknowledgements
Supported by NINDS NS048858 (JGG), NIEHS ES012068 (JTG), the Picower Foundation (JTG), and a Cotzias Fellowship from the American Parkinson Disease Association (JGG).
Abbreviations
- 8-OHdG
8-hydroxydeoxyguanosine
- DAVID
Database for Annotation, Visualization, and Integrated Discovery
- EtOH
ethanol
- ER
endoplasmic reticulum
- EST
expressed sequence tag
- FDR
false discovery rate
- GO
gene ontology
- GSEA
gene set enrichment analysis
- MEM
minimum essential medium
- PD
Parkinson’s disease
Footnotes
Publisher's Disclaimer: This is a PDF file of an unedited manuscript that has been accepted for publication. As a service to our customers we are providing this early version of the manuscript. The manuscript will undergo copyediting, typesetting, and review of the resulting proof before it is published in its final citable form. Please note that during the production process errors may be discovered which could affect the content, and all legal disclaimers that apply to the journal pertain.
References
- Alam ZI, Daniel SE, Lees AJ, Marsden DC, Jenner P, Halliwell B. A generalised increase in protein carbonyls in the brain in Parkinson's but not incidental Lewy body disease. J Neurochem. 1997;69:1326–1329. doi: 10.1046/j.1471-4159.1997.69031326.x. [DOI] [PubMed] [Google Scholar]
- Arai T, Fukae J, Hatano T, Kubo S, Ohtsubo T, Nakabeppu Y, Mori H, Mizuno Y, Hattori N. Up-regulation of hMUTYH, a DNA repair enzyme, in the mitochondria of substantia nigra in Parkinson's disease. Acta Neuropathol (Berl) 2006;112:139–145. doi: 10.1007/s00401-006-0081-9. [DOI] [PubMed] [Google Scholar]
- Beisvag V, Junge FK, Bergum H, Jolsum L, Lydersen S, Gunther CC, Ramampiaro H, Langaas M, Sandvik AK, Laegreid A. GeneTools--application for functional annotation and statistical hypothesis testing. BMC Bioinformatics. 2006;7:470. doi: 10.1186/1471-2105-7-470. [DOI] [PMC free article] [PubMed] [Google Scholar]
- Ben-Shlomo Y. The epidemiology of Parkinson's disease. Baillieres Clin Neurol. 1997;6:55–68. [PubMed] [Google Scholar]
- Bender A, Krishnan KJ, Morris CM, Taylor GA, Reeve AK, Perry RH, Jaros E, Hersheson JS, Betts J, Klopstock T, Taylor RW, Turnbull DM. High levels of mitochondrial DNA deletions in substantia nigra neurons in aging and Parkinson disease. Nat Genet. 2006;38:515–517. doi: 10.1038/ng1769. [DOI] [PubMed] [Google Scholar]
- Betarbet R, Sherer TB, MacKenzie G, Garcia-Osuna M, Panov AV, Greenamyre JT. Chronic systemic pesticide exposure reproduces features of Parkinson's disease. Nat Neurosci. 2000;3:1301–1306. doi: 10.1038/81834. [DOI] [PubMed] [Google Scholar]
- Coe KJ, Jia Y, Ho HK, Rademacher P, Bammler TK, Beyer RP, Farin FM, Woodke L, Plymate SR, Fausto N, Nelson SD. Comparison of the cytotoxicity of the nitroaromatic drug flutamide to its cyano analogue in the hepatocyte cell line TAMH: evidence for complex I inhibition and mitochondrial dysfunction using toxicogenomic screening. Chemical research in toxicology. 2007;20:1277–1290. doi: 10.1021/tx7001349. [DOI] [PMC free article] [PubMed] [Google Scholar]
- Conn KJ, Gao WW, Ullman MD, McKeon-O'Malley C, Eisenhauer PB, Fine RE, Wells JM. Specific up-regulation of GADD153/CHOP in 1-methyl-4-phenyl-pyridinium-treated SH-SY5Y cells. J Neurosci Res. 2002;68:755–760. doi: 10.1002/jnr.10252. [DOI] [PubMed] [Google Scholar]
- Crawford DR, Wang Y, Schools GP, Kochheiser J, Davies KJ. Down-regulation of mammalian mitochondrial RNAs during oxidative stress. Free Radic Biol Med. 1997;22:551–559. doi: 10.1016/s0891-5849(96)00380-2. [DOI] [PubMed] [Google Scholar]
- Dai M, Wang P, Boyd AD, Kostov G, Athey B, Jones EG, Bunney WE, Myers RM, Speed TP, Akil H, Watson SJ, Meng F. Evolving gene/transcript definitions significantly alter the interpretation of GeneChip data. Nucleic Acids Res 33. 2005:e175. doi: 10.1093/nar/gni179. [DOI] [PMC free article] [PubMed] [Google Scholar]
- Dennis G, Jr, Sherman BT, Hosack DA, Yang J, Gao W, Lane HC, Lempicki RA. DAVID: Database for Annotation, Visualization, and Integrated Discovery. Genome Biol. 2003;4:P3. [PubMed] [Google Scholar]
- Fortunel NO, Otu HH, Ng HH, Chen J, Mu X, Chevassut T, Li X, Joseph M, Bailey C, Hatzfeld JA, Hatzfeld A, Usta F, Vega VB, Long PM, Libermann TA, Lim B. Comment on " 'Stemness': transcriptional profiling of embryonic and adult stem cells" and "a stem cellmolecular signature". Science. 2003;302:393. doi: 10.1126/science.1086384. author reply 393. [DOI] [PubMed] [Google Scholar]
- Greene JG. Gene expression profiles of brain dopamine neurons and relevance to neuropsychiatric disease. J Physiol. 2006;575:411–416. doi: 10.1113/jphysiol.2006.112599. [DOI] [PMC free article] [PubMed] [Google Scholar]
- Greene JG, Dingledine R, Greenamyre JT. Gene expression profiling of rat midbrain dopamine neurons: implications for selective vulnerability in parkinsonism. Neurobiol Dis. 2005;18:19–31. doi: 10.1016/j.nbd.2004.10.003. [DOI] [PubMed] [Google Scholar]
- Hegde ML, Gupta VB, Anitha M, Harikrishna T, Shankar SK, Muthane U, Subba Rao K, Jagannatha Rao KS. Studies on genomic DNA topology and stability in brain regions of Parkinson's disease. Arch Biochem Biophys. 2006;449:143–156. doi: 10.1016/j.abb.2006.02.018. [DOI] [PubMed] [Google Scholar]
- Hochberg Y, Benjamini Y. More powerful procedures for multiple significance testing. Stat Med. 1990;9:811–818. doi: 10.1002/sim.4780090710. [DOI] [PubMed] [Google Scholar]
- Holtz WA, O'Malley KL. Parkinsonian mimetics induce aspects of unfolded protein response in death of dopaminergic neurons. J Biol Chem. 2003;278:19367–19377. doi: 10.1074/jbc.M211821200. [DOI] [PubMed] [Google Scholar]
- Holtz WA, Turetzky JM, Jong YJ, O'Malley KL. Oxidative stress-triggered unfolded protein response is upstream of intrinsic cell death evoked by parkinsonian mimetics. J Neurochem. 2006;99:54–69. doi: 10.1111/j.1471-4159.2006.04025.x. [DOI] [PubMed] [Google Scholar]
- Karanam S, Moreno CS. CONFAC: automated application of comparative genomic promoter analysis to DNA microarray datasets. Nucleic Acids Res. 2004;32:W475–W484. doi: 10.1093/nar/gkh353. [DOI] [PMC free article] [PubMed] [Google Scholar]
- Krige D, Carroll MT, Cooper JM, Marsden CD, Schapira AH. Platelet mitochondrial function in Parkinson's disease. The Royal Kings and Queens Parkinson Disease Research Group. Ann Neurol. 1992;32:782–788. doi: 10.1002/ana.410320612. [DOI] [PubMed] [Google Scholar]
- Levenson JM, Choi S, Lee SY, Cao YA, Ahn HJ, Worley KC, Pizzi M, Liou HC, Sweatt JD. A bioinformatics analysis of memory consolidation reveals involvement of the transcription factor c-rel. J Neurosci. 2004;24:3933–3943. doi: 10.1523/JNEUROSCI.5646-03.2004. [DOI] [PMC free article] [PubMed] [Google Scholar]
- Lister R, Chew O, Lee MN, Heazlewood JL, Clifton R, Parker KL, Millar AH, Whelan J. A transcriptomic and proteomic characterization of the Arabidopsis mitochondrial protein import apparatus and its response to mitochondrial dysfunction. Plant physiology. 2004;134:777–789. doi: 10.1104/pp.103.033910. [DOI] [PMC free article] [PubMed] [Google Scholar]
- Mandir AS, Przedborski S, Jackson-Lewis V, Wang ZQ, Simbulan-Rosenthal CM, Smulson ME, Hoffman BE, Guastella DB, Dawson VL, Dawson TM. Poly(ADP-ribose) polymerase activation mediates 1-methyl-4-phenyl-1, 2,3,6-tetrahydropyridine (MPTP)-induced parkinsonism. Proc Natl Acad Sci U S A. 1999;96:5774–5779. doi: 10.1073/pnas.96.10.5774. [DOI] [PMC free article] [PubMed] [Google Scholar]
- Parker WD, Jr, Boyson SJ, Parks JK. Abnormalities of the electron transport chain in idiopathic Parkinson's disease. Ann Neurol. 1989;26:719–723. doi: 10.1002/ana.410260606. [DOI] [PubMed] [Google Scholar]
- Petrovitch H, Ross GW, Abbott RD, Sanderson WT, Sharp DS, Tanner CM, Masaki KH, Blanchette PL, Popper JS, Foley D, Launer L, White LR. Plantation work and risk of Parkinson disease in a population-based longitudinal study. Arch Neurol. 2002;59:1787–1792. doi: 10.1001/archneur.59.11.1787. [DOI] [PubMed] [Google Scholar]
- Reich M, Liefeld T, Gould J, Lerner J, Tamayo P, Mesirov JP. GenePattern 2.0. Nat Genet. 2006;38:500–501. doi: 10.1038/ng0506-500. [DOI] [PubMed] [Google Scholar]
- Ryu EJ, Angelastro JM, Greene LA. Analysis of gene expression changes in a cellular model of Parkinson disease. Neurobiol Dis. 2005;18:54–74. doi: 10.1016/j.nbd.2004.08.016. [DOI] [PubMed] [Google Scholar]
- Ryu EJ, Harding HP, Angelastro JM, Vitolo OV, Ron D, Greene LA. Endoplasmic reticulum stress and the unfolded protein response in cellular models of Parkinson's disease. J Neurosci. 2002;22:10690–10698. doi: 10.1523/JNEUROSCI.22-24-10690.2002. [DOI] [PMC free article] [PubMed] [Google Scholar]
- Schapira AH, Cooper JM, Dexter D, Jenner P, Clark JB, Marsden CD. Mitochondrial complex I deficiency in Parkinson's disease. Lancet. 1989;1:1269. doi: 10.1016/s0140-6736(89)92366-0. [DOI] [PubMed] [Google Scholar]
- Schroder M. The unfolded protein response. Mol Biotechnol. 2006;34:279–290. doi: 10.1385/MB:34:2:279. [DOI] [PubMed] [Google Scholar]
- Schroder M, Kaufman RJ. ER stress and the unfolded protein response. Mutat Res. 2005;569:29–63. doi: 10.1016/j.mrfmmm.2004.06.056. [DOI] [PubMed] [Google Scholar]
- Sherer TB, Betarbet R, Stout AK, Lund S, Baptista M, Panov AV, Cookson MR, Greenamyre JT. An in vitro model of Parkinson's disease: linking mitochondrial impairment to altered alpha-synuclein metabolism and oxidative damage. J Neurosci. 2002;22:7006–7015. doi: 10.1523/JNEUROSCI.22-16-07006.2002. [DOI] [PMC free article] [PubMed] [Google Scholar]
- Sherer TB, Betarbet R, Testa CM, Seo BB, Richardson JR, Kim JH, Miller GW, Yagi T, Matsuno-Yagi A, Greenamyre JT. Mechanism of toxicity in rotenone models of Parkinson's disease. J Neurosci. 2003;23:10756–10764. doi: 10.1523/JNEUROSCI.23-34-10756.2003. [DOI] [PMC free article] [PubMed] [Google Scholar]
- Silva RM, Ries V, Oo TF, Yarygina O, Jackson-Lewis V, Ryu EJ, Lu PD, Marciniak SJ, Ron D, Przedborski S, Kholodilov N, Greene LA, Burke RE. CHOP/GADD153 is a mediator of apoptotic death in substantia nigra dopamine neurons in an in vivo neurotoxin model of parkinsonism. J Neurochem. 2005;95:974–986. doi: 10.1111/j.1471-4159.2005.03428.x. [DOI] [PMC free article] [PubMed] [Google Scholar]
- Subramanian A, Tamayo P, Mootha VK, Mukherjee S, Ebert BL, Gillette MA, Paulovich A, Pomeroy SL, Golub TR, Lander ES, Mesirov JP. Gene set enrichment analysis: a knowledge-based approach for interpreting genome-wide expression profiles. Proc Natl Acad Sci U S A. 2005;102:15545–15550. doi: 10.1073/pnas.0506580102. [DOI] [PMC free article] [PubMed] [Google Scholar]
- Toronen P. Selection of informative clusters from hierarchical cluster tree with gene classes. BMC Bioinformatics. 2004;5:32. doi: 10.1186/1471-2105-5-32. [DOI] [PMC free article] [PubMed] [Google Scholar]
- Ye C, Eskin E. Discovering tightly regulated and differentially expressed gene sets in whole genome expression data. Bioinformatics. 2007;23:e84–e90. doi: 10.1093/bioinformatics/btl315. [DOI] [PubMed] [Google Scholar]
- Zhang K, Kaufman RJ. The unfolded protein response: a stress signaling pathway critical for health and disease. Neurology. 2006;66:S102–S109. doi: 10.1212/01.wnl.0000192306.98198.ec. [DOI] [PubMed] [Google Scholar]