SUMMARY
The role of altered contact mechanics in the pathogenesis of post-traumatic osteoarthritis (PTOA) following intra-articular fracture remains poorly understood. One proposed etiology is that residual incongruities lead to altered joint contact stresses that, over time, predispose to PTOA. Prevailing joint contact stresses following surgical fracture reduction were quantified in this study using patient-specific contact finite element (FE) analysis. FE models were created for 11 ankle pairs from tibial plafond fracture patients. Both (reduced) fractured ankles and their intact contralaterals were modeled. A sequence of 13 loading instances was used to simulate the stance phase of gait. Contact stresses were summed across loadings in the simulation, weighted by resident time in the gait cycle. This chronic exposure measure, a metric of degeneration propensity, was then compared between intact and fractured ankle pairs.
Intact ankles had lower peak contact stress exposures that were more uniform, and centrally located. The series-average peak contact stress elevation for fractured ankles was 38% (p=0.0015; peak elevation was 82%). Fractured ankles had less area with low contact stress exposure than intacts, and a greater area with high exposure. Chronic contact stress overexposures (stresses exceeding a damage threshold) ranged from near zero to a high of 18 times the matched intact value. The patient-specific FE models utilized in this study represent substantial progress towards elucidating the relationship between altered contact stresses and the outcome of patients treated for intra-articular fractures.
Keywords: joint incongruity, finite element analysis, intra-articular, post-traumatic arthritis
INTRODUCTION
The pathogenesis of osteoarthritis (OA) is poorly understood. Rapid onset and progression of OA often follows injury to a joint, its surrounding ligaments, and/or the joint capsule 1. A recent study 2 estimated that 12% of the reported cases of symptomatic OA involving one of the major joints of the lower extremity (hip, knee, or ankle) are post-traumatic. Post-traumatic osteoarthritis (PTOA) is an especially predictable outcome following displaced intra-articular fractures 2–4, particularly so for the tibial plafond fracture of the ankle. The mechano-pathology of PTOA has been linked to three causative factors: acute injury severity, chronic pathological loading due to residual instability, and elevated stresses due to residual incongruity 5–7. To better understand the relative influence of each factor on the progression of cartilage degeneration leading to PTOA, it is desirable to independently and accurately quantify each factor, and to correlate each with long-term patient outcome.
Displaced fractures of the tibial plafond are typically treated with surgical reduction and fixation, with the goal of decreasing any deleterious mechanical consequences of articular incongruity. Unfortunately, the ability to systematically study these mechanical effects has been limited to animal and cadaveric studies, involving highly idealized representations of fracture incongruity and joint loading 1,3,6,7. The altered joint mechanics in a series of intra-articular fracture patients has only been assessed indirectly, by crude measures of the degree to which the articular surface is restored 8. These measurements not only are imprecise, but they also constitute an imperfect surrogate for the mechanical environment (i.e., stress aberrations) that the cartilage sees following treatment and fracture healing.
Patient-specific computational (finite element (FE)) stress analysis provides a useful tool for assessing altered joint mechanics in this regard. To date, there have been only a few FE models of the ankle joint, and almost none that have attempted to simulate the entire sequence of load variation encountered during gait or other functional activity. Moreover, the great majority of FE models of natural joint contact stresses have simulated intact contact surfaces. The limited work with incongruity models has been restricted to ideally simplified geometries such as step-offs and gaps 3. There have as yet been no FE models of articular irregular incongruities secondary to actual intra-articular fractures in human patients 1.
The objective of the present study was to quantify joint contact stress alterations accompanying surgically reduced tibial plafond fractures, using patient-specific FE analysis. A better understanding of altered contact stresses, and the corresponding patient clinical outcome with residual incongruity, may help guide future fracture treatment decisions.
METHODS
Analysis cases were drawn from an ongoing clinical series of thirty-six patients with unilateral tibial plafond fractures. The ankles from eleven patients were successfully modeled, with poor CT scan quality being the primary reason for case exclusion from modeling. The age of patients included in the study ranged from 20 to 57 years old (mean of 33.5 years; standard deviation 11.4 years). Fractures included ranged in severity from a simple B-1 through a highly comminuted C-3, by the AO/OTA classification (Muller et al. 9). Informed consent was obtained from each of the patients, as per Institutional Review Board approval. The fractures were treated using articulated external fixation combined with limited internal fixation 10. Plain radiographs (AP, lateral, and mortise views) and CT scans were taken of the patients’ ankles.
FE Model Generation
A standard orthopaedic protocol was followed in acquiring CT scans of patients with unilateral intra-articular fractures of the tibial plafond. Scans were taken of patients’ uninjured contralateral intact ankles, and of their fractured ankles following surgical reduction (scans obtained within 12 hours). Helical CT scan settings were either 2 mm slice thickness × 0.5 mm reconstruction, or 0.63 mm slice thickness × 0.3 mm reconstruction. Slices were 512×512 pixels, acquired in the transverse plane, and with a field of view selected to provide in-plane spatial resolutions from 0.25 to 0.5 mm.
Tibial and talar bony surfaces were extracted from the patients’ CT image data using an iso-surfacing algorithm (OsiriX software; www.osirix-viewer.com) 11. Surfaces were formed by sub-voxel interpolation of Hounsfield intensities, based on a user-specified threshold. The resulting surfaces were smoothed and further refined utilizing reverse engineering software (Geomagic Studio; Geomagic, Research Triangle Park, NC). The tools utilized allow a user to alternatively smooth globally, or to interactively smooth local regions of a surface. The same modest degree of global smoothing was applied to intact and fractured ankle surfaces alike, with fractured surfaces usually requiring further interactive local smoothing, owing to focal surface incongruities. The aim in this process was to smooth features judiciously, balancing the smoothness requirements for successful FE contact simulation versus the need to preserve local surface irregularities in order to capture associated stress aberrations. Since the smoothing can substantially influence the FE-predicted contact stresses (20 to 30% reduction in peak contact stress 34), it was kept to the minimum amount necessary to obtaining successful FE solutions.
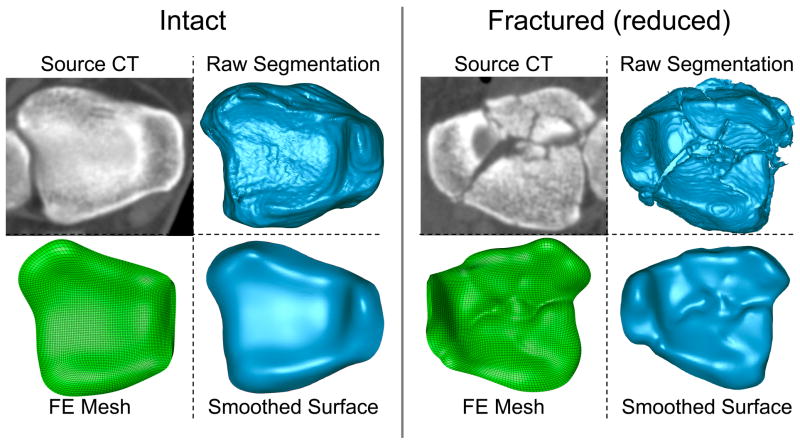
The raw and smoothed surfaces of an intact and a fractured ankle, derived from a representative patient, are shown in Figure 1. The average 3D deviation (across all processed ankles) between raw and smoothed surfaces was +/− 0.32 mm (please see supplementary materials for full details of the surface smoothing). This average value represents the difference of the final smoothed surface from the raw iso-surface extracted from CT data, rather than the difference of the smoothed surface from true anatomic geometry (as the latter was not available for live patients). Smoothed bone surfaces then were extruded 1.7 mm along the surface normal directions, to define uniform thickness cartilage volumes 12.
Figure 1.
A depiction of the process for generating patient-specific models. Inferior views of intact and fractured (reduced) source CT images, raw tibial bone surfaces from CT, smoothed tibial bone surfaces, and FE meshes of the cartilage volumes. (NOTE: these are for patient #4.)
CT data were acquired while patients lay supine, with their ankle joints plantar-flexed and externally rotated. This relaxed ankle joint posture was not the functionally neutral pose the ankle is normally in at the beginning of the stance phase of level walking. Therefore, working in an interactive medical data visualization environment (Data Manager; B3C BioComputing Competence Centre, Bologna, Italy) 13, an experienced ankle surgeon prescribed neutral weight-bearing apposition, using previously described procedures 14. For the cases processed, the reorientation of the joint ranged from 8 to 35° of dorsiflexion and from 0 to 18° of internal rotation. A landmark-based local reference frame was defined, as well, and the ankle was reoriented to align this local frame with a clinically appropriate global reference frame for subsequent ankle joint loading simulation.
Finite element meshes, representing the cartilage volume bounded by the subchondral plate, were then generated using commercial meshing software (TrueGrid; XYZ Scientific Applications, Livermore, CA). The number of elements used was determined in a mesh convergence study. Approximately 30,000 8-noded linear hexahedral elements sufficed to represent the tibial and talar cartilage. Each cartilage volume consisted of four element layers. The cartilage was backed with, and fixed to, a layer of rigid, 4-noded quadrilateral shell elements, simulating the much stiffer subchondral plate. Simulations of the stance phase of gait were performed using commercial FE software (ABAQUS Standard v.6.5; ABAQUS, Pawtucket, RI). The FE model formulation was previously detailed by Anderson et al. 14 and therefore will be only briefly described here. The cartilage volumes were modeled as homogeneous, isotropic and linearly elastic, with a Young’s modulus of 12.0 MPa and a Poisson’s ratio of 0.42 15,16. The coefficient of friction was set at 0.01 17.
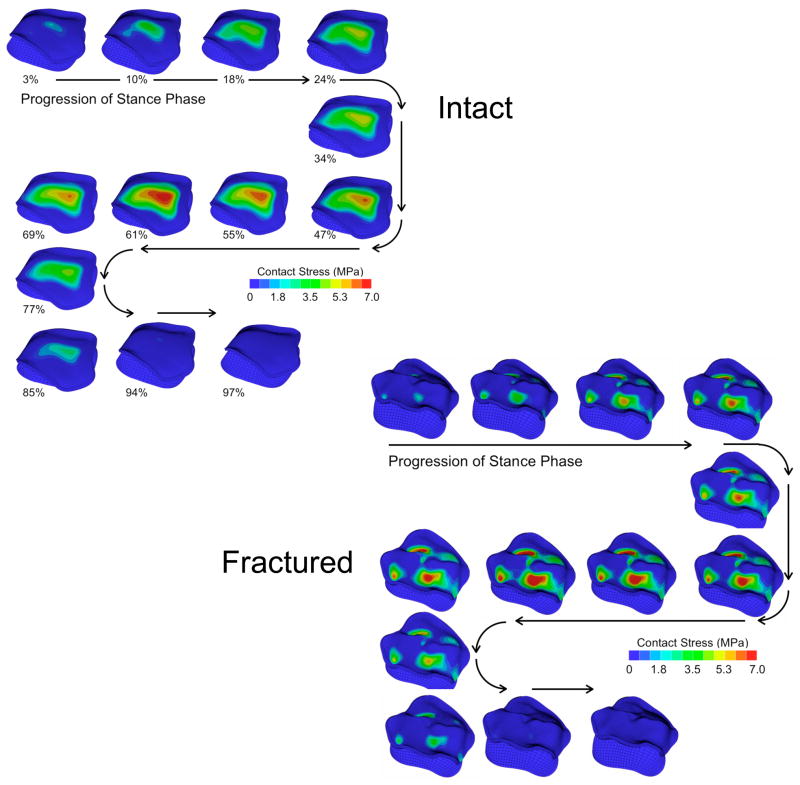
The FE analysis included several provisional loading steps (to bring the joint into a seated apposition as governed by the articulating surfaces), followed by 13 steps spanning the stance phase of gait. All rotational movements and compressive loadings were applied to reference nodes (one for each bone) defined on the (assumed-rigid) tibial and talar subchondral surfaces. Reference node locations were selected to be coincident along a provisional ankle plantar/dorsiflexion axis, at the midpoint of the talar condyles, when the ankle was first loaded. The tibia was incrementally rotated through a sequence of angles ranging from 5° plantar to 9° dorsiflexion, while loaded with a concentrated follower load, of a magnitude scaled from the patient’s body weight 18 (Figure 2). An arthritic loading history was used because arthritic ankle patients tend to exhibit decreased loading. This meant that the maximum applied load was scaled to 320% body weight, rather than the normal 470% body weight. The talus was allowed to reorient relative to the tibia as it was loaded, constrained by articular geometry and a light medial/lateral spring (linear stiffness = 100N/mm) included as a surrogate for fibular support.
Figure 2.
Antero-superior (subchondral) view of the contact stress distributions of the 13 instants of the stance phase of gait for the intact and fractured ankles of patient #4.
This FE model formulation had been previously validated by comparing computed contact stresses to those measured in two cadaveric ankles using a thin-film pressure sensor 19. The experimental data from that physical validation enabled systematic selection of key model parameters, such as degree of surface smoothing and mesh refinement, in the present study.
Post-processing
The contact areas were calculated for the instant of peak loading, which occurred at about 60% of the stance phase. The area data at that loading instant were then binned according to their prevailing contact stress magnitudes. The contact area bin totals were plotted against the contact stress magnitudes, in the format of area engagement histograms.
The contact stress data from the 13 incremental solutions were used for the calculation of cumulative chronic contact stress exposure and over-exposure. The exposure value is a measure of the joint’s contact stress history over a specified time period, while the over-exposure is a measure of presumably deleterious mechanical insult to the joint. These metrics were defined similarly to those used in an earlier study of patients with congenital hip dislocation, which had found a positive correlation between elevated cumulative contact stress over-exposure and long-term patient outcome (incidence and progression of OA) 20. Cumulative chronic contact stress exposures were calculated over the tibial articulating surface on a step-by-step basis using the following equation:
| [1] |
where P̂cumulative is the per-gait-cycle cumulative contact stress exposure distribution, expressed in MPa-seconds; P̂i are the FE-computed nodal contact stress values at a given increment in the gait cycle, i varying across the 13 load increments; Pd is a contact stress damage threshold (remaining to be established); and Δti is the resident time, in seconds, associated with a given increment in the gait cycle (assuming a cadence of 58 steps/minute 18). When Pd is taken to be zero, P̂cumulative provides a raw exposure value. For the purposes of computing a cumulative chronic contact stress over-exposure, the contact stress damage threshold, Pd, was set to 6 MPa. This was based upon an assumption that in the intact ankles modeled, one would not expect OA to develop, and one would therefore expect a nominal over-exposure value below the tolerance of the joint (here assumed to be nearly zero, but another value remaining to be established).
Statistical Analyses
Statistical analyses were performed to compare results between the intact and fractured cases. Since the differences between intact and fractured results were not normally distributed, the Wilcoxon’s signed-ranks test was used instead of the traditional Student’s paired t-test. The chi-squared (χ2) test of homogeneity for comparison of two histograms was applied to compare the average area engagement histograms 21. Significance was set at p<0.05.
RESULTS
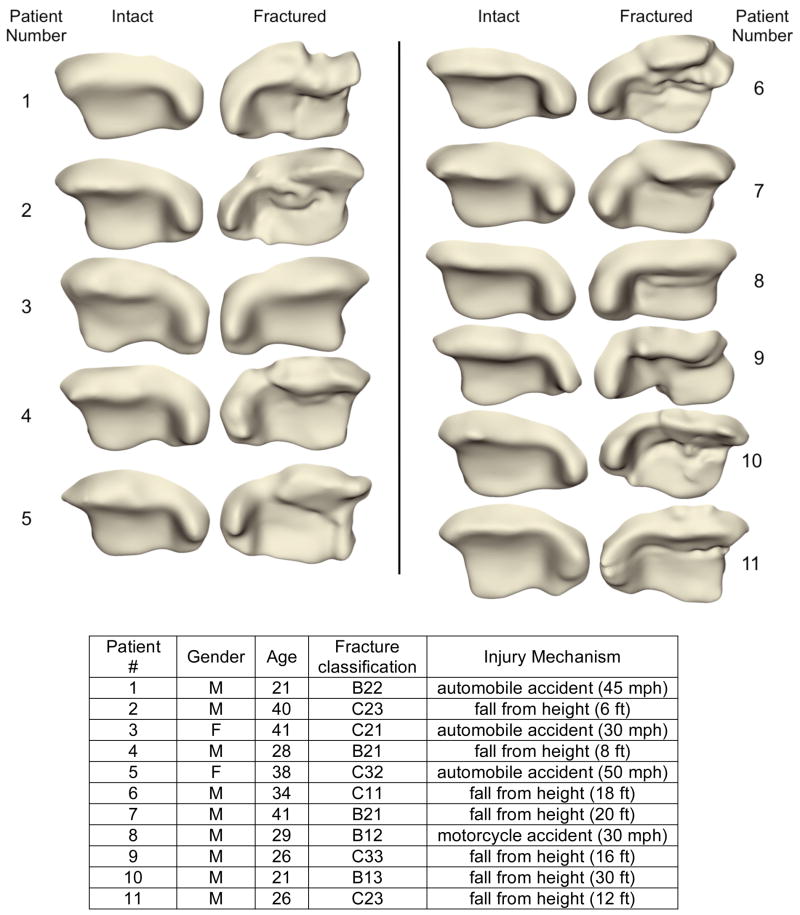
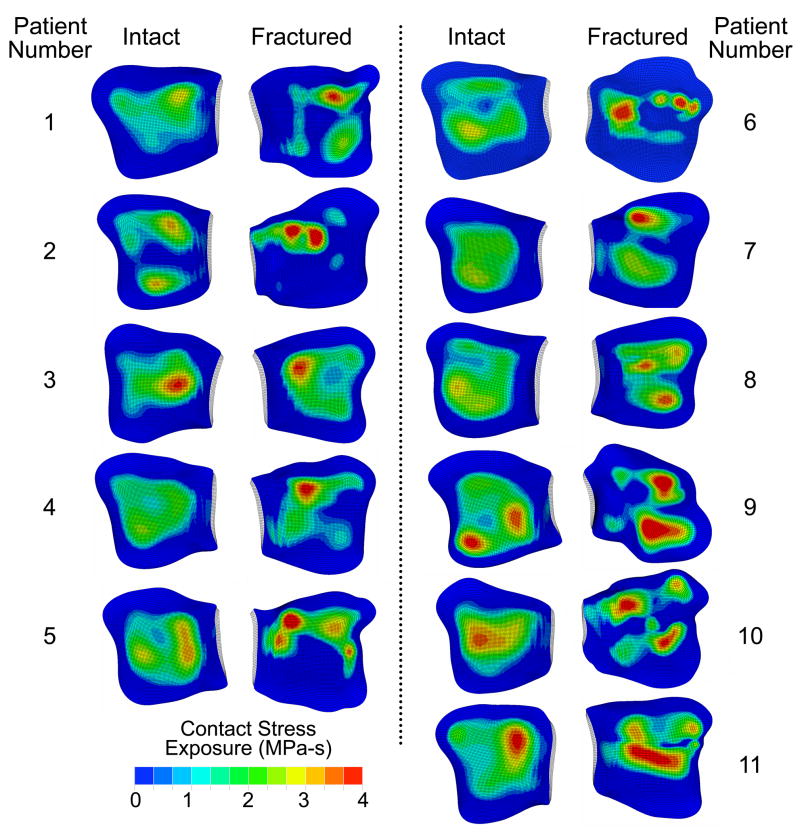
The tibial articulating surfaces for the intact and (reduced) fractured ankles are shown in Figure 3 (ankles mirrored, as necessary, to simplify visualization). The surfaces of the surgically reduced ankles show distinct fracture lines and fragment displacement characteristic of intra-articular fractures. The computed contact stress exposure distributions of the corresponding 11 matching ankle pairs are shown in Figure 4. In general, the intact ankles had lower peak exposure values and more uniform, centrally positioned exposure patches, than the (reduced) fractured ankles.
Figure 3.
Antero-inferior view of the patient-specific tibial articulating surfaces for intact and (reduced) fractured ankles of all 11 patients. Patient and fracture characteristics were as shown.
Figure 4.
Inferior view of the contact stress exposure distribution on the tibial articulating surfaces for the intact and (reduced) fractured ankles of all 11 patients.
FE-based scalar metrics included peak contact stress, contact area, and contact stress overexposure. The peak contact stress and contact area values were reported for the instant in the gait cycle with maximal joint loading, roughly 61% through the stance phase, in a 7.5° dorsiflexed position. Series-wide, computed peak contact stress values of intact and fractured cases were 10.1 +/− 1.8 (mean +/− S.D.) and 13.8 +/− 1.8 MPa, respectively (statistically significant, p = 0.0015). However, the ranges of peak values overlapped substantially: 7.4 to 12.9 MPa for intact cases and 11.0 to 16.5 MPa for fractured cases. The greatest difference in peak contact stress between matched intact and fractured ankles was 82%. The smallest difference was 6%.
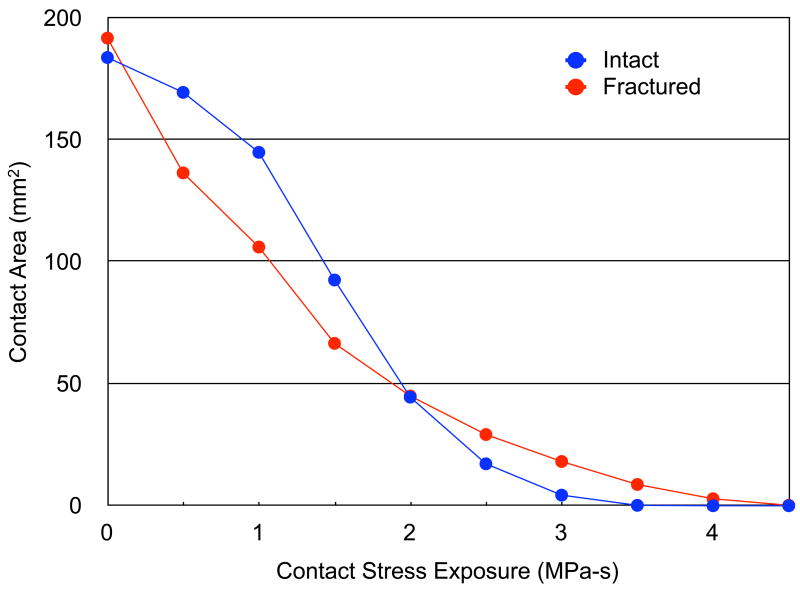
The average contact areas for intact and fractured cases were 705.5 +/− 102.9 and 636.4 +/− 122.4 mm2, respectively (marginally significant, p = 0.051). The series-wide average, area engagement histograms for the 11 intact versus fractured cases are shown in Figure 5. In general, the intact cases had a greater amount of area with low exposure values and a smaller amount of area with high exposure values, compared to the fractured cases. The two area engagement histograms had significantly different distributions (χ2 test statistic = 26.1, with p = 0.011).
Figure 5.
Series-wide average, area engagement histograms for the intact and fractured ankles.
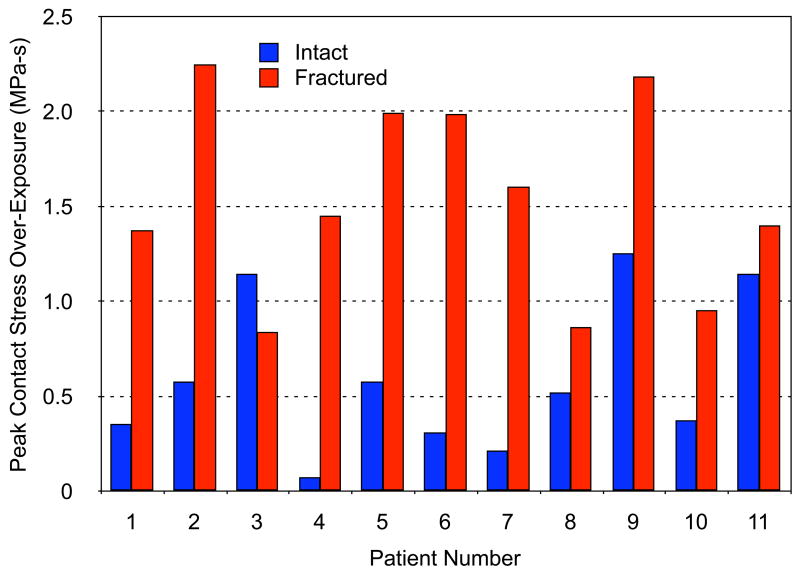
The series-wide average, peak per-gait-cycle over-exposure values for intact and fractured ankle cases were 0.6 +/− 0.4 MPa-s and 1.5 +/− 0.5 MPa-s, respectively (Figure 6). For some patients, the difference in stress over-exposure between intact and fractured ankles was relatively minor, while for others, the difference was dramatic (from 1.5-fold to 18-fold).
Figure 6.
Plot of peak contact stress over-exposure (damage threshold Pd = 6 MPa – see Eqn. [1]) for the intact and (reduced) fractured ankles of 11 patients.
DISCUSSION
Clinical experience has shown that residual articular incongruity is poorly tolerated, and is implicated in the progression of joint degeneration. A better understanding of the mechano-pathology of PTOA is required in order to guide treatment decisions that may forestall or prevent disease progression. The present patient-specific FE models represent a substantial advance in assessing elevated contact stresses due to residual articular incongruity, a factor influencing the clinical outcome of patients treated for intra-articular tibial plafond fractures. To the authors’ knowledge, this is the first FE comparison of contact stress of fractured versus intact joints in a clinical series. Moreover, the formulation addresses not just a single isolated loading instant, but rather loadings throughout the stance phase.
In addition to prior direct validation, the FE results from this study are consistent with experimentally reported values found in the literature. Despite different test set-ups and different applied loads, the contact area values reported by various groups for the normal ankle joint have been surprisingly consistent, with average values of 558 +/− 122 mm2 22–25. The average intact contact area from this study (in neutral apposition) is 578 +/− 83 mm2.
The peak contact stress value and range for the intact cases in neutral agree reasonably well with values measured by Vrahas et al., who reported a series-average peak stress value of 6.7 MPa (range of 2 to 12 MPa) in cadaveric ankles statically loaded to 1360 N 22. The computationally predicted series-average peak contact stress value in the present study for neutral apposition, at a mean of 1492 N load, was 6.8 MPa (range of 5 to 9 MPa). A cadaveric study of the effect of increasing degrees of residual incongruity in the form of step-offs in the knee joint was evaluated by Brown et al. 6. They found that the cartilage contact stresses generally increased with greater step-off size, and that at 3-mm step-off level, contact stresses increased approximately 75%.
Elevated contact stresses have been implicated in the high rate of unsatisfactory outcome in intra-articular fracture series 1,8. Elevated contact stresses attributed to residual incongruity have been well documented through in-vitro studies, but the degree of elevation has been postulated to be within the range tolerated by articular cartilage 6. Simply assessing the magnitude of contact stress elevation, without accounting for the effects of exposure time, did not correlate well with long-term outcome in a study of congenital hip dislocation 20. However, contact stress overexposure correlated with outcome with 82% reliability. This suggests that the cumulative effect of loading – over time – may have a greater influence on long-term joint health than does loading magnitude at any one instant.
The area engagement histograms showed that the fractured ankles had a larger area with higher contact stress compared to intact ankles. A larger contact area experiencing higher than normal loading over time may initiate cartilage degeneration, as the maintenance of cartilage structure is dependent on appropriate mechanical loading 26–28. In this context, the question arises: At what level are stresses pathological? While first-estimate data exist for the hip 20, this may well be joint-specific. The presently-utilized value of 6 MPa for the ankle needs to be viewed as only provisional, based on an assumption that normal ankles operate near the margin of tolerance.
The use of FE modeling necessarily involves simplifying assumptions. Although articular cartilage is structurally biphasic and exhibits viscoelastic behavior under certain conditions, experimental testing has demonstrated that its stress-strain response under physiological loading rates is nearly linear 29. Recent theoretical work has further established the equivalence of short-time biphasic and incompressible elastic responses for arbitrary deformations and constitutive relations, from first principles 30. Thus, a linear elastic cartilage model seems reasonable for simulating level walking. Smoothing of the segmented subchondral bone surfaces was necessary for FE modeling, and articular cartilage thickness variations not included in the models would affect stress loading patterns. A recent study with high accuracy (+/− 2 μm) found that ankle cartilage thickness is relatively homogeneous throughout the weight-bearing areas of the joint 24. Given substantial earlier agreement between the intact FE model formulation and the validation cases, these simplifications therefore seem reasonable, especially for the intact joints.
For the fractured ankles that were modeled, a constant uniform cartilage thickness of 1.7 mm was also used, extruded from subchondral bone surfaces segmented from CT scans (as cartilage would not be well visualized). As the ankles of these patients were being imaged immediately following surgical fracture reduction, the use of CT arthrography or MRI to provide a mapping of cartilage thickness was deemed unethical, as well as unlikely to yield accurate measures. Another limitation is that the scans were obtained prior to definitive weight-bearing of the joint, and there could potentially be some shifting of the reconstructed fragments in the most unstable fracture configurations, as well as further bone remodeling as the fractures heal.
Mechanical studies of subchondral bone compressive modulus show that it is almost two orders of magnitude stiffer than articular cartilage 15,31. In that context, treating subchondral bone as rigid therefore seems an acceptable approximation. The ligaments and fibula were not explicitly included in the model because of their relatively minor contributions to stability and load bearing function of normal ankles. A medial/lateral linear spring was however attached to the talus to provide a modest degree of fibular support. The dominant role that articular geometry plays in ankle stabilization within normal ranges of motion has been experimentally documented in cadaveric testing 32. Other experimental studies show that the fibula transmits less than 20% of the ankle load 33.
There is general agreement among orthopaedic surgeons and researchers that it is important to ascertain the factors that influence joint injury outcome 8. To the authors’ knowledge, the present ankle contact FE analysis is the first: (1) to incorporate case-specific ankle geometry from a series of patients treated for intra-articular ankle fractures, (2) to simulate the entire stance phase of gait, and (3) to utilize summary metrics (cumulative exposure) intuitively relevant to PTOA onset. As such, it constitutes a step forward toward assessing chronic cumulative contact stress over-exposure dosages on a patient-specific basis, and toward establishing joint-specific tolerance levels for PTOA. As longer-term follow-up of the present series of patients becomes available, it will provide precisely the type of outcome/validation data required for these purposes.
Supplementary Material
Acknowledgments
Financial support was provided by grants from the National Institutes of Health (AR46601, AR48939, and AR55533). Ms. Valerie Muehling and Mr. Andrew Pick helped collect clinical case data, and Dr. Yuki Tochigi assisted with the manual posing of the ankle models. Dr. Fulvia Taddei and Dr. Marco Viceconti (Istituti Ortopedici Rizzoli) kindly provided assistance with the Data Manager software.
References
- 1.Buckwalter JA, Brown TD. Joint injury, repair, and remodeling: roles in post-traumatic osteoarthritis. Clin Orthop Relat Res. 2004;423:7–16. [PubMed] [Google Scholar]
- 2.Brown TD, Johnston RC, Saltzman CL, et al. Posttraumatic osteoarthritis: a first estimate of incidence, prevalence, and burden of disease. J Orthop Trauma. 2006;20:739–744. doi: 10.1097/01.bot.0000246468.80635.ef. [DOI] [PubMed] [Google Scholar]
- 3.Huber-Betzer H, Brown TD, Mattheck C. Some effects of global joint morphology on local stress aberrations near imprecisely reduced intra-articular fractures. J Biomech. 1990;23:811–822. doi: 10.1016/0021-9290(90)90028-2. [DOI] [PubMed] [Google Scholar]
- 4.Newberry WN, Garcia JJ, Mackenzie CD, et al. Analysis of acute mechanical insult in an animal model of post-traumatic osteoarthrosis. J Biomech Eng. 1998;120:704–709. doi: 10.1115/1.2834882. [DOI] [PubMed] [Google Scholar]
- 5.Beardsley CL, Anderson DD, Marsh JL, Brown TD. Interfragmentary surface area as an index of comminution severity in cortical bone impact. J Orthop Res. 2005;23:686–690. doi: 10.1016/j.orthres.2004.09.008. [DOI] [PMC free article] [PubMed] [Google Scholar]
- 6.Brown TD, Anderson DD, Nepola JV, et al. Contact stress aberrations following imprecise reduction of simple tibial plateau fractures. J Orthop Res. 1988;6:851–862. doi: 10.1002/jor.1100060609. [DOI] [PubMed] [Google Scholar]
- 7.McKinley TO, Rudert MJ, Koos DC, Brown TD. Incongruity versus instability in the etiology of posttraumatic arthritis. Clin Orthop Relat Res. 2004;423:44–51. doi: 10.1097/01.blo.0000131639.89143.26. [DOI] [PubMed] [Google Scholar]
- 8.Marsh JL, Buckwalter J, Gelberman R, et al. Articular fractures: does an anatomic reduction really change the result? J Bone Joint Surg Am. 2002;84-A:1259–1271. [PubMed] [Google Scholar]
- 9.Müller ME, Nazarian S, Koch P, Schatzker J. The Comprehensive Classification of Fractures of Long Bones. Berlin: Springer-Verlag; 1990. pp. 176–179. [Google Scholar]
- 10.Marsh JL. External fixation is the treatment of choice for fractures of the tibial plafond. J Orthop Trauma. 1999;13:583–585. doi: 10.1097/00005131-199911000-00012. [DOI] [PubMed] [Google Scholar]
- 11.Rosset A, Spadola L, Ratib O. OsiriX: an open-source software for navigating in multidimensional DICOM images. J Digit Imaging. 2004;17:205–216. doi: 10.1007/s10278-004-1014-6. [DOI] [PMC free article] [PubMed] [Google Scholar]
- 12.El-Khoury GY, Alliman KJ, Lundberg HJ, et al. Cartilage thickness in cadaveric ankles: measurement with double-contrast multi-detector row CT arthrography versus MR imaging. Radiology. 2004;233:768–773. doi: 10.1148/radiol.2333031921. [DOI] [PubMed] [Google Scholar]
- 13.Van Sint Jan S, Viceconti M, Clapworthy G. Modern Visualization Tools for Research and Education in Biomechanics. Eighth International Conference on Information Visualization (IV’04): IEEE Computer Society.2004. [Google Scholar]
- 14.Anderson DD, Goldsworthy JK, Shivanna K, et al. Intra-articular contact stress distributions at the ankle throughout stance phase - patient-specific finite element analysis as a metric of degeneration propensity. Biomech Model Mechanobiol. 2006;5:82–89. doi: 10.1007/s10237-006-0025-2. [DOI] [PMC free article] [PubMed] [Google Scholar]
- 15.Barker MK, Seedhom BB. The relationship of the compressive modulus of articular cartilage with its deformation response to cyclic loading: does cartilage optimize its modulus so as to minimize the strains arising in it due to the prevalent loading regime? Rheumatology. 2001;40:274–284. doi: 10.1093/rheumatology/40.3.274. [DOI] [PubMed] [Google Scholar]
- 16.Jin H, Lewis JL. Determination of Poisson’s ratio of articular cartilage by indentation using different-sized indenters. J Biomech Eng. 2004;126:138–145. doi: 10.1115/1.1688772. [DOI] [PubMed] [Google Scholar]
- 17.Linn FC. Lubrication of animal joints. I. The arthrotripsometer. J Bone Joint Surg Am. 1967;49-A:1079–1098. [PubMed] [Google Scholar]
- 18.Stauffer RN, Chao EY, Brewster RC. Force and motion analysis of the normal, diseased, and prosthetic ankle joint. Clin Orthop Relat Res. 1977;127:189–196. [PubMed] [Google Scholar]
- 19.Anderson DD, Goldsworthy JK, Li W, et al. Physical validation of a patient-specific contact finite element model of the ankle. J Biomech. 2007;40:1662–1669. doi: 10.1016/j.jbiomech.2007.01.024. [DOI] [PMC free article] [PubMed] [Google Scholar]
- 20.Hadley NA, Brown TD, Weinstein SL. The effects of contact pressure elevations and aseptic necrosis on the long-term outcome of congenital hip dislocation. J Orthop Res. 1990;8:504–513. doi: 10.1002/jor.1100080406. [DOI] [PubMed] [Google Scholar]
- 21.Gagunashvili ND. Comparison of weighted and unweighted histograms. 2006 Eprint arXiv:physics/0605123. [Google Scholar]
- 22.Vrahas M, Fu F, Veenis B. Intraarticular contact stresses with simulated ankle malunions. J Orthop Trauma. 1994;8:159–166. doi: 10.1097/00005131-199404000-00014. [DOI] [PubMed] [Google Scholar]
- 23.Macko VW, Matthews LS, Zwirkoski P, Goldstein SA. The joint-contact area of the ankle. The contribution of the posterior malleolus. J Bone Joint Surg Am. 1991;73-A:347–351. [PubMed] [Google Scholar]
- 24.Millington SA, Grabner M, Wozelka R, et al. Quantification of ankle articular cartilage topography and thickness using a high resolution stereophotography system. Osteoarthritis Cartilage. 2007;15:205–211. doi: 10.1016/j.joca.2006.07.008. [DOI] [PubMed] [Google Scholar]
- 25.Wan L, de Asla RJ, Rubash HE, Li G. Determination of in-vivo articular cartilage contact areas of human talocrural joint under weightbearing conditions. Osteoarthritis Cartilage. 2006;14:1294–1301. doi: 10.1016/j.joca.2006.05.012. [DOI] [PubMed] [Google Scholar]
- 26.Seedhom BB. Conditioning of cartilage during normal activities is an important factor in the development of osteoarthritis. Rheumatology. 2006;45:146–149. doi: 10.1093/rheumatology/kei197. [DOI] [PubMed] [Google Scholar]
- 27.Carter DR, Beaupre GS, Wong M, et al. The mechanobiology of articular cartilage development and degeneration. Clin Orthop Relat Res. 2004;427(Suppl):S69–77. doi: 10.1097/01.blo.0000144970.05107.7e. [DOI] [PubMed] [Google Scholar]
- 28.Lee DA, Bader DL. Compressive strains at physiological frequencies influence the metabolism of chondrocytes seeded in agarose. J Orthop Res. 1997;15:181–188. doi: 10.1002/jor.1100150205. [DOI] [PubMed] [Google Scholar]
- 29.Park S, Hung CT, Ateshian GA. Mechanical response of bovine articular cartilage under dynamic unconfined compression loading at physiological stress levels. Osteoarthritis Cartilage. 2004;12:65–73. doi: 10.1016/j.joca.2003.08.005. [DOI] [PubMed] [Google Scholar]
- 30.Ateshian GA, Ellis BJ, Weiss JA. Equivalence between short-time biphasic and incompressible elastic material responses. J Biomech Eng. 2007;129:405–412. doi: 10.1115/1.2720918. [DOI] [PMC free article] [PubMed] [Google Scholar]
- 31.Li B, Aspden RM. Mechanical and material properties of the subchondral bone plate from the femoral head of patients with osteoarthritis or osteoporosis. Ann Rheum Dis. 1997;56:247–254. doi: 10.1136/ard.56.4.247. [DOI] [PMC free article] [PubMed] [Google Scholar]
- 32.Tochigi Y, Rudert MJ, Saltzman CL, et al. Contribution of articular surface geometry to ankle stabilization. J Bone Joint Surg Am. 2006;88-A:2704–2713. doi: 10.2106/JBJS.E.00758. [DOI] [PubMed] [Google Scholar]
- 33.Wang Q, Whittle M, Cunningham J, Kenwright J. Fibula and its ligaments in load transmission and ankle joint stability. Clin Orthop Relat Res. 1996;330:261–270. doi: 10.1097/00003086-199609000-00034. [DOI] [PubMed] [Google Scholar]
- 34.Li W. Thesis (M.S.) -- University of Iowa. Special Collections University of Iowa Archives T2007.L726; 2007. A patient-specific finite element investigation of the influence of incongruities on chronic contact stress exposure in the ankle; p. 119. [Google Scholar]
Associated Data
This section collects any data citations, data availability statements, or supplementary materials included in this article.


