Abstract
Electron-vibration-vibration two-dimensional coherent spectroscopy, a variant of 2DIR, is shown to be a useful tool to differentiate a set of 10 proteins based on their amino acid content. Two-dimensional vibrational signatures of amino acid side chains are identified and the corresponding signal strengths used to quantify their levels by using a methyl vibrational feature as an internal reference. With the current apparatus, effective differentiation can be achieved in four to five minutes per protein, and our results suggest that this can be reduced to <1 min per protein by using the same technology. Finally, we show that absolute quantification of protein levels is relatively straightforward to achieve and discuss the potential of an all-optical high-throughput proteomic platform based on two-dimensional infrared spectroscopic measurements.
Keywords: 2DIR, amino acid, bioinformatics, vibrational
The potential of proteomic tools ranges from biomarker discovery and clinical diagnostics to the provision of data for systems biology and fundamental biological research (1–6). This broad range of applications is one of the drivers for the development of protein analysis tools with greater capability. Optical spectroscopies appear to have significant potential for protein analysis (7–9), but conventional approaches suffer from overcongested spectra, which makes feature assignment and quantification highly problematic. Multidimensional coherent infrared spectroscopic techniques, commonly referred to as two-dimensional infrared (2DIR) spectroscopies, might be expected to be able to relieve the congestion of infrared spectra sufficiently to allow such assignment and quantification to take place. Indeed, we recently demonstrated how picosecond electron-vibration-vibration (EVV) four-wave mixing experiments can decongest 2DIR spectra to an even greater extent (10, 11), and showed how such an EVV approach can be applied to the analysis of peptides (12). In this article we take the approach further to show that it can be used to differentiate and identify proteins and to measure absolute protein quantities. We also demonstrate that the sensitivity and throughput of our EVV 2DIR apparatus is sufficient for this method to be considered for use as a real proteomic tool.
Although our previous work showed that it is possible to quantify relative amino acid levels for short peptides (12), there is always the possibility that primary, secondary, or tertiary structural effects would prevent such measurements on proteins. In this article we demonstrate that these structural sensitivities are not limiting factors either for differentiation/identification or for absolute quantification of protein levels.
The key proposition of this article is that protein identification can be performed by using spectroscopically determined amino acid content, relative to an internal reference. Amino acid composition analysis is an approach that has been used to determine protein relatedness (13) and protein structural classes (14, 15). Although it is known that compositional ratios of amino acids can also be used to identify proteins [for instance, by using the AACompIdent (http://www.expasy.org/tools/aacomp/) or MultiIdent (http://www.expasy.org/tools/multiident/) tools], this method of protein identification is not widely used. The experimental methods historically used for composition determination require hydrolysis of the protein substrate, followed by separation and derivatization of its amino acids before quantification can occur (16–18). In contrast, the identification strategy outlined here requires no chemical or biochemical preparation steps and achieves quantification by measuring spectroscopic features of the proteins.
In this particular study we use methyl groups (CH3) as an internal reference, and the fingerprint of a protein in this case is the distribution of its relative amino acid quantities. We have identified spectral features corresponding to the CH3 reference and to three different amino acids: tyrosine (Tyr), phenylalanine (Phe), and tryptophan (Trp). We use the peak ratios of these three amino acids to the CH3 internal reference, with the Phe measured with two different polarizations. This gives a total of four amino acid cross-peaks to be monitored, as well as the CH3 cross-peak that is measured for both polarization schemes.
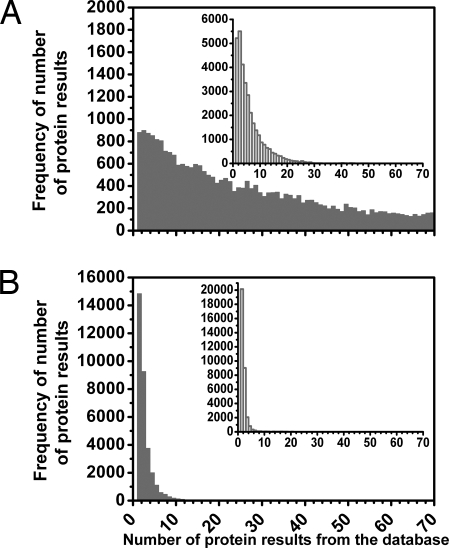
Identification is achieved by comparing these spectroscopically determined amino acid ratios of a protein to the contents of a database. To this end we have constructed searchable protein databases for a number of model organisms; these are composed of the amino acid/CH3 ratios for each of their proteins. Fig. 1 shows the distribution of hits that are returned when the CH3 ratios of the three spectrally identified residues are input with 10% precision for each protein in our human database [taken from ENSEMBL release 44 (19)]. To demonstrate how this identification strategy scales, we also show the results for when another two amino acids, in this case histidine (His) and cysteine (Cys), are included, along with the three residues used experimentally in this article. The relative amounts of His and Cys residues, as well as of Trp, Tyr, and Phe, can vary significantly from one protein to another, and they are therefore good candidates for our protein identification strategy. Preliminary EVV 2DIR measurements on peptides, and calculations of the EVV 2DIR spectra of these species, show that histidine and cysteine, with resolvable features at 1475/2650 cm−1 and 1485/2,560 cm−1, respectively (data not shown), are useful residues to include in our identification strategy.
Fig. 1.
Histograms demonstrating the feasibility of identifying proteins by using their amino acid/CH3 ratios. Tests were performed over our human proteome database; amino acid/CH3 ratios and their precisions were used as search parameters for each protein in the database. The horizontal axes correspond to the number of protein outputs from the database when a search was performed for a protein. The vertical axes represent the frequency with which a particular number of hits were output when the search was performed for each protein of the database (≈33,000) in turn. (A) Shown is the number of hits output from the database when the three amino acid/CH3 ratios studied experimentally for this article (Tyr/CH3, Trp/CH3, and Phe/CH3) were input with 10% precision for each protein. (B) Shown is the number of protein hits returned when the database search was extended to using five amino acid ratios (by also using the His/CH3 and Cys/CH3 ratios). (Inset) Histograms show the results for when the molecular weight (with 10% precision) was also included as a search parameter. The first bar of B shows that ≈15,000 proteins of the ≈33,000 present in the database (≈44%) gave only one hit and thus were uniquely identifiable. The second bar shows that ≈9,000 proteins gave two protein hits and so could be one of only two possible database candidates. When the molecular weight was also used as a parameter, ≈20,000 (≈60%) of the proteins were unambiguously identified.
A preliminary bioinformatics analysis shows that identifying the relative levels of only five amino acids would allow ≈44% of the proteins in the ENSEMBL human protein database to be uniquely identified and ≈72% to be one of only two proteins.
Results
EVV 2DIR spectroscopy [also known as Doubly-Vibrationally Enhanced Four-Wave Mixing spectroscopy (20–25)] requires the overlap of two picosecond infrared (IR) beams and a picosecond visible beam on the sample. A nonlinear visible signal generated by the induced polarizations is detected. The signal intensity is measured as a function of both IR frequencies, and the spectra are presented as two-dimensional intensity maps. Cross-peaks appear only at the IR frequencies corresponding to vibrational states that are coupled. The delays between the pulses, as well as the orientation of the visible electric field, can be varied, and we show below how alteration of these parameters helps to further decongest the spectra. The polarization states are denoted by using the usual S and P notation; this describes the orientation of the electric fields relative to the plane of propagation. T12 and T23 are the delays between the first IR pulse (frequency ωα) and the second IR pulse (frequency ωβ), and the second IR pulse and the visible pulse, respectively. Because this particular version of 2DIR is a homodyne spectroscopy, the total signal is proportional to the square of the number of molecules in the beam.
Spectral Signatures of Amino Acids and Use of Multiple Polarizations.
The first step of our protein differentiation/identification procedure is to identify spectral features that are amino acid specific. Spectral congestion has to be minimized to ensure that each cross-peak corresponds to a unique residue. To be exploitable, the features must also be free of interferences that could affect the amplitudes of the cross-peaks. The delays allow selection of the coherence pathways corresponding to the EVV 2DIR process, minimizing other nonlinear processes and also reducing the electronic nonresonant background (10, 11). The polarizations select which components of the susceptibility tensor will be probed (26) and therefore can be used to extinguish certain vibrational modes, thus further decreasing the spectral congestion.
All of the spectra presented here were measured at T12 = 2 ps and T23 = 1 ps and for two different sets of polarizations (PPP when all beams are polarized in the plane of propagation and PPS when the electric field of the visible is perpendicular to the plane of propagation). The EVV 2DIR spectra of peptides obtained in our previous studies were an aid in the identification of the features measured in the protein spectra (12), which were found to be very similar.
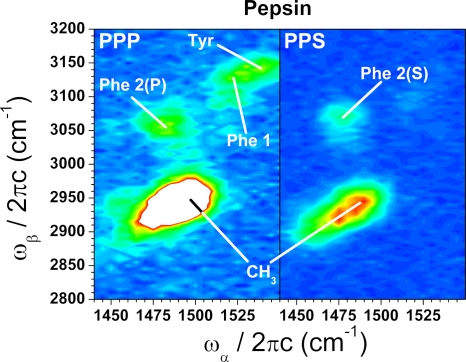
Fig. 2 shows typical examples of protein EVV 2DIR spectra. Vibrational features of the amino acid side chains are present in the spectral regions of 1485/3070 and 1525/3120 for phenylalanine, and of 1545/3150 for tyrosine. Their assignments are presented more fully elsewhere (12).
Fig. 2.
EVV 2DIR spectra of pepsin measured with two different polarization combinations: PPP (all beams having their fields in the plane of propagation) and PPS (IR beams polarized in the plane of propagation and the visible normal to the IRs). The spectra were measured for the same set of pulse delays: T12 = 2 ps, T23 = 1 ps, and are plotted on the same intensity scale. The cross-peaks used in this study were mainly identified from previous studies of peptides (12).
In brief, the higher-frequency cross-peaks (labeled “Tyr” and “Phe 1” for tyrosine and phenylalanine, respectively) arise from the coupling of an aromatic stretching mode with a combination band involving aromatic stretching modes and a CH2 deformation. We estimate the full width at half-maximum (FWHM) of these cross-peaks to be 10–15 cm−1. Although these Tyr and Phe 1 features are 20–30 cm−1 apart and appear not fully resolved, the cross-contamination is sufficiently small to reliably quantify the amount of each residue through the cross-peak intensity on resonance.
The lower-frequency phenylalanine cross-peak (labeled “Phe 2(P)” and “Phe 2(S)” for the PPP and PPS schemes, respectively) arises from the coupling of a mode involving aromatic stretching and CH2 deformation with a combination band that also involves aromatic stretching modes and a CH2 deformation.
Changing the polarization of the visible beam from PPP to PPS helps to reduce the remaining congestion around the Phe 2 cross-peak, but renders the Phe 1 and Tyr aromatic modes very weak. Nevertheless, both polarization schemes produce data that can be used to assist in the differentiation of the proteins. Independent measurements of the phenylalanine levels at both polarizations contribute to the overall dataset used here.
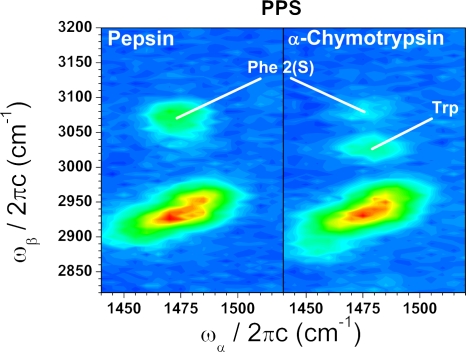
Decongesting the spectral region around the Phe 2 feature also reveals a clearly resolved tryptophan peak at 1490/3020 (labeled “Trp” in Fig. 3). This decongestion effect can be seen in Fig. 3 where the spectra of pepsin and a tryptophan-rich protein, α-chymotrypsin, are compared. We have also observed this tryptophan peak in tryptophan-containing peptides.
Fig. 3.
EVV 2DIR spectra of pepsin and α-chymotrypsin measured with the PPS polarization configuration and delays of T12 = 2 ps, T23 = 1 ps (different intensity scales). The appearance of the tryptophan peak at ≈3,020/1,480 (labeled “Trp”) can be seen on the α-chymotrypsin spectrum.
To summarize, the intensity of four amino acid features corresponding to three amino acid residues are monitored to perform the relative quantification procedure: the phenylalanine “Phe 1” and tyrosine “Tyr” cross-peaks in the PPP polarization scheme, and the phenylalanine “Phe 2(S)” and tryptophan “Trp” cross-peaks in the PPS polarization scheme. The “Phe 2(P)” feature is considered congested and therefore not exploited. The internal reference “CH3” is measured for both polarization schemes.
CH2 and CH3 Internal Standard.
The structured peak at ≈1475/2920 contains CH2 and CH3 contributions. These arise from a combination of fundamental modes, overtones of the CH stretch, and Fermi resonance between the CH stretch and the first overtone of the CH deformation.
In summary, peaks from four different CH modes are known to be present: CH2 symmetrical (s) stretch at 2,850 cm−1, CH3 symmetrical stretch at 2,885 cm−1, CH2 asymmetrical (as) stretches at 2,920 cm−1 and 2,930 cm−1, and CH3 asymmetrical stretches at 2,960 cm−1 and 2,984 cm−1 (27).
We found that the feature at 1,480/2,960 works well as an internal standard. A complementary experiment (data not shown) showed that the peak at 1,460/2,920 can also be used as a reference; a priori any or all of these features would probably be suitable for this particular role.
Amino Acid Quantification.
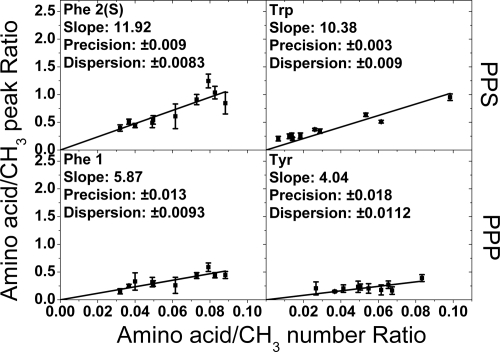
The square roots of the intensities of the Tyr, Phe 1, Trp, and Phe 2(S) cross-peaks relative to the square root of the intensity of the CH3 reference peak were calculated and plotted as a function of the actual amino acid to CH3 ratios for each protein (Fig. 4). A more detailed procedure can be found in Methods and supporting information (SI) Text. The reproducibility of the measurements was estimated by repeating this procedure four times at different positions on each sample.
Fig. 4.
Measured ratios of amino acid peak intensity to internal reference intensity plotted against the known ratios for the four identified amino acid peaks used experimentally in this study. Each data point comes from one of the 10 protein species analyzed. The solid lines are the linear fits constrained through the origin, and the error bars are standard deviations from four repeat measurements. The calculated average precisions on the amino acid/CH3 ratios were deduced from the average experimental error bars and are denoted “Precision” on the graphs. The horizontal dispersions of the data points compared with the linear fits are the average absolute differences and are denoted “Dispersion.” This is essentially the standard deviation due to variation of the individual protein points from the linear fit. For the case of tryptophan, where the dispersion is greater than the precision, the implication is that there is some residual structural effect influencing the cross-peak intensity.
Protein Differentiation.
The purpose of proteomic techniques is the identification of proteins and absolute quantification of their amount in a given sample. For proteins to be identified, they need to be distinguishable from each other. We use a mathematical definition of distinguishability based on a multidimensional overlap integral comprising the overlap integrals for each amino acid peak (see Methods and SI Text). One protein can be distinguished from another protein if any amino acid is clearly present at different levels in the two proteins. Distinguishability in this case would mean that the overlap of the distributions, which peak at the expected amino acid ratio value and have a width of the standard deviation of the measurement, is much less than the difference in the expected amino acid ratios of the proteins being compared. The total overlap integral is the product of the integrals of two proteins for each amino acid. If the overlap integral has a value of 1, then the two proteins are wholly indistinguishable. If the overlap integral has a value of zero, then the proteins are wholly distinguishable.
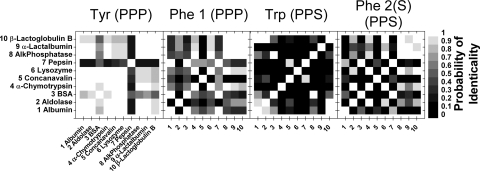
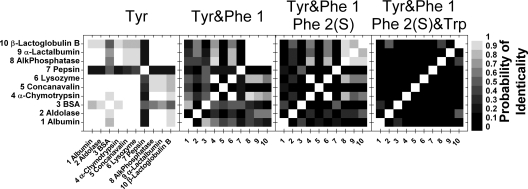
The results of these calculations are presented as two-dimensional maps, in which the intensity corresponds to the value of the normalized integral from 0 (black) to 1 (white) and reflects the probability of two proteins being identical (i.e., their probability of identicality). Figs. 5 and 6 show such maps for single amino acid peaks and combinations of amino acid peaks, respectively.
Fig. 5.
Differentiation maps of the 10 proteins for the single amino acid peaks (with 120 s acquisition time per amino acid cross-peak). White corresponds to 1 (completely indistinguishable) and black to 0 (completely distinguishable). The gray level of each square corresponds to the probability that the two proteins being compared are the same protein (see scale). The diagonal compares a protein with itself and so is white. The relative darkness of each map shows the relative contribution of each single amino acid in distinguishing the proteins.
Fig. 6.
Differentiation maps of the 10 proteins for combinations of the amino acid peaks (with 120 s acquisition time per amino acid cross-peak). White corresponds to 1 (proteins are completely indistinguishable) and black to 0 (proteins are completely distinguishable). The gray level of each square corresponds to the probability that the two proteins being compared are the same protein (see scale).
Fig. 5 shows that the tryptophan peak, “Trp,” alone provides quite a good basis for differentiating between many of these proteins. It does not, however, allow differentiation between all pairs of proteins, for example, alkaline phosphatase (protein 8) from BSA (protein 3) or β-lactoglobulin B (protein 10) from albumin (protein 1) and aldolase (protein 2).
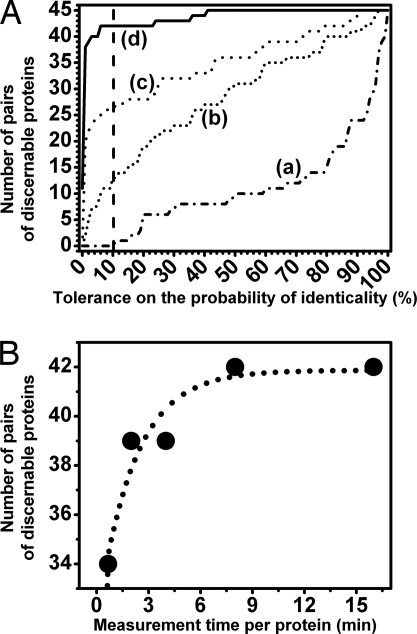
As one would expect, the distinguishability increases when a combination of several amino acid peaks is used (Fig. 6). The cumulated number of pairs of discernible proteins as a function of the probability of identicality can be deduced from each differentiation map (Fig. 7A). For example, if one accepts a maximum of 10% probability of identicality between two proteins, the four cross-peak scheme (labeled (d) in Fig. 7A) gives 42 pairs of discernible proteins out of a total of 45 pairs. Instead, a two cross-peak scheme (phenylalanine and tyrosine PPP peaks, scheme (b) in Fig. 7A), gives only 12 pairs of discernible proteins out of 45 (again accepting a 10% probability of identicality).
Fig. 7.
Protein discernability performances deduced from the differentiation maps (Fig. 6). (A) Shown are the cumulative number of pairs of distinguishable proteins as a function of the tolerance on the probability of identicality for four different fingerprinting schemes (120 s acquisition time per amino acid peak): the single tyrosine PPP measurement scheme (a), the tyrosine and phenylalanine PPP scheme (b), the tyrosine and phenylalanine PPP and tryptophan PPS scheme (c), and the complete set of peaks (d). (B) Shown is the cumulative number of pairs of distinguishable proteins as a function of the data acquisition time per protein. Data are for a differentiation strategy using all four amino acid cross-peaks and a 10% probability of two proteins being identical (the dotted curve is a guide for the eyes).
The cross-peak intensity is measured in such a way that the protein differentiation efficiency for different regimes of acquisition times can also be assessed. The cumulated number of pairs of discernible proteins as a function of the probability of identicality can be determined for different time-averaging regimes (data not shown). We deduced that, for a 2- to 4-min measurement time per protein, the four cross-peak scheme with an acceptance of 10% probability of identicality gives a good result of 39 pairs of discernible proteins out of a total of 45 (Fig. 7B). More signal averaging increases the precision with which each amino acid is quantified; it also increases a priori the number of pairs of discernible proteins for cases of probabilities of identicality <50–60% (data not shown).
Discussion
We have shown that protein differentiation with a maximum of 10% probability of identicality can be achieved for 39 pairs of proteins out of 45 in 2 to 4 min of measurement time per protein (Fig. 7B).
In some cases, it appears there is a limitation on the precision with which the content of particular amino acids can be determined. This can be seen by the spread of the data points around the straight-line fit in Fig. 4 for tryptophan. This spread, or dispersion, is greater than predicted from experimental precision alone, which suggests that there is some small residual structural sensitivity for this particular cross-peak. For cases where this limitation is reached, improved identification capability can only be achieved by finding spectral features for more amino acids, rather than by further signal averaging for that particular protein. However, the use of different polarizations for phenylalanine shows that higher precisions can be achieved by taking more than one peak per amino acid if desired.
Differentiation within a limited set of proteins is easier than absolute identification from an entire protein database of an organism. Given the limitations discussed above, we estimate that it will take between six and nine amino acids to unambiguously identify >90% of the proteins in our database of human proteins (≈33,000 proteins taken from ENSEMBL). We also estimate that, with the current technology, the signal-averaging time per amino acid peak can be shortened to between 1 and 10 s. This gives a realistic protein identification time of somewhere between 10 s and 2 min.
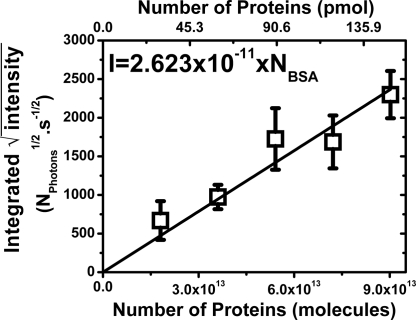
An important property of EVV 2DIR as a proteomic technique is its potential for simple absolute quantification of protein levels. Absolute quantification is increasingly an important issue in many proteomic applications, but one that is relatively difficult to achieve with mass spectrometry. Quantification with EVV 2DIR is, however, relatively easy to achieve. This is because the average oscillator strength for the CH3 cross-peaks (used as the internal standard in this study) appears to be the same for all proteins so far studied. This presumably reflects the fact that the oscillator strength is an average over many CH3 groups in each protein, and that these groups are relatively insensitive to structural effects. The acquisition and treatment procedures for performing absolute quantification are described in Methods. As predicted by the theory, we found that the integrated intensity of the square-rooted signal of a dried drop of protein solution is proportional to the total number of protein molecules it contains (Fig. 8). From these measurements we have established that the practical sensitivity limit with our apparatus is ≈1012 protein molecules (≈1.5 pmol).
Fig. 8.
Square root of the EVV 2DIR signal level as a function of the number of protein molecules in the sample. The signal level of the CH3 peak at 1,485/2,930 was mapped (1-s acquisition time per pixel) across five deposited films (drop volume, 0.3 μl) of BSA at five different concentrations (0.5, 0.4, 0.3, 0.2, and 0.1 mM). The integrated EVV 2DIR intensity (I) of the square-rooted image for each dried drop is plotted against the total number of protein molecules (NBSA). The error bars are standard deviations from four repeats performed on four different sets of five samples. The solid lines represent the linear fit; the equation for the fit is also shown.
An additional advantage of EVV 2DIR as a proteomic tool is that it is nondestructive, such that the samples can be retained for further and more detailed investigations. Preliminary results from peptides also strongly suggest that EVV 2DIR has the potential to monitor levels of posttranslational modifications such as phosphorylation.
Methods
EVV 2DIR Spectroscopy.
A full description of the laser setup and the principles of this technique can be found elsewhere (11, 12). In brief, a commercial picosecond regenerative amplifier and two IR optical parametric amplifiers were used to provide a visible beam at 800 nm and two frequency-scannable IR beams. The three beams were overlapped on the sample, and the visible four-wave mixing signal produced at ωδ (ωδ = ωγ + ωβ − ωα, where ωα and ωβ are the frequencies of the IR beams, and ωγ is the frequency of the incident visible beam) was detected in transmission with a photomutliplier. The detected signal was plotted as a function of both IR frequencies to produce two-dimensional spectra. For the results presented here, the photomultiplier was used in photon-counting mode. This allowed the data to be collected by using longer time delays between the laser pulses, thus producing less congested protein spectra. The congestion issue was also addressed by changing the polarization of the visible beam; we discovered that this helped to further decongest the spectra, making phenylalanine and tryptophan peaks exploitable.
Bioinformatics.
Human protein sequences were obtained as fasta file from ENSEMBL release 44 (19). Amino acid compositions and protein molecular weights were then computed by using pepstats from Emboss 5.0 package (28). The output file was parsed by using custom Python scripts, and the data were stored in MySQL database on a Linux workstation. The number of database hits to a protein query was calculated by counting all entries within a given accuracy interval by using SQL and Python scripts.
Sample Preparation.
Proteins were prepared in the form of dried films, cast onto glass slides. The following 10 proteins were used (all were bought from Sigma–Aldrich): albumin from bovine serum, albumin from chicken egg white, aldolase from rabbit muscle, alkaline phosphatase from bovine intestinal mucosa, α-chymotrypsin from bovine pancreas, concanavalin A from Jack Bean, α-lactalbumin from bovine milk, β-lactoglobulin B from bovine milk, lysozyme from chicken egg white, and pepsin from porcine gastric mucosa. The protein solutions had concentrations in the range from 10 to 50 mg/ml, and volumes of 1.5 μl were deposited (see SI Text).
Procedure for the Peak Intensity Measurements.
Once two-dimensional spectral features have been identified and associated with amino acids, there is no need for two-dimensional spectra to be recorded for each protein. The signal intensity can be measured for the pairs of IR frequencies corresponding to the peaks of interest. For the measurements presented here, the delays were set at T12 = 2 ps and T23 = 1 ps, which was discovered to be a compromise between signal strength and decongestion. The intensity on each peak was recorded for 5 s over a period of 120 s, and the amino acid/CH3 ratios (corrected from the nonresonant background) were calculated. To assess the reproducibility, the measurements were repeated four times for the full set of 10 proteins. The details of the acquisition procedure and ratio calculations are presented in the SI Text.
Protein Differentiation Overlap Integrals: Definition of Distinguishability.
A normal distribution of amino acid/CH3 ratios was constructed for each protein by using the measured ratios, the standard deviations, and the linear fit. To compare two proteins, the overlap integral of their ratio distributions was calculated to give a mathematical definition of distinguishability (see SI Text). If a protein is compared with itself, then the overlap integral is maximum and the normalized integral is one. A comparison of proteins with at least one orthogonal subintegral gives a null integral.
Absolute Quantification of Proteins Levels.
BSA solutions of five different concentrations were deposited and left to dry on a microscope cover slide. Concentrations of 0.5, 0.4, 0.3, 0.2, and 0.1 mM were used, which correspond to ≈9 × 10¹³, 7 × 10¹³, 5.5 × 10¹³, 3.5 × 10¹³, and 2 × 10¹³ total protein molecules respectively in each of the 0.3-μl drops. Because of the spatial heterogeneity of the dried films (thickness, material density), the EVV 2DIR signal on the CH3 peak (at 1,485/2,930, delays set at T12 = 1.5 ps and T23 = 1 ps) was mapped across all five dried drops. The images were measured with 1 s of acquisition time per point in photon-counting mode. They were corrected for any photon-counting nonlinearity and then background corrected and square rooted. The integrated intensity (of the square-rooted image) associated with each drop reflects the total number of protein molecules in the deposited volume. Plotting this against the known protein content of each film gives a straight line and an effective calibration curve for quantifying the protein levels.
Supplementary Material
Acknowledgments.
We thank Dr. C. J. Barnett for technical support. This work was supported by the Engineering and Physical Sciences Research Council (EPSRC) and the Chemical Biology Centre Doctoral Training Centre (CBC DTC).
Footnotes
The authors declare no conflict of interest.
This article is a PNAS Direct Submission.
This article contains supporting information online at www.pnas.org/cgi/content/full/0805127105/DCSupplemental.
References
- 1.Ellis DI, et al. Metabolic fingerprinting as a diagnostic tool. Pharmacogenomics. 2007;8:1243–1266. doi: 10.2217/14622416.8.9.1243. [DOI] [PubMed] [Google Scholar]
- 2.Elrick MM, Walgren JL, Mitchell MD, Thompson DC. Proteomics: Recent applications and new technologies. Basic Clin Pharmacol Toxicol. 2006;98:432–441. doi: 10.1111/j.1742-7843.2006.pto_391.x. [DOI] [PubMed] [Google Scholar]
- 3.Lescuyer P, Hochstrasser D, Rabilloud T. How shall we use the proteomics toolbox for biomarker discovery? J Proteome Res. 2007;6:3371–3376. doi: 10.1021/pr0702060. [DOI] [PubMed] [Google Scholar]
- 4.Petricoin EF, Paweletz CP, Liotta LA. Clinical applications of proteomics: Proteomic pattern diagnostics. J Mammary Gland Biol Neoplasia. 2002;7:433–440. doi: 10.1023/a:1024042200521. [DOI] [PubMed] [Google Scholar]
- 5.Thongboonkerd V. Clinical proteomics: Towards diagnostics and prognostics. Blood. 2007;109:5075–5076. [Google Scholar]
- 6.Veenstra TD. Global and targeted quantitative proteomics for biomarker discovery. J Chromatogr B. 2007;847:3–11. doi: 10.1016/j.jchromb.2006.09.004. [DOI] [PubMed] [Google Scholar]
- 7.Barth A. Infrared spectroscopy of proteins. Biochim Biophys Acta. 2007;1767:1073–1101. doi: 10.1016/j.bbabio.2007.06.004. [DOI] [PubMed] [Google Scholar]
- 8.Hering JA, Innocent PR, Haris PI. Towards developing a protein infrared spectra databank (PSID) for proteomics research. Proteomics. 2004;4:2310–2319. doi: 10.1002/pmic.200300808. [DOI] [PubMed] [Google Scholar]
- 9.Tuma R. Raman spectroscopy of proteins: From peptides to large assemblies. J Raman Spectrosc. 2005;36:307–319. [Google Scholar]
- 10.Donaldson PM, et al. Decongestion of methylene spectra in biological and non-biological systems using picosecond 2DIR spectroscopy measuring election-vibration-vibration coupling. Chem Phys. 2008;350:201–211. [Google Scholar]
- 11.Donaldson PM, et al. Direct identification and decongestion of Fermi resonances by control of pulse time ordering in two-dimensional IR spectroscopy. J Chem Phys. 2007;127:114513-1–114513-10. doi: 10.1063/1.2771176. [DOI] [PubMed] [Google Scholar]
- 12.Fournier F, et al. Optical fingerprinting of peptides using two-dimensional infrared spectroscopy: Proof of principle. Anal Biochem. 2008;374:358–365. doi: 10.1016/j.ab.2007.11.009. [DOI] [PubMed] [Google Scholar]
- 13.Cornish-Bowden A. Relating proteins by amino acid composition. Method Enzymol. 1983;91:60–75. doi: 10.1016/s0076-6879(83)91011-x. [DOI] [PubMed] [Google Scholar]
- 14.Nakashima H, Nishikawa K, Ooi T. The folding type of a protein Is relevant to the amino-acid composition. J Biochem. 1986;99:153–162. doi: 10.1093/oxfordjournals.jbchem.a135454. [DOI] [PubMed] [Google Scholar]
- 15.Chou KC. A novel-approach to predicting protein structural classes in a (–1)-D amino-acid-composition space. Proteins Struct Funct Genet. 1995;21:319–344. doi: 10.1002/prot.340210406. [DOI] [PubMed] [Google Scholar]
- 16.Garrels JI, et al. Protein identifications for a saccharomyces-cerevisiae protein database. Electrophoresis. 1994;15:1466–1486. doi: 10.1002/elps.11501501210. [DOI] [PubMed] [Google Scholar]
- 17.Hobohm U, Houthaeve T, Sander C. Amino-acid-analysis and protein database compositional search as a rapid and inexpensive method to identify proteins. Anal Biochem. 1994;222:202–209. doi: 10.1006/abio.1994.1474. [DOI] [PubMed] [Google Scholar]
- 18.Wilkins MR, et al. From proteins to proteomes: Large scale protein identification by two-dimensional electrophoresis and amino acid analysis. Biotechnology. 1996;14:61–65. doi: 10.1038/nbt0196-61. [DOI] [PubMed] [Google Scholar]
- 19.Flicek P, et al. Ensembl 2008. Nucleic Acids Res. 2008;36:D707–D714. doi: 10.1093/nar/gkm988. [DOI] [PMC free article] [PubMed] [Google Scholar]
- 20.Besemann DM, et al. Interference, dephasing, and vibrational coupling effects between coherence pathways in doubly vibrationally enhanced nonlinear spectroscopies. Chem Phys. 2001;266:177–195. [Google Scholar]
- 21.Condon NJ, Wright JC. Doubly vibrationally enhanced four-wave mixing in crotononitrile. J Phys Chem A. 2005;109:721–729. doi: 10.1021/jp045963p. [DOI] [PubMed] [Google Scholar]
- 22.Kwak K, Cha S, Cho M, Wright JC. Vibrational interactions of acetonitrile: Doubly vibrationally resonant IR-IR-visible four-wave-mixing spectroscopy. J Chem Phys. 2002;117:5675–5687. [Google Scholar]
- 23.Zhao W, Wright JC. Measurement of Chi(3) for doubly vibrationally enhanced four wave mixing spectroscopy. Phys Rev Lett. 1999;83:1950–1953. [Google Scholar]
- 24.Zhao W, Wright JC. Spectral simplification in vibrational spectroscopy using doubly vibrationally enhanced infrared four wave mixing. J Am Chem Soc. 1999;121:10994–10998. [Google Scholar]
- 25.Zhao W, Wright JC. Doubly vibrationally enhanced four wave mixing: The optical analog to 2D NMR. Phys Rev Lett. 2000;84:1411–1414. doi: 10.1103/PhysRevLett.84.1411. [DOI] [PubMed] [Google Scholar]
- 26.Shen Y R. The Principles of Nonlinear Optics. New York: Wiley; 1984. [Google Scholar]
- 27.Howell NK, Arteaga G, Nakai S, Li-Chan ECY. Raman spectral analysis in the C-H stretching region of proteins and amino acids for investigation of hydrophobic interactions. J Agric Food Chem. 1999;47:924–933. doi: 10.1021/jf981074l. [DOI] [PubMed] [Google Scholar]
- 28.Rice P, Longden I, Bleasby A. EMBOSS: The European Molecular Biology Open Software Suite. Trends Genet. 2000;16:276–277. doi: 10.1016/s0168-9525(00)02024-2. [DOI] [PubMed] [Google Scholar]
Associated Data
This section collects any data citations, data availability statements, or supplementary materials included in this article.


