

Abstract
This article provides a review of our recent Rayleigh scattering measurements on single metal nanoparticles. Two different systems will be discussed in detail: gold nanorods with lengths between 30 and 80 nm, and widths between 8 and 30 nm; and hollow gold–silver nanocubes (termed nanoboxes or nanocages depending on their exact morphology) with edge lengths between 100 and 160 nm, and wall thicknesses of the order of 10 nm. The goal of this work is to understand how the linewidth of the localized surface plasmon resonance depends on the size, shape, and environment of the nanoparticles. Specifically, the relative contributions from bulk dephasing, electron–surface scattering, and radiation damping (energy loss via coupling to the radiation field) have been determined by examining particles with different dimensions. This separation is possible because the magnitude of the radiation damping effect is proportional to the particle volume, whereas, the electron–surface scattering contribution is inversely proportional to the dimensions. For the nanorods, radiation damping is the dominant effect for thick rods (widths greater than 20 nm), while electron–surface scattering is dominant for thin rods (widths less than 10 nm). Rods with widths in between these limits have narrow resonances—approaching the value determined by the bulk contribution. For nanoboxes and nanocages, both radiation damping and electron–surface scattering are significant at all sizes. This is because these materials have thin walls, but large edge lengths and, therefore, relatively large volumes. The effect of the environment on the localized surface plasmon resonance has also been studied for nanoboxes. Increasing the dielectric constant of the surroundings causes a red-shift and an increase in the linewidth of the plasmon band. The increase in linewidth is attributed to enhanced radiation damping.
1. Introduction
Optical studies of single metal particles have a long history in physical science—dating back to Zsigmondy’s work at the turn of the previous century. Zsigmondy and coworkers developed a dark-field immersion microscope that allowed them to observe and count single metal particles in a liquid, and so estimate their size.1 They were also able to study the kinetics of particle coagulation, as well as the structure of many different types of heterogeneous systems. The ability to study both soft and hard materials has led to the wide use of dark-field microscopy in biological and materials sciences. In the past decade this technique has been rediscovered for the study of metal particles.2,3 By coupling a dark-field microscope to an imaging monochromator and CCD camera, the Rayleigh scattering spectra from single particles can be readily measured.2 For nanoparticles of silver and gold, the spectrum is dominated by the localized surface plasmon resonance (LSPR), which is a collective oscillation of the conduction electrons.4 This resonance is extremely intense: the absorption and scattering cross-sections of silver and gold nanoparticles are many times their geometric size,5,6 which has lead to their widespread use as non-bleaching labels for optical imaging of biological samples.3,7
This article is concerned with how the LSPR of noble metal nanoparticles—particularly the linewidth—depends on the particle size, shape, and environment.8–12 Spectroscopic studies of the broadening of the LSPR at small sizes for silver and gold particles were first reported almost 50 years ago.13–16 These ensemble measurements clearly demonstrated the effect of electron–surface scattering on the LSPR linewidth. They also represent (to the best of our knowledge) the first observations of size effects in the optical properties of materials—a topic which is of tremendous current interest in the context of small semiconductor particles.17–19 However, because samples of metal particles are typically heterogeneous, with different sizes and shapes present, ensemble measurements cannot give accurate information about broadening of the LSPR. This problem can be overcome by studying single particles.
The first spectroscopic studies of single metal particles were reported by the Schultz and Feldmann groups.2,3,20,21 Schultz and coworkers performed correlated transmission electron microscopy/single particle Rayleigh scattering measurements for silver particles to determine how the frequency of the LSPR depends on size and shape.21 They were able to show, for example, that spherical particles have resonances in the blue, while triangular shaped particles scatter red light. Feldmann and coworkers examined silver and gold spheres, and gold nanorods.20,22 Their measurements showed a significant reduction in the linewidth of the LSPR at a given resonance frequency for rods compared to spheres. This was attributed to reduced radiation damping for the rods. Since these studies there have been a number of reports of the spectra of single metal particles with different sizes and shapes, mostly emphasizing the frequency of the LSPR.21–29 In contrast, there have been fewer studies focused on the linewidth.20,22,30–35
There are several reasons why the linewidth has received less attention. First, the main interest in linewidth for metal particles is at small sizes, where electron–surface scattering becomes an important dephasing mechanism for the plasmon electrons.4,13–16,36,37 However, because the intensity of scattered light is proportional to the square of the particle volume,5,6 small particles are extremely hard to see by dark-field microscopy. This problem has recently been overcome by the development of sensitive absorption based techniques: absorption scales as the volume and, thus, can be used to study much smaller objects.38–43 For example, Lounis and coworkers recorded absorption spectra for spherical gold particles with sizes down to ~5 nm diameter using a thermal lensing detection scheme.38,41,43 Measurements of the half-width of the LSPR showed significant broadening at small sizes due to electron–surface scattering.41 These results will be discussed in more detail below. A second issue is particle symmetry: for the linewidth measurement to be meaningful the spectrum should contain a single, isolated surface plasmon resonance. This limits the choices of samples for study. Spheres fulfil this condition, as do nanorods with aspect ratios greater than 2.44 However, complex shaped particles such as nanostars have multiple resonances,28 which makes it difficult to interpret the spectra without detailed electrodynamics calculations.45
Recently we have used Rayleigh scattering spectroscopy to study the linewidths of gold nanorods,33 and hollow nanocubes—termed “nanoboxes” or “nanocages” depending on their exact morphology.34,46 Both materials have two important dimensions: for the rods these are length and width, and for the nanoboxes and nanocages they are edge length and wall thickness. When the width or wall thickness of the particles is reduced to below 10 nm, electron–surface scattering effects become important—as they do in spherical particles.4,13–16,36,37,41 However, unlike spheres, the nanorods and nanoboxes still have reasonable volumes and, thus, scatter light efficiently. This is because their lengths or edge lengths are relatively large. Thus, dark-field microscopy can be used to examine electron–surface scattering effects for these particles. Analysis of the data provides information about how radiation damping and electron–surface scattering compete to determine the width of the LSPR.
The remainder of this article is laid out as follows: Section 2 gives a brief description of the dark-field microscopes used for these experiments; Section 3 provides an overview of the relevant theory for dephasing processes in metal particles; and Sections 4 and 5 give detailed descriptions of our experiments with nanorods and nanoboxes/nanocages, respectively. Readers interested in how the different particles are synthesized are directed to the appropriate references. The particles studied were engineered to have plasmon resonances in the near-IR region of the spectrum. There are two reasons for this. First, materials with resonances in this spectral region are of interest for biomedical applications due to the near-IR transparency window of tissues.47,48 Second, the bulk damping contribution for gold and silver is much less in the near-IR.49–52 This leads to smaller intrinsic linewidths, which allows more accurate measurement of effects from radiation damping and electron–surface scattering.
The results from our measurements show that both electron–surface scattering and radiation damping can make significant contributions to the linewidth of the LSPR.33,34,46 For the nanorods, electron–surface scattering is the dominant effect for narrow rods (widths < 10 nm), and radiation damping dominates for thick rods (widths > 20 nm).33 Rods with “in between” thicknesses have narrow resonances, which are essentially free from either radiation damping or electron–surface scattering effects.20,30,33 On the other hand, for nanoboxes and nanocages both electron–surface scattering and radiation damping are large effects at all the sizes that we have investigated.34,46 This causes these materials to have very broad LSPRs. The nanoboxes also show an increase in linewidth when the dielectric constant of the environment is increased.46 This is attributed to radiation damping: coupling of the plasmon resonance to the radiation field is stronger in media with higher dielectric constants.53,54 This effect has not been reported in previous studies on the environmental dependence of the LSPR,22,25–27 presumably because the particles examined were too small to display appreciable radiation damping.
The goal of this work is to determine values for the parameters that describe electron–surface scattering and radiation damping for different metals and particle shapes. This data serves as both input parameters for, and a test of, numerical calculations of the optical response of metal nanostructures.10,11 The results of these experiments are important for applications such as molecular sensing,55,56 where the shift in the plasmon resonance is used to report on the binding of a target molecule to a receptor attached to the surface of the particle. These experiments require materials with narrow resonances, so the shift can be accurately measured.27,55,56 These studies are also relevant to surface-enhanced spectroscopies, where the high electric field at the particle surface is used to increase the rates of scattering,57–62 emission,63,64 and/or absorption.65–67
2. Experimental section
2.1 Dark-field microscopy
The spectra presented below were recorded using an inverted optical microscope equipped with a dark-field condenser.2,3 A diagram of the experimental arrangement is shown in Fig. 1. The dark-field condenser forms a hollow cone of light focused at the sample. Only light that is scattered out of this cone reaches the objective (which must have a smaller numerical aperture than the condenser). Thus, particles on the substrate appear as bright, diffraction-limited spots on a dark background, as shown by the true color image of a single nanobox in Fig. 1. This particle has a plasmon resonance at approximately 650 nm and, thus, appears as an orange spot. Two different microscope systems were used for the experiments described below: an Olympus IX-71 with an oil immersion dark-field condenser (Olympus U-DCW) and a 60× objective;31,34,46 and a Nikon Eclipse TE-2000 with a dry dark-field condenser and a 40× objective.33 In both systems the light collected by the objective is sent to an imaging monochromator (Acton Research MicroSpec 2150i) equipped with a CCD camera—either a liquid N2 cooled Roper Scientific 100 × 1340 B,31,34,46 or a TE-cooled ACTON Princeton Instruments PIXIS 1024.33
Fig. 1.
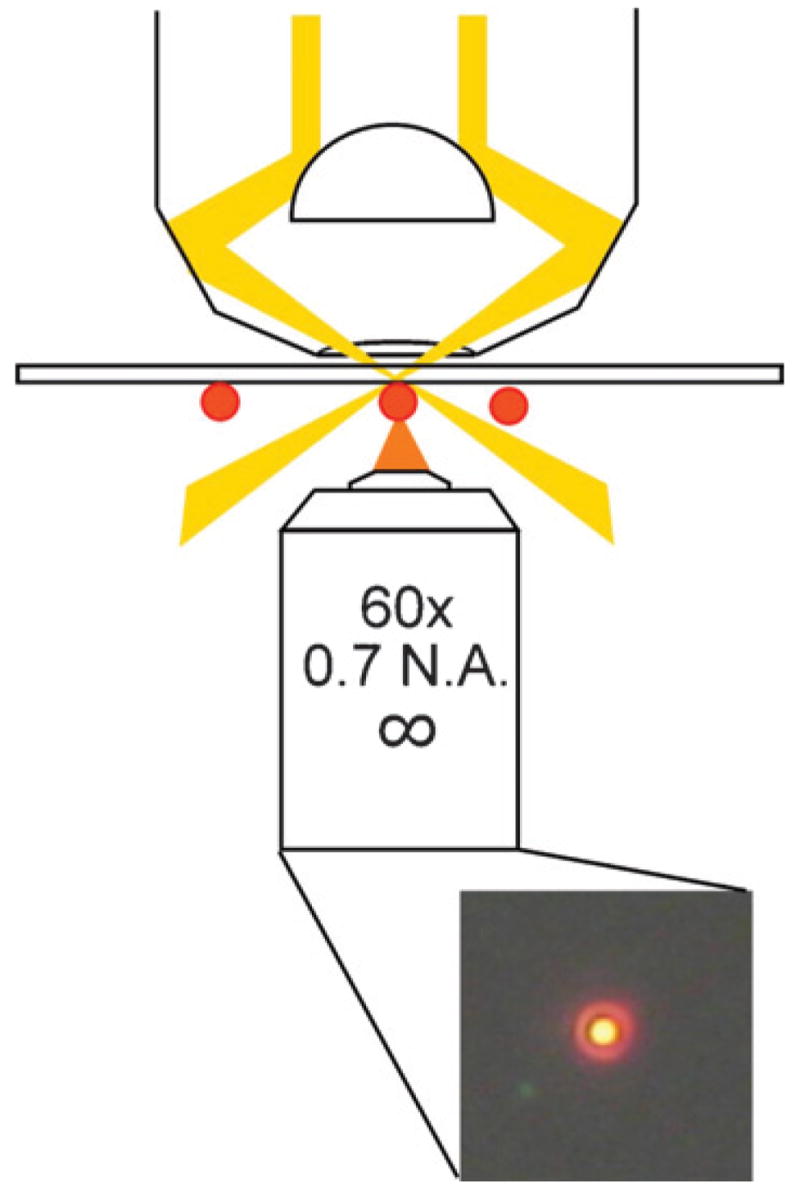
Schematic of the experimental arrangement for dark-field microscopy studies of metal nanoparticles.
The experiments were performed by first recording an image of the sample with a mirror in the light path of the spectrometer. Once a suitable particle (or collection of particles) has been selected, the mirror is switched with a grating (150 groves mm−1) to disperse the scattered light. Normalized Rayleigh scattering spectra from individual particles were obtained by subtracting and dividing by a background, taken from a nearby area of the CCD detector (identical pixel width but without particles).33,34 The acquisition times for the spectra varied from 10 s to 1 min, depending on the sample and detector. The spectra were fitted to a Lorentzian function I(ω) = C0/[(ω − ω0)2 + Γ2/4], to determine the linewidth Γ and the resonance frequency ω0.
2.2 Sample preparation
Gold nanorods were prepared by seed-mediated growth using either chemical reduction68–70 or photochemical reduction techniques.71 The dimensions of the rods were controlled by varying the amount of gold seed relative to gold salt. Both single-crystal and penta-twinned gold nanorods were studied.72 The size distributions were characterized by transmission electron microscopy (TEM) using either a Philips CM120 BioTWIN TEM (120 kV accelerating voltage), a JEOL JEM 1010 TEM (100 kV accelerating voltage), or a Joel JEM-100SX TEM (100 kV accelerating voltage). Several hundred particles were counted for each sample to determine the average length and width distributions of the nanorods. Slides for optical microscopy analysis were prepared either by drop-casting a diluted solution (~10× from the as-prepared sample) onto a clean glass slide, or by spin casting a 0.5 wt% polyvinyl alcohol (PVA) solution containing the particles at 3000 rpm for 5 s.33
Au–Ag nanoboxes and nanocages were synthesized according to the procedure described in ref. 73–75. For these samples scanning electron microscopy (SEM) was performed in conjunction with dark-field microscopy, to ensure that only single particles were interrogated.46 The particles were deposited on indium-tin-oxide (ITO) coated glass substrates (SPI Supplies). These substrates are optically transparent in the visible region, and are conductive enough for SEM measurements. In order to perform correlated dark-field optical microscopy and SEM experiments, a registration pattern on the ITO substrate was created by thermal evaporation of a 15 nm Au layer through a designed photomask. The patterned slide was sonicated in water to remove dust from the surface, and rinsed with deionized water and ethanol. A drop of the diluted nanoparticle solution was placed near the registration marks, and immediately removed using a micropipete. The substrate was allowed to dry at room temperature and carefully stored in a nitrogen environment to inhibit oxidation of the particles. Secondary electron SEM (SE-SEM) images and back-scattering SEM images were obtained using a field-emission microscope (Sirion XL, FEI) operated at 5 kV. The composition of the nanoparticles was analyzed using an energy dispersive X-ray microanalysis (EDAX) system incorporated with the Sirion electron microscope. The AuM and AgL lines were used to measure the contents of Au and Ag in the particles, respectively.46 TEM analysis of the nanobox and nanocage samples used in our experiments were performed with a Philips 420 TEM operated at 120 kV. Correlated dark-field optical microscopy and scanning electron microscopy studies were also performed for a gold nanorod sample using the recently reported focused ion beam registration method.76 In these experiments a focused ion beam (FIB) lithography system (xT Nova NanoLab) is used to mark the substrate with an easily recognizable pattern, which serves as a locator for both SEM measurements (also performed on the xT Nova NanoLab instrument) and dark-field microscopy studies.
3. Dephasing processes in metal nanoparticles
The plasmon resonance corresponds to a coherent oscillation of the conduction electrons of the particle.4 This oscillation dephases by a variety of processes, such as scattering of the electrons into empty levels in the conduction band, and electron–phonon coupling.4 These effects are entirely described by the dielectric function of the particle and, in the absence radiation damping, the linewidth of the plasmon resonance is given by:4,77
| (1) |
where ε1 and ε2 are the real and imaginary components of the dielectric function, respectively, and |∂ε1/∂ω| ≫ |∂ε2/∂ω| in the region of interest for our experiments. This equation was derived for spherical particles in the quasi-static (dipole) limit.77 However, it is appropriate for any isolated resonance, as long as the particles are small enough that radiation damping is not significant.
For particles larger than ~20 nm diameter, the values for ε1 and ε2 obtained from optical experiments on metal films can be used in eqn (1). At smaller sizes, a correction due to electron–surface scattering has to be included.4,36,37,51,52 This is formally done by splitting the dielectric function into interband εib and intraband (free electron) εf contributions: ε = ε1 + iε2 = εib + εf51,52 The free electron component is calculated using the Drude model:78
| (2) |
where ωp is the plasma frequency, and γb is the bulk damping constant. Values for ωp and γb are determined by fitting eqn (2) to the low frequency portion of the experimentally measured (bulk) dielectric function εbulk (ω).49,52 The interband component is then obtained by subtracting the free electron component from εbulk(ω), i.e., εib(ω) = εbulk(ω) −{1 − ωp2/ω(ω+ iγb)}.10,11,49,51,52 Electron–surface scattering is included by adding a term that is inversely proportional to the particle’s dimensions to the damping constant in the Drude model, that is, by writing36,37
| (3) |
where νF is the Fermi velocity, Leff is the effective path length of the electrons, and A is a constant to be determined. The effective path length for the electrons depends on the size and shape of the particles. A general expression has recently been derived for Leff in terms of the volume V and surface area S of the particles: Leff = 4V/S.30,79 This expression gives a consistent way of examining electron–surface scattering in particles with different shapes.
The dielectric function of the particles including surface scattering is, thus, given by11
| (4) |
Separating ε(ω) into real and imaginary parts, and noting that ω ≫ γb for optical frequencies, one obtains51
| (5a) |
and
| (5b) |
Thus, the correction for electron–surface scattering mainly affects the imaginary component of the dielectric constant, which is responsible for determining the width of the plasmon resonance—see eqn (1).4
In the near-IR region, the dielectric functions of silver and gold are dominated by the free electron contributions, thus, ε(ω) ≈ εf(ω), so that |(∂ε1/∂ω)| ≈ 2ωp2/ω3. Using eqn (1) to calculate the linewidth then yields the simple expression
| (6) |
This expression is widely used to analyze experimental data. Note that for gold and silver in the visible to near-UV regions, where the interband contributions to the dielectric function become important, |(∂ε1/∂ω)| ≠ 2ωp2/ω3. In this case the linewidth is given by
| (7) |
where the first term on the right hand side is the bulk contribution to the linewidth, which includes effects from the interband transitions (this term can be easily calculated from the bulk dielectric function), and the second term is the electron–surface scattering contribution. However, the factor up to ca. 2.5 eV for gold and 3 eV for silver, which means that the electron–surface terms in eqn (6) and (7) are virtually the same for most cases.31,34
As the size of the particles increases, coupling of the LSPR oscillation to the radiation field can become an important energy loss mechanism.20,22,32–34,46 This effect is known as radiation damping, and is not included in the above analysis. For spherical particles, radiation damping can be accounted for by using the full Mie theory expression to calculate the scattering cross-sections.4,5 For particles where the size and dielectric environment are well defined, the calculated and measured spectra are in almost perfect agreement.20,22 Fig. 2 shows a plot of the calculated linewidth versus radius for silver spheres in different dielectric environments (air, water, and oil), obtained from the Mie scattering cross-sections. The dielectric functions for the silver particles used in these calculations were taken from ref. 49, and did not include the correction for electron–surface scattering. The increase in linewidth with increasing radius is due to radiation damping. The important points to note from this figure are: (i) radiation damping is significant for silver particles with radii greater than 10 nm;20,22,23 (ii) the increase in linewidth from radiation damping is roughly proportional to the volume; and (iii) the effect is much stronger in higher dielectric constant environments.53,54 This last point is important in the following discussion. The differences in the calculated linewidths at small sizes arise because oil and water produce a significant red-shift in the LSPR, which decreases the bulk contribution to Γ.4
Fig. 2.
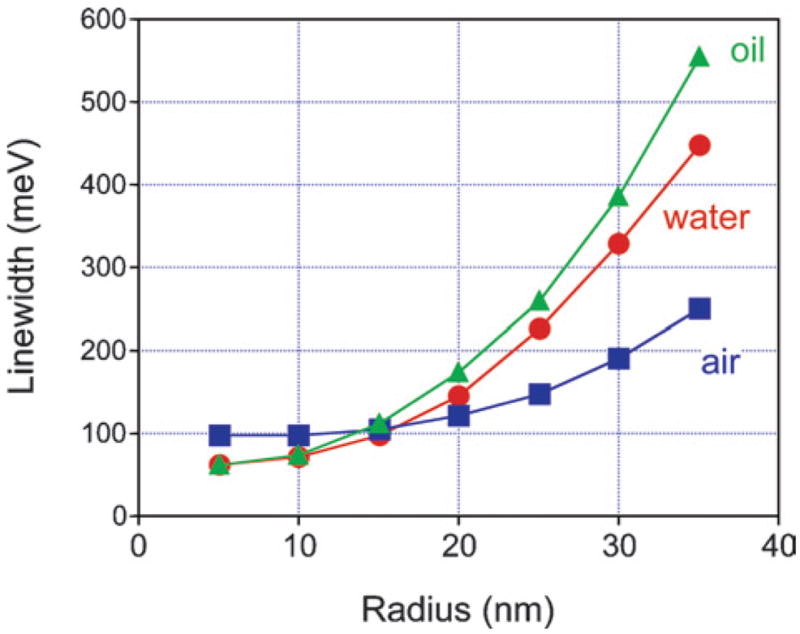
Linewidth of the LSPR for spherical Ag particles in different environments versus radius. The linewidths were obtained from the scattering cross-sections versus energy calculated using the full Mie theory expressions.
A simple approach for analysis of experimental data for particles that display radiation damping is to add an extra term to eqn (6) that is proportional to the volume V:20,22,23,33,34,46
| (8) |
where κ is a constant that describes the magnitude of radiation damping. Thus, in principle, the relative contributions from bulk dephasing, electron–surface scattering and radiation damping (that is, the values of A and κ) can be determined by recording scattering spectra from samples with different dimensions (different values of Leff and V). This approach is used in the analysis of the nanorod data in Section 4 below.
It is important to remember that eqn (8) is only valid when the LSPR corresponds to a single dipolar resonance. This is a reasonable assumption for spherical particles with diameters <100 nm (i.e., at sizes where the quadrupole resonance is not significant), or for nanorods with aspect ratios greater than 2. However, for very large particles, or for particles with more complicated geometries, the extinction and scattering spectra have to be calculated numerically. A simple and accurate method for calculating the optical properties of particles with arbitrary sizes and shapes is to use the Discrete Dipole Approximation (DDA).10,11 In this approach, the target particle is divided into N polarizable point dipoles on a cubic lattice.80 The response of the particle to an incident field is then obtained by solving the 3N differential equations that describe the interaction of the point dipoles with each other and with the field.10,80 This method has been used to study a wide range of different sized and shaped particles.10–12 It is particularly well suited to studying particles with cubic geometries,12,26 such as the nanoboxes presented below. These calculations naturally include radiation damping; electron–surface scattering can be added by using eqn (4) for the dielectric function. In this case, to determine a value for the surface scattering parameter from experimental data, a series of calculations must be performed with different values of A, and the results compared to measured linewidths. This approach is used in the analysis of the nanobox data in Section 5 of this paper.
4. Rayleigh scattering spectra of gold nanorods
To study the dephasing process in gold nanorods we examined samples that had different widths, but approximately the same aspect ratio. Keeping the aspect ratio constant ensures that the resonance frequencies44,81 and, therefore, the bulk dephasing contributions are similar for all the samples.4 Fig. 3 shows representative TEM images and size distribution histograms (length, width, and aspect ratio) for two different nanorod samples, one with an average width of w̄ = 8 nm, and one with w̄ = 14 nm.33 Both samples have an average aspect ratio of ~4. Note that the wider rods are much longer (51 nm compared to 32 nm) and, therefore, have significantly larger volumes. Fig. 4 shows single particle Rayleigh scattering spectra from the two samples presented in Fig. 3. The spectra for the w̄ = 8 nm sample are broader and noisier than the spectra from the w̄ = 14 nm sample. The increased noise arises because the 8 nm diameter rods have smaller volumes and, therefore, do not scatter light as efficiently.
Fig. 3.

Transmission electron microscopy images, and size distribution histograms (length, width and aspect ratio) for nanorod samples with w̄ = 8 nm (left) and w̄ = 14 nm (right). Note the different scale bars for the two TEM images: left scale bar = 25 nm; right scale bar = 200 nm. Reprinted with permission from Physical Chemistry Chemical Physics.33 Copyright 2006 The Royal Society of Chemistry.
Fig. 4.
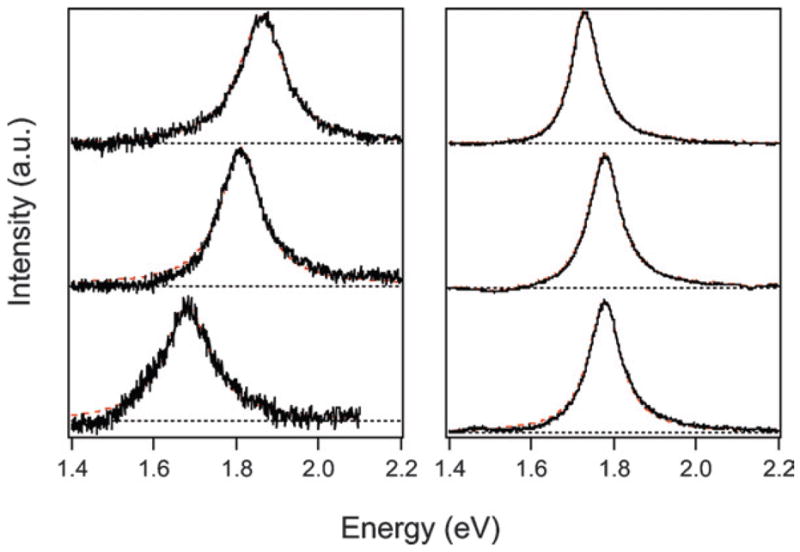
Example light scattering spectra for samples with w̄ = 8 nm (left) and w̄ = 14 nm (right). The spectra were obtained with a dark-field microscope, and an exposure time of 1 min on the CCD camera. The dashed lines show fits to the data using a Lorentzian function. Reprinted with permission from Physical Chemistry Chemical Physics.33 Copyright 2006 The Royal Society of Chemistry.
Fig. 5 shows plots of the linewidth versus resonance energy for a series of nanorod samples with different diameters.33 The samples are arranged in order of increasing diameter (left-to-right and top-to-bottom), and are labeled according to their average width. This data clearly shows that the samples of narrow rods (w̄ <10 nm in diameter) and wide rods (w̄ > 20 nm in diameter) have broader linewidths compared to the w̄ = 12 nm to w̄ = 14 nm samples. The increase in linewidth at larger diameters is attributed to radiation damping, and the increase at smaller diameters is assigned to electron–surface scattering. This observation is in contrast to the results from the Feldman and Guyot-Sionnest groups,20,30 who did not see any effects from either electron–surface scattering or radiation damping for gold nanorods. We believe that this is because they did not examine samples with a wide enough range of diameters (early gold nanorod synthesis did not allow the preparation of samples with tunable radii).
Fig. 5.

Linewidths vs. resonance energy for different nanorod samples. Linewidths were obtained by Lorentzian fits to the spectra, and the average width of the nanorods is given in the figure. Reprinted with permission from Physical Chemistry Chemical Physics.33 Copyright 2006 The Royal Society of Chemistry.
The data in Fig. 5 also shows that the increase in the linewidths for the samples with average widths of 8 nm, 19 nm and 30 nm is accompanied by an increase in the scatter in the data. This is unexpected. To ensure that we are not detecting particles with different shapes, or dimers of particles in these experiments, we performed correlated SEM/dark-field measurements. In these experiments FIB milling was used to produce registration marks on an ITO surface that was spin coated with gold nanorods—see Fig. 6 (a). SEM images of the rods within the box were then recorded to determine their size and shape, and their Rayleigh scattering spectra were measured by dark-field microscopy.76 An example spectrum and SEM image are shown in Fig. 6 (c). The measured linewidths are plotted against the width of the rods in Fig. 6 (d). Within this (limited) data set, there is no correlation between the measured linewidth and the width. The average width of the nanorods in these experiments was 20 nm, and the linewidth data is very similar in terms of the average value and scatter to the w̄ = 19 nm sample. Thus, the scatter in the linewidth measurements is neither due to dimer formation, nor to the presence of particles with odd shapes.
Fig. 6.

Top: (A) SEM and (B) Dark-Field Microscopy (DFM) images of a box milled onto an ITO-covered glass slide using an FIB/scanning electron microscope. The unique corner mark in the lower left is used to orient the box. The white spots in the dark-field image are scattered light from the gold nanorods. The scale bar = 50 μm. Bottom: (C) Rayleight scattering spectra from a single nanorod. The inset shows an SEM image of this particle (scale bar = 100 nm). (D) Linewidth versus width for different nanorods examined in the correlated SEM/dark-field experiments.
Fig. 7 shows a plot of the average linewidth determined from the single particle measurements versus the average value of 1/Leff determined from TEM/SEM analysis for all the samples investigated. The effective path length for the electrons was calculated by modeling the rods as spherically capped cylinders; specifically, Leff = w(1 − w/3l), where w is the width and l is the total length.33 The error bars in Fig. 7 represent the standard deviations. The open symbol represents the data from the correlated SEM/dark-field experiments in Fig. 6. This data clearly shows that the linewidth increases for both thick rods (small values of 1/Leff), and thin rods (large values of 1/Leff).
Fig. 7.
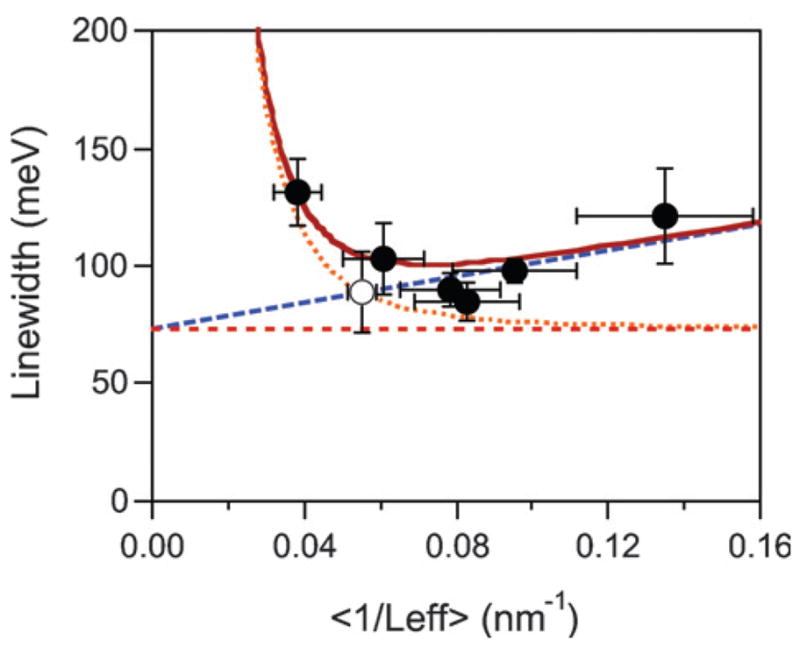
Linewidth versus average value of 1/Leff for gold nanorods with aspect ratios between 2 and 4. The error bars indicate the standard deviations. The lines show the linewidths calculated from bulk scattering (Γbulk, horizontal line), bulk plus electron–surface scattering (Γbulk + Γsurf, dashed line), and bulk plus radiation damping (Γbulk + Γrad, dotted line). The solid line shows the total linewidth. Reprinted with permission from Physical Chemistry Chemical Physics.33 Copyright 2006 The Royal Society of Chemistry.
The solid line in Fig. 7 shows the result of fitting eqn (8) to the experimental data. In these calculations the particles were assumed to have an aspect ratio of 3, and the value of γb was fixed at 75 meV, which is the value calculated from the dielectric constant data given in ref. 49,50. The values of A and κ obtained are A = 0.30 ± 0.03 and κ = (6.2 ± 0.5) × 10−7 fs−1 nm−3.82 The dashed lines in Fig. 7 represent the contributions from bulk dephasing, electron–surface scattering and radiation damping to the linewidth. These results show that radiation damping is the dominant dephasing process for nanorods with 1/Leff <0.05 (diameters > 20 nm).
The value of the surface scattering parameter can be compared to the value determined for spherical gold particles from single particle absorption measurements by Berciaud and coworkers.41 In these experiments the linewidth was measured for particles with average diameters between 33 and 5 nm. Analysis of the data using Leff = 4R/3 gives A = 0.33, which is within experimental error of the value obtained from our measurements. The excellent agreement between the two measurements indicates that: (i) the formalism developed by Coronado and Schatz in ref. 79 gives a consistent way of accounting for electron–surface scattering in metal particles of different shapes. (ii) The details of the interface (i.e., the nature of the adsorbed stabilizing molecules) are not important in determining the timescale of electron–surface scattering in these two systems. It is not clear whether this is generally true for all absorbates—for example, for strongly bound species such as thiols—or for molecules with low lying anion states, that is, for species that give the classic adsorbate induced damping effect.83,84
The value of the radiation damping parameter determined in our measurements is somewhat larger than the value of κ = 4 ×10⁻⁷ fs−1 nm−3 measured for spherical gold particles by Sönnichsen and coworkers.20,22 This is most likely because the efficiency of radiation damping depends on the details of the particle shape. For example, it is well known that particles with sharp features have higher electric field enhancements at their surfaces (the “lightning rod” effect).10,27,85 The radius of curvature for a spherically capped nanorod with an aspect ratio of 3 is about two times smaller than that of a sphere with an equivalent volume. This enhances the electric field at the surface of the nanorod and, therefore, the coupling of the LSPR to the radiation field. On the other hand, the radiation damping parameter determined for the nanorods is somewhat smaller than the value of κ = (12 ± 2) × 10−7 fs−1 nm−3 recently measured for silver nanoprisms.35 This is most likely to be because the imaginary component of the dielectric function for silver is much less than that for gold in the visible to near-IR region, which makes silver particles more efficient scatterers of light.
5. Rayleigh scattering spectra of gold–silver nanoboxes
5.1 Correlated SEM/dark-field microscopy measurements
We have also used dark-field microscopy to examine the LSPR of hollow cubic shaped particles.34,46 These materials are synthesized by a galvanic replacement reaction between Au(III) and silver nanocubes.73–75 The particles are termed nanoboxes or nanocages depending on whether holes can be observed on the surface of the particle. Which type of particle is obtained depends on the extent of the replacement reaction.73–75 Both types of particles have been examined, although it is only possible to quantitatively analyze the linewidth data for the nanoboxes (vide infra).46 Our initial study of the LSPR of the nanoboxes was performed by simply drop-casting the particles on a glass slide at low concentration.34 The measured spectra were unusually broad: 3 to 4 times broader than the spectra of gold nanorods (see above). This raised concerns that we were actually detecting aggregates of particles. Thus, we decided to perform correlated Rayleigh scattering spectroscopy/SEM imaging experiments.46 The precise structural information from the SEM measurements allows us to obtain detailed information about electron–surface scattering and radiation damping in these materials.
Fig. 8 shows an optical image (left panel) and low-resolution SEM image (right panel) of an area of the registration substrate. The close correspondence between the patterns in the two images allows us to unambiguously correlate the structural and spectroscopic measurements. Fig. 9 shows high-resolution SEM images, elemental composition as determined by EDAX, and Rayleigh scattering spectra for the particles in Fig. 8. The LSPR of these particles are extremely broad, so much so that the bands extend beyond our instrument cut-off, which occurs at ca. 1.4 eV. This gives the spectra a distorted shape. Because of this, the linewidths are determined by analyzing the higher energy side of the resonance.
Fig. 8.

(A) Optical image of a particle pattern recorded by dark-field microscopy. (B) SEM image of the same particle pattern. Reprinted with permission from The Journal of Physical Chemistry C.46 Copyright 2007 American Chemical Society.
Fig. 9.

Secondary electron SEM images (shown as insets), elemental composition, and spectra for particles 1–4 shown in Fig. 8. The orientations of particles 1 and 2 ({100} facets in contact with the substrate) are different to those for particles 3 and 4 ({111} facets in contact with the substrate). Reprinted with permission from The Journal of Physical Chemistry C.46 Copyright 2007 American Chemical Society.
The SEM images in Fig. 9 show that these particles have a cuboctahedral shape, with holes on the {111} facets. We call this type of structure a “nanocage.” The SEM images allow us to measure the edge length of the particles, and the diameter of the holes. The particles in Fig. 9 have two possible orientations on the substrate: either {100} facets contacting the substrate (“type I nanocages”), or {111} facets contacting the substrate (“type II nanocages”). These two orientations give different shapes in the SEM images, as illustrated in Fig. 10. Particles 1 and 2 in Fig. 8 and 9 are type I nanocages, and particles 3 and 4 are type II nanocages.46 Whether a particle is type I or type II depends on the relative size of the {100} facets compared to the {111} facets.
Fig. 10.
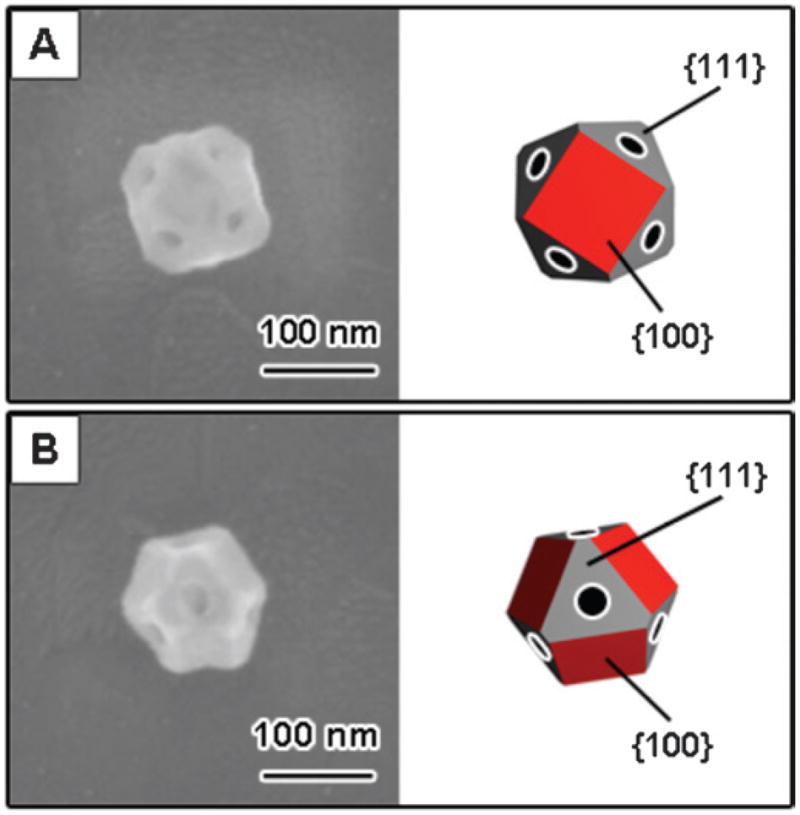
Different orientations of the nanocages on the substrate. (A) A nanocage with a {100} surface contacting the substrate (type I). (B) A nanocage with a {111} surface contacting the substrate (type II). Reprinted with permission from The Journal of Physical Chemistry C.46 Copyright 2007 American Chemical Society.
Fig. 11 shows a secondary electron SEM image, a back-scattering SEM image, EDAX analysis and Rayleigh scattering spectra of a hollow cubic particle. This particle has no visible holes, and has a much smaller degree of truncation compared to the particles in Fig. 9 and 10. We term this type of structure a “nanobox.” For the nanoboxes the back-scattering SEM images allow us to “see through” the particle and measure the wall thickness.46 Thus, in combination with the edge length from the secondary electron SEM image, we can determine the volume and the value of Leff for the particle. Also shown in Fig. 11 is a Lorentzian fit to the Rayleigh scattering spectra, which yields a resonance energy of 1.72 eV and a linewidth of 338 meV for this particle. Note that it is not possible to use back-scattering SEM to measure the wall thickness for the nanocages, due to the presence of both {111} and {100} facets on these particles. TEM analysis shows that the wall thickness of the nanocages samples is related to the edge length by w = 0.11L − 2.4.46
Fig. 11.

(A) Secondary electron SEM image of a Au–Ag nanobox. (B) Back-scattering SEM image of the nanobox. The wall thickness can be determined from this image. (C) EDAX data for the nanobox, giving a Au:Ag ratio of 1:2. (D) Optical scattering spectrum recorded using dark-field microscopy. The dashed line shows a Lorentzian fit to the data. Reprinted with permission from The Journal of Physical Chemistry C.46 Copyright 2007 American Chemical Society.
Fig. 12 shows a plot of the resonance energy (top) and line-width (bottom) versus edge length for all the nanoboxes and nanocages examined in the single particle/SEM experiments. The resonance energies occur between 1.50 eV and 1.80 eV, which is consistent with the plasmon band observed in the ensemble measurements. The nanocages have slightly red-shifted resonance energies (on average) compared to the nanoboxes. This is most likely because the nanocages have slightly larger edge length to wall thickness ratios.75 The average edge length to wall thickness ratio is L/w = 8 for the nanoboxes, compared to L/w = 11 for the nanocages. On the other hand, the linewidths are very similar for the nanocages and nanoboxes. The linewidths vary from 270 meV to 520 meV, which corresponds to dephasing times of 2–5 fs. This is comparable to the results reported by Sönnichsen et al. for 40 nm diameter solid gold nanoparticles,20,22 and to the gold nanoshells studied by Halas and coworkers.32 The average linewidths for the different samples are Γ̄ = 360 ± 52 meV for the nanoboxes, Γ̄ = 424 ± 67 meV for the type I nanocages, and Γ̄ = 376 ± 65 meV for the type II nanocages (errors equal the standard deviation). There does not appear to be a strong correlation between the linewidths and the edge lengths. In the following sections we concentrate on analysis of the data for the nanoboxes, as the symmetry of these materials makes them amenable to modeling via DDA simulations.
Fig. 12.

Resonance energy (Eres, top) and linewidth (Γhom, bottom) versus edge length for the nanoboxes and nanocages examined in the single nano-particle experiments. Triangles = nanoboxes; circles = type I nanocages; squares = type II nanocages. Reprinted with permission from The Journal of Physical Chemistry C.46 Copyright 2007 American Chemical Society.
5.2 Dephasing of the LSPR of Au–Ag nanoboxes
To analyze dephasing of the LSPR for the nanoboxes, the average linewidth from the experimental measurements was compared to the results of DDA calculations. In these calculations the particles were modeled as cubic boxes with an edge length of 100 nm and a wall thickness of 12 nm (this matches the average dimensions of the nanoboxes measured by SEM). The dielectric function of the particle was assumed to be a 1:2 average of the dielectric functions of Au and Ag,34 which were taken from ref. 50. The dielectric constant data from ref. 50 were preferred over the Johnson and Christy data (ref. 49) for particles containing Ag, because Sönnichsen and coworkers have shown that the Johnson and Christy data overestimates the linewidth for spherical silver particles.22 The substrate was modeled as a glass cylinder with a height of 100 nm and a diameter of 200 nm, and the effective path length of the electrons in the dielectric function of the particles was calculated by Leff = 2w.46 (This expression is derived from Leff = 4V/S in the limit L ≫ w.) The calculations yield extinction, absorption and scattering cross-sections, and the scattering cross-sections were fitted to a Lorentzian function to determine the linewidth.
The linewidths obtained from the DDA simulations are plotted against the value of the surface scattering parameter A in Fig. 13, for particles in air (n = 1) and water (n = 1.33). As expected, the linewidth increases linearly with the value of A. The experimental value of Γ̄ = 360 ± 52 meV for the particles in air can be explained by a surface scattering parameter of A = 3.0 ± 1.1. This is significantly larger than usual, probably because the expression Leff = 2w is not exact. The relationship Leff = 4V/S was derived for convex particles,79 so it is not clear whether this is appropriate for the nanoboxes. (The value of A given above can be refined if a more rigorous expression for Leff becomes available.)
Fig. 13.
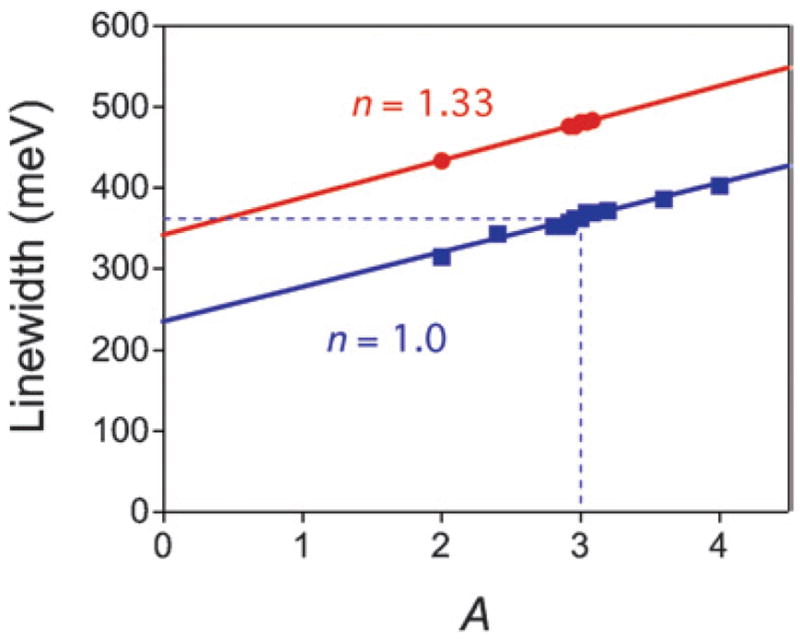
Linewidth (Γ) calculated via DDA simulations versus surface scattering parameter (A) for a Au–Ag nanobox in air (n = 1) and water (n = 1.33). The particle had an edge length of 100 nm and a wall thickness of 12 nm, and the substrate was modeled as a 200 nm diameter glass cylinder with a height of 100 nm. The points represent the simulation results and the lines show linear fits to the data.
The above analysis allows us to estimate the relative magnitudes of the bulk, electron–surface scattering and radiation damping contributions to the linewidth for the nanoboxes. Specifically, the intercept in Fig. 13 gives the sum of the bulk and radiation damping contributions, and the difference between the intercept and the total linewidth gives the electron–surface scattering component. Using Γbulk = 75 meV [the value calculated from eqn (1) using the data in ref. 50] we find Γbulk:Γsurf: Γrad = 0.21:0.44:0.35. Thus, both electron–surface scattering and radiation damping make significant, and almost equal, contributions to the linewidth. This is in contrast to the nano-rods, where particles that showed significant radiation damping had small electron–surface scattering components, and vice versa. The fact that electron–surface scattering and radiation damping contribute together to the linewidth, rather than one-or-the-other, is the primary reason why the nanoboxes have broader spectra than the nanorods. Note that Γbulk = 75 meV is the minimum value of the intrinsic linewidth of the nanoboxes. For complex shaped particles the actual intrinsic linewidth could be larger due to multiple resonances, which means that the above calculation gives an upper limit on the radiation damping contribution for the nanoboxes.
5.3 Dependence of the LSPR on the dielectric constant of the environment
The optical properties of metal nanoparticles depend strongly on the local environment, which has led to applications in molecular sensing.55,56 We have investigated the sensitivity of the LSPR for the nanoboxes to the dielectric environment by measuring spectra in air (n = 1.0) and water (n = 1.33). Fig. 14 (A) shows an experiment where we recorded spectra for a particle in air, then in water, and finally in air again after allowing the sample to dry. The LSPR shows a large red-shift in the water environment, and essentially returns to its original position and shape after drying. This reversibility indicates that there are no major structural changes in the particle during the experiment.26,27
Fig. 14.

(A) Rayleigh scattering spectra of a nanobox in air (air 1), in a water environment, and in air again (air 2) after drying the substrate. The resonance energies changed from 1.72 eV → 1.58 eV → 1.73 eV, and the linewidths from 324 meV → 401 meV → 359 meV in the order air 1 → water → air 2. The inset shows an SEM image of the nanobox. (B) Linewidth versus resonance energy for nanoboxes in air (squares) and in water (circles). The inset shows the change in linewidth (Δ Γ) plotted against the magnitude of the red-shift of the LSPR (Δ E). Reprinted with permission from The Journal of Physical Chemistry C.46 Copyright 2007 American Chemical Society.
Fig. 14 (B) shows a plot of the linewidths versus resonance energies for the nanoboxes in air and water. The data shows that adding water produces a large red-shift in the LSPR, with an average value of |Δ Eres| = 120 ± 20 meV.46 This gives a dielectric sensitivity55,56 of m = |ΔEres|/Δn = 360 ± 60 meV RIU−1 (RIU = Refractive Index Unit) for these particles, which is consistent with recent studies of the dielectric sensitivity of the dipole resonance in single silver triangles.27
An important factor in evaluating the potential use of metal nanoparticles for sensing applications is the figure-of-merit (FOM) introduced by van Duyne and coworkers, which is the dielectric sensitivity divided by the linewidth: FOM = m(meV RIU−1)/Γ(meV).27,56 Materials with high FOMs allow accurate measurement of the change in dielectric constant of the environment. The FOMs for the nanoboxes fall in the range of 0.8 to 1.4, with an average value of 1.1 ± 0.2.46 These values are 2–3 times worse than the FOMs for the dipole resonances of silver triangles,27 and this is almost entirely due to the broader linewidths of the LSPR for the nanoboxes compared to the triangles.
The data in Fig. 14 (B) also shows that there is a significant increase in the linewidth of the LSPR when the dielectric constant of the environment increases. The average linewidth for the particles changes from 360 ± 52 meV for air, to 428 ± 48 meV for water: an increase of approximately 20%. This change in line-width is attributed to an increase in radiation damping. The inset of Fig. 14 (B) gives a plot of the change in linewidth (ΔΓ) versus the magnitude of the red-shift of the LSPR for all the nanoboxes examined. There does not appear to be any correlation between the magnitude of the red-shift and the increase in linewidth. An increase in linewidth with increasing dielectric constant of the environment has not been reported in previous single particle solvent dependence studies, presumably because the particles were too small to display significant radiation damping effects.26,27
This explanation for the increase in linewidth can be easily tested through DDA calculations, by comparing simulations in air (n = 1) and water (n = 1.33). The results in Fig. 13 show that for a given value of A, the linewidth increases by ~40% when the particles are immersed in water, in reasonable agreement with our experimental results. This confirms our assertion that radiation damping is the origin of this effect. A possible explanation for the difference between the calculated and experimentally measured increases in linewidth is that water does not fill the interior of the particles in the solvent dependence experiments. However, DDA calculations show that particles with air inside and water outside actually have a larger linewidth than the all air or all water cases. Thus, incomplete filling of the interior cannot explain the discrepancy between theory and experiment. An alternative explanation is that there is a change in the surface scattering parameter for nanoboxes in water compared to air. Comparing the average linewidth for the particles in water (428 ± 48 meV) to the calculated linewidths in Fig. 13 gives A = 1.9 ± 1.0, somewhat lower than the value for the particles in air.
6. Summary and conclusions
The LSPR of metal nanoparticles is responsible for a variety of surface-enhanced spectroscopies and molecular sensing schemes. Understanding how this resonance changes with the size and shape of the particles is an important subject, and one that can only be effectively tackled by single particle spectroscopy. For particles with relatively large volumes, Rayleigh scattering spectra of single particles can be easily recorded with a dark-field microscope.2,3 This has led to a number of studies on how the position of the LSPR depends on size and shape.21,23–29 There have been fewer studies of the size and shape dependence of the linewidth, mainly because it is difficult to interrogate small particles (which show electron–surface scattering effects) by dark-field microscopy. In this paper we describe results from our recent experiments on gold nanorods33 and gold–silver nanoboxes and nanocages,34,46 where dark-field microscopy has been used to study electron–surface scattering and radiation damping. These materials can have small diameters/wall thicknesses, which allows us to study electron–surface scattering, but are still large enough to be detected in Rayleigh scattering experiments.
The results of our measurements show that for the nanoboxes and nanocages, both electron–surface scattering and radiation damping are important at all sizes. Thus, the LSPRs of these materials are extremely broad, with linewidths of the order 300 meV to 500 meV. This corresponds to dephasing times of 2–5 fs.34,46 On the other hand, for the nanorods these two effects occur in different size regimes: thin rods (widths <10 nm) are subject to electron–surface scattering, and fat rods (widths >20 nm) are subject to radiation damping.33 Rods with dimensions in between these limits have narrow resonances, approaching the theoretical minimum determined by the bulk damping in gold.20,30,34 Analysis of the data for the nanorods gave a surface scattering parameter of A = 0.30 ± 0.03, which is in excellent agreement with the results of measurements for spherical gold particles.41
The sensitivity of the LSPR of the nanoboxes to the dielectric constant of the environment has also been investigated. The position of the resonance has a similar dielectric sensitivity compared to other metal nanoparticle systems. However, a significant increase in the linewidth was observed for the nanoboxes in water compared to air. This has been attributed to increased radiation damping in the environment with a higher dielectric constant. This has not been reported previously, presumably because the nanoboxes have a larger radiation damping contribution than the other systems that have been studied. The measured increase in linewidth is in reasonable agreement with the results of DDA calculations.
Acknowledgments
G. H. acknowledges the support of the US National Science Foundation through Grant CHE06-47444. Y. X. has been supported in part by a Director’s Pioneer Award from NIH (5DP1OD000798), a grant from NSF (DMR-0451788), a DARPA-DURINT subcontract from Harvard University, and a fellowship from the David and Lucile Packard Foundation. P. M. wishes to thank the Australian Research Council for support through DP Grant 0451651 and FF grant 0561486, and also acknowledge Daniel Gomez for his help on the instrumentation. S. Z. was supported by the National Aeronautics and Space Administration through the University of Central Florida’s Florida Space Grant Consortium.
Biographies
Shengli Zou received his BS in Chemistry from Shandong University in China in 1993 and a PhD from Emory University in 2003. He was a postdoctoral researcher at Northwestern University, and joined the University of Central Florida as an Assistant Professor in Chemistry in 2006. His research interests focus on the surface plasmon of metal nanoparticles and their sensing and waveguide applications.
Paul Mulvaney is an ARC Federation Fellow and Professor of Chemistry in the School of Chemistry and the Bio21 Institute at the University of Melbourne. His current interests include the optical properties of single quantum dots, surface plasmon spectroscopy of single metal nanocrystals, nanocrystal based electronics and surface forces.
Younan Xia is the James McKelvey Professor for Advanced Materials in the Department of Biomedical Engineering at Washington University in St Louis. He received a PhD in Physical Chemistry from Harvard University in 1996. Amongst other honours, he received an NIH Director’s Pioneer Award in 2006 to develop new tools for studying complex biological systems by harnessing the power of nanomaterials.
Gregory Hartland received a BSc (Hons) from the University of Melbourne in 1984 and a PhD from the UCLA in 1991. After postdoctoral studies at the University of Pennsylvania, he joined the Department of Chemistry and Biochemistry at the University of Notre Dame in 1994. His research interests are using time-resolved and steady state optical spectroscopy to study single metal nanoparticles.
References
- 1.Zsigmondy R. Nobel Lectures, Chemistry 1922–1941. Elsevier Publishing Company; Amsterdam: 1966. [Google Scholar]
- 2.Sönnichsen C, Geier S, Hecker NE, Von Plessen G, Feldmann J, Ditlbacher H, Lamprecht B, Krenn JR, Aussenegg FR, Chan VZH, Spatz JP, Moller M. Appl Phys Lett. 2000;77:2949. [Google Scholar]
- 3.Schultz S, Smith DR, Mock JJ, Schultz DA. Proc Natl Acad Sci U S A. 2000;97:996. doi: 10.1073/pnas.97.3.996. [DOI] [PMC free article] [PubMed] [Google Scholar]
- 4.Kreibig U, Vollmer M. Optical Properties of Metal Clusters. Springer; Berlin: 1995. [Google Scholar]
- 5.van de Hulst HC. Light Scattering by Small Particles. Dover Publications; New York: 1981. [Google Scholar]
- 6.Bohren CF, Huffman DR. Absorption and Scattering of Light by Small Particles. Wiley-Interscience; New York: 1983. [Google Scholar]
- 7.Schultz DA. Curr Opin Biotechnol. 2003;14:13. doi: 10.1016/s0958-1669(02)00015-0. [DOI] [PubMed] [Google Scholar]
- 8.Mulvaney P. Langmuir. 1996;12:788. [Google Scholar]
- 9.Link S, El-Sayed MA. J Phys Chem B. 1999;103:8410. [Google Scholar]
- 10.Kelly KL, Coronado E, Zhao LL, Schatz GC. J Phys Chem B. 2003;107:668. [Google Scholar]
- 11.Noguez C. J Phys Chem C. 2007;111:3806. [Google Scholar]
- 12.Wiley BJ, Im SH, Li ZY, McLellan J, Siekkinen A, Xia YN. J Phys Chem B. 2006;110:15666. doi: 10.1021/jp0608628. [DOI] [PubMed] [Google Scholar]
- 13.Fragstein CV, Römer H. Z Phys. 1958;151:54. [Google Scholar]
- 14.Hampe W. Z Phys. 1958;152:476. [Google Scholar]
- 15.Doyle WT. Phys Rev. 1958;111:1067. [Google Scholar]
- 16.(a) Doremus RH. J Chem Phys. 1964;40:2389. [Google Scholar]; (b) Doremus RH. J Chem Phys. 1965;42:414. [Google Scholar]
- 17.Bawendi MG, Steigerwald ML, Brus LE. Annu Rev Phys Chem. 1990;41:477. [Google Scholar]
- 18.Murray CB, Norris DJ, Bawendi MG. J Am Chem Soc. 1993;115:8706. [Google Scholar]
- 19.Bruchez M, Moronne M, Gin P, Weiss S, Alivisatos AP. Science. 1998;281:2013. doi: 10.1126/science.281.5385.2013. [DOI] [PubMed] [Google Scholar]
- 20.Sönnichsen C, Franzl T, Wilk T, Von Plessen G, Feldmann J, Wilson O, Mulvaney P. Phys Rev Lett. 2002;88:077402. doi: 10.1103/PhysRevLett.88.077402. [DOI] [PubMed] [Google Scholar]
- 21.Mock JJ, Barbic M, Smith DR, Schultz DA, Schultz S. J Chem Phys. 2002;116:6755. [Google Scholar]
- 22.Sönnichsen C, Franzl T, Wilk T, Von Plessen G, Feldmann J. New J Phys. 2002;4:93. doi: 10.1103/PhysRevLett.88.077402. [DOI] [PubMed] [Google Scholar]
- 23.Kuwata H, Tamaru H, Esumi K, Miyano K. Appl Phys Lett. 2003;83:4625. [Google Scholar]
- 24.Raschke G, Kowarik S, Franzl T, Sönnichsen C, Klar TA, Feldmann J, Nichtl A, Kurzinger K. Nano Lett. 2003;3:935. [Google Scholar]
- 25.McFarland AD, Van Duyne RP. Nano Lett. 2003;3:1057. [Google Scholar]
- 26.Sherry LJ, Chang SH, Schatz GC, Van Duyne RP, Wiley BJ, Xia YN. Nano Lett. 2005;5:2034. doi: 10.1021/nl0515753. [DOI] [PubMed] [Google Scholar]
- 27.Sherry LJ, Jin RC, Mirkin CA, Schatz GC, Van Duyne RP. Nano Lett. 2006;6:2060. doi: 10.1021/nl061286u. [DOI] [PubMed] [Google Scholar]
- 28.Nehl CL, Liao HW, Hafner JH. Nano Lett. 2006;6:683. doi: 10.1021/nl052409y. [DOI] [PubMed] [Google Scholar]
- 29.Wiley BJ, Chen YC, McLellan JM, Xiong YJ, Li ZY, Ginger D, Xia YN. Nano Lett. 2007;7:1032. doi: 10.1021/nl070214f. [DOI] [PubMed] [Google Scholar]
- 30.Liu MZ, Guyot-Sionnest P. J Phys Chem B. 2004;108:5882. [Google Scholar]
- 31.Wang X, Zhang ZY, Hartland GV. J Phys Chem B. 2005;109:20324. doi: 10.1021/jp054233u. [DOI] [PubMed] [Google Scholar]
- 32.Nehl CL, Grady NK, Goodrich GP, Tam F, Halas NJ, Hafner JH. Nano Lett. 2004;4:2355. [Google Scholar]
- 33.Novo C, Gomez D, Perez-Juste J, Zhang ZY, Petrova H, Reismann M, Mulvaney P, Hartland GV. Phys Chem Chem Phys. 2006;8:3540. doi: 10.1039/b604856k. [DOI] [PubMed] [Google Scholar]
- 34.Hu M, Petrova H, Sekkinen AR, Chen J, McLellan JM, Li ZY, Marquez M, Li X, Xia YN, Hartland GV. J Phys Chem B. 2006;110:19923. doi: 10.1021/jp0621068. [DOI] [PubMed] [Google Scholar]
- 35.Munechika K, Smith JM, Chen Y, Ginger DS. J Phys Chem C. 2007;111:18906. [Google Scholar]
- 36.Kreibig U. J Phys F: Met Phys. 1974;4:999. [Google Scholar]
- 37.Kraus WA, Schatz GC. J Chem Phys. 1983;79:6130. [Google Scholar]
- 38.Boyer D, Tamarat P, Maali A, Lounis B, Orrit M. Science. 2002;297:1160. doi: 10.1126/science.1073765. [DOI] [PubMed] [Google Scholar]
- 39.Arbouet A, Christofilos D, Del Fatti N, Vallee F, Huntzinger JR, Arnaud L, Billaud P, Broyer M. Phys Rev Lett. 2004;93:127401. doi: 10.1103/PhysRevLett.93.127401. [DOI] [PubMed] [Google Scholar]
- 40.Lindfors K, Kalkbrenner T, Stoller P, Sandoghdar V. Phys Rev Lett. 2004;93:037401. doi: 10.1103/PhysRevLett.93.037401. [DOI] [PubMed] [Google Scholar]
- 41.Berciaud S, Cognet L, Tamarat P, Lounis B. Nano Lett. 2005;5:515. doi: 10.1021/nl050062t. [DOI] [PubMed] [Google Scholar]
- 42.van Dijk MA, Tchebotareva AL, Orrit M, Lippitz M, Berciaud S, Lasne D, Cognet L, Lounis B. Phys Chem Chem Phys. 2006;8:3486. doi: 10.1039/b606090k. [DOI] [PubMed] [Google Scholar]
- 43.Berciaud S, Lasne D, Blab GA, Cognet L, Lounis B. Phys Rev B. 2006;73:045424. [Google Scholar]
- 44.Perez-Juste J, Pastoriza-Santos I, Liz-Marzan LM, Mulvaney P. Coord Chem Rev. 2005;249:1870. [Google Scholar]
- 45.Hao F, Nehl CL, Hafner JH, Nordlander P. Nano Lett. 2007;7:729. doi: 10.1021/nl062969c. [DOI] [PubMed] [Google Scholar]
- 46.Hu M, Chen J, Marquez M, Xia Y, Hartland GV. J Phys Chem C. 2007;111:12558. doi: 10.1021/jp073691v. [DOI] [PMC free article] [PubMed] [Google Scholar]
- 47.Weissleder R. Nat Biotechnol. 2001;19:316. doi: 10.1038/86684. [DOI] [PubMed] [Google Scholar]
- 48.(a) Hirsch LR, Stafford RJ, Bankson JA, Sershen SR, Rivera B, Price RE, Hazle JD, Halas NJ, West JL. Proc Natl Acad Sci U S A. 2003;100:13549. doi: 10.1073/pnas.2232479100. [DOI] [PMC free article] [PubMed] [Google Scholar]; (b) West JL, Halas NJ. Annu Rev Biomed Eng. 2003;5:285. doi: 10.1146/annurev.bioeng.5.011303.120723. [DOI] [PubMed] [Google Scholar]
- 49.Johnson PB, Christy RW. Phys Rev B. 1972;6:4370. [Google Scholar]
- 50.Palik ED, editor. Handbook of Optical Constants of Solids. New York: Academic Press; 1985. [Google Scholar]
- 51.Quinten M. Z Phys B: Condens Matter. 1996;101:211. [Google Scholar]
- 52.Alvarez MM, Khoury JT, Schaaff TG, Shafigullin MN, Vezmar I, Whetten RL. J Phys Chem B. 1997;101:3706. [Google Scholar]
- 53.Wokaun A, Gordon JP, Liao PF. Phys Rev Lett. 1982;48:957. [Google Scholar]
- 54.Melikyan A, Minassian H. Appl Phys B: Lasers Opt. 2004;78:453. [Google Scholar]
- 55.Haes AJ, Van Duyne RP. Anal Bioanal Chem. 2004;379:920. doi: 10.1007/s00216-004-2708-9. [DOI] [PubMed] [Google Scholar]
- 56.Willets KA, Van Duyne RP. Annu Rev Phys Chem. 2007;58:267. doi: 10.1146/annurev.physchem.58.032806.104607. [DOI] [PubMed] [Google Scholar]
- 57.Nie SM, Emery SR. Science. 1997;275:1102. doi: 10.1126/science.275.5303.1102. [DOI] [PubMed] [Google Scholar]
- 58.Kneipp K, Wang Y, Kneipp H, Perelman LT, Itzkan I, Dasari R, Feld MS. Phys Rev Lett. 1997;78:1667. doi: 10.1103/PhysRevLett.76.2444. [DOI] [PubMed] [Google Scholar]
- 59.Campion A, Kambhampati P. Chem Soc Rev. 1998;27:241. [Google Scholar]
- 60.Kneipp K, Kneipp H, Itzkan I, Dasari RR, Feld MS. Chem Rev. 1999;99:2957. doi: 10.1021/cr980133r. [DOI] [PubMed] [Google Scholar]
- 61.Michaels AM, Nirmal M, Brus LE. J Am Chem Soc. 1999;121:9932. [Google Scholar]
- 62.Moskovits M. J Raman Spectrosc. 2005;36:485. [Google Scholar]
- 63.Lakowicz JR. Anal Biochem. 2005;337:171. doi: 10.1016/j.ab.2004.11.026. [DOI] [PMC free article] [PubMed] [Google Scholar]
- 64.Dulkeith E, Ringler M, Klar TA, Feldmann J, Javier AM, Parak WJ. Nano Lett. 2005;5:585. doi: 10.1021/nl0480969. [DOI] [PubMed] [Google Scholar]
- 65.Jensen TR, van Duyne RP, Johnson SA, Maroni VA. Appl Spectrosc. 2000;54:371. [Google Scholar]
- 66.Williams SM, Stafford AD, Rodriguez KR, Rogers TM, Coe JV. J Phys Chem B. 2003;107:11871. [Google Scholar]
- 67.Rigneault H, Capoulade J, Dintinger J, Wenger J, Bonod N, Popov E, Ebbesen TW, Lenne PF. Phys Rev Lett. 2005;95:117401. doi: 10.1103/PhysRevLett.95.117401. [DOI] [PubMed] [Google Scholar]
- 68.Murphy CJ, Jana NR. Adv Mater. 2002;14:80. [Google Scholar]
- 69.Nikoobakht B, El-Sayed MA. Chem Mater. 2003;15:1957. [Google Scholar]
- 70.Perez-Juste J, Liz-Marzan L, Carnie S, Chan DYC, Mulvaney P. Adv Funct Mater. 2004;14:571. [Google Scholar]
- 71.Kim F, Song JH, Yang PD. J Am Chem Soc. 2002;124:14316. doi: 10.1021/ja028110o. [DOI] [PubMed] [Google Scholar]
- 72.Petrova H, Perez-Juste J, Zhang Z, Zhang J, Kosel T, Hartland GV. J Mater Chem. 2006;16:3957. [Google Scholar]
- 73.Sun YG, Xia Y. Science. 2002;298:2176. doi: 10.1126/science.1077229. [DOI] [PubMed] [Google Scholar]
- 74.Sun Y, Xia Y. J Am Chem Soc. 2004;126:3892. doi: 10.1021/ja039734c. [DOI] [PubMed] [Google Scholar]
- 75.Chen JY, Wiley B, Li ZY, Campbell D, Saeki F, Cang H, Au L, Lee J, Li XD, Xia Y. Adv Mater. 2005;17:2255. [Google Scholar]
- 76.Novo C, Funston AM, Pastoriza-Santos I, Liz-Marzan LM, Mulvaney P. Angew Chem, Int Ed. 2007;46:3517. doi: 10.1002/anie.200700033. [DOI] [PubMed] [Google Scholar]
- 77.Kreibig U. Appl Phys. 1976;10:255. [Google Scholar]
- 78.Ashcroft NW, Mermin ND. Solid State Physics. Holt, Rinehart and Winston; New York: 1976. [Google Scholar]
- 79.Coronado EA, Schatz GC. J Chem Phys. 2003;119:3926. [Google Scholar]
- 80.Draine BT, Flatau PJ. J Opt Soc Am A. 1994;11:1491. [Google Scholar]
- 81.Link S, El-Sayed MA, Mohamed MB. J Phys Chem B. 2005;109:10531. [Google Scholar]
- 82.Note that these values are slightly different to those given in ref. 33.
- 83.Hovel H, Fritz S, Hilger A, Kreibig U, Vollmer M. Phys Rev B. 1993;48:18178. doi: 10.1103/physrevb.48.18178. [DOI] [PubMed] [Google Scholar]
- 84.Pinchuk A, Kreibig U. New J Phys. 2003;5:151. [Google Scholar]
- 85.Jackson JD. Classical Electrodynamics. John Wiley And Sons; New York: 1962. [Google Scholar]