Abstract
Blood plasma proteins with molecular weights greater than approximately 30 kDa are refractory to comprehensive, high-throughput qualitative characterization of microheterogeneity across human populations. Analytical techniques for obtaining high mass resolution for targeted, intact protein characterization and, separately, high sample throughput exist, but efficient means of coupling these assay characteristics remain rather limited. This article discusses the impetus for analyzing intact proteins in a targeted manner across populations and describes the methodology required to couple mass spectrometric immunoassay with electrospray ionization mass spectrometry for the purpose of qualitatively characterizing a prototypical large plasma protein, vitamin D binding protein, across populations.
Keywords: mass spectrometric immunoassay, vitamin D binding protein, microheterogeneity, electrospray ionization
One of the major goals of proteomic research is to discover and ultimately validate new protein biomarkers of disease. Arguments abound regarding the best forms, techniques, and tools of proteomics to use to accomplish this goal. The U.S. Food and Drug Administration defines a biomarker as, “A characteristic that is objectively measured and evaluated as an indicator of normal biologic processes, pathogenic processes, or pharmacologic responses to a therapeutic intervention” (emphasis supplied). Considering this definition, it is critical to understand that a (protein) biomarker of disease is not just “a protein”—it is something about a protein—generally either a change in concentration, amino acid sequence, and/or qualitative/quantitative changes in posttranslational modification (collectively referred to as microheterogeneity). This suggests the hypothesis that proteins represent potential biomarker platforms and that all three of the above biomarker qualifiers must ultimately be considered in a comprehensive analytical manner for all candidate proteins.
This understanding, in turn, dictates a particular analytical approach to biomarker development—namely, that targeted analysis of intact proteins by MS across populations of samples needs to be done to allow efficient operation without (what amounts to) analytical blindspots to at least two of the three aforementioned categories of protein biomarkers.
Why Employ Mass Spectrometry as an Analytical Platform?
Coupled with proper sample preparation, mass spectrometers excel at providing highly detailed information towards whole-protein and peptide characterization. Generation of valuable biological data via detailed characterization of proteins (as distinguished from identification via surrogate peptides) was a major goal envisioned for modern mass spectrometers shortly after the advent of electrospray and matrix-assisted-laser desorption/ionization (MALDI) techniques.1,2 With regard to the three major categories of protein biomarkers described above, only MS possesses the capability to track all three categories simultaneously (and nearly comprehensively) at a degree of simplicity and sensitivity compatible with common experimental constraints.
Why Targeted Analysis of Proteins?
Mass spectra do not come with labels; thus mere acquisition of vast quantities of data does not necessarily constitute a value-added proposition. In fact, the presence of unidentified peaks in a spectrum that do not arise from any specific protein(s) under consideration (as if the spectrum was being interpreted manually), or could stem from multiple proteins under consideration, generally only serve to confound interpretation of the spectrum—especially considering the vast potential for protein microheterogeneity.3–11 Carefully designed sample preparation steps, therefore, are crucial to defining how mass spectra can be interpreted and, therefore, their overall information content. (Creative sample preparation often leverages a surprisingly high degree of information toward determination of protein structure,12–16 regardless of the number of mass spectral peaks present.) Considering the potential for microheterogeneity, isolation of individual (intact) proteins (by affinity capture, chromatography, or otherwise) must be done prior to analysis by MS to maximize limits of detection out of complex biological matrices and thus maintain high sensitivity towards all major categories of protein biomarkers: Regardless of the degree of sophisticated data processing applied, great collections of raw, uninterpretable mass spectral peaks cannot, ultimately, effectively serve as meaningful biomarkers.
Why Analysis of Intact Proteins?
The precise molecular weights of full-length protein molecules contain both genetic and posttranslational modification information—i.e., both genotypic and protein phenotypic information. As a method, detection and identification of proteins via peptide surrogates lacks this comprehensive facet—allowing microheterogeneities to easily avoid detection. Analysis of intact proteins allows for examination of only a small fraction of the entire “proteome” within a limited time frame, but it yields a comprehensive single-protein analysis; we are left with a clear indication of where we ought to look next. Mass spectral analysis of intact proteins, while disadvantaged in its lack of ability to provide residue-specific information on microheterogeneities in a single experiment, does naturally provide full sequence coverage all the time with constant, near-comprehensive analysis of microheterogeneity and the option of quantitative analysis if desired,10,17–21 fulfilling the analytical need to track all three major categories of protein biomarker.
Why Analysis of Proteins Across Populations?
Different forms of what are considered the same protein oftentimes exist not only within a single person, but with even greater diversity across populations.7 Such variations may well serve as biomarkers if they delineate differences between healthy and diseased populations. A statistically meaningful assessment of these variations within the appropriate populations can only be gained by analyzing many samples, particularly in cases such as the one demonstrated below wherein more than 10 different forms of vitamin D binding protein (DBP) are found within the “normal” population.
Stemming from work on intact protein characterization and quantitation, mass spectrometric immunoassay (MSIA) was developed over a decade ago for the purpose of facilitating high-throughput studies of targeted, intact proteins across large numbers of samples.10,17–21 Since that time, MSIA has been used to successfully identify and verify new protein biomarkers of disease.22 In its original incarnation, MSIA was coupled to MALDI time-of-flight mass spectrometry (MALDI-TOF-MS) as an endpoint analytical technique. Without special efforts, however, MALDI-TOF-MS lacks the capacity to resolve smaller, biologically meaningful mass shifts at m/z ratios greater than about 30,000. This limitation begins to reintroduce analytical blindspots into a biomarker discovery program that is based on the analysis of intact proteins.
By increasing the charge state of intact proteins, ESI-MS, particularly when coupled with mass analyzers with high resolving power, promises to at least begin to overcome the aforementioned resolution limitation of MALDI-TOF-MS. Thus, to begin to enable routine discovery of unique qualitative features of larger proteins as biomarkers of disease, we describe here methodology for coupling MSIA with electrospray ionization MS using vitamin D binding protein (DBP) as a prototypical, high-molecular-weight plasma protein that happens to contain numerous qualitative differences not only between individuals but between allele products within a single person as well.
Materials and Methods
Materials
Polyclonal rabbit anti-human DBP (GC-globulin) antibodies were obtained from DAKO (Cat. No. A0021, Carpinteria, CA). Premixed MES-buffered saline powder packets were from Pierce (Rockford, IL). Isolation of DBP from plasma was carried out with proprietary MSIA pipette tips (MSIA-Tips) from Intrinsic Bioprobes (Tempe, AZ) derivatized with the DBP antibodies via 1,1′-carbonyldiimidazole (CDI) chemistry as described below. EDTA plasma samples were purchased from ProMedDx (Norton, MA). Protein Captrap catridges for liquid chromatography MS (LC/MS) were obtained from Michrom Bioresources (Auburn, CA). Premade 10-mM Hepes-buffered saline (HBS-N) and 10-mM HBS-N with 3 mM EDTA and 0.005% (v/v) polysorbate 20 (HBS-EP) were purchased from Biacore (Piscataway, NJ). All other chemicals were obtained from Sigma-Aldrich (St. Louis, MO).
MSIA-Tip Preparation
As previously described,11 Intrinsic Bioprobes loaded soda lime glass beads into stainless steel annealing molds and baked them into solid yet porous frits. Next, the frits were acid conditioned then treated for 12 h with 10% amino-propyltriethoxysilane. The resulting amine-functionalized frits were then equilibrated in a phosphate buffer followed by exposure to 15 kDa carboxymethyldextran and CDI followed by a final rinse in phosphate buffer to provide a highly functionalized carboxylic acid surface. Intrinsic Bioprobes provided the MSIA-Tips at this stage. Subsequently, the MSIA-Tips were rinsed thoroughly with 0.2 M hydrochloric acid to create free acid carboxyl groups (by eliminating any sodium/potassium salts). The HCl rinse was followed by an acetone rinse and drying under vacuum. MSIA-Tips were then activated with CDI23 by exposing them to a 50 g/L solution of CDI in 1-methyl-2-pyrrolidone (NMP) by continuously pipetting the solution up and down (150 μL/well; 50 μL vol; 450 cycles, or approximately 45 min) with the aid of a Beckman Multimek 96-channel automated pipettor robot. (No special precautions were taken to ensure the dryness of the NMP.) Following exposure to CDI, MSIA-Tips were blotted to remove excess NMP then rinsed twice with NMP (400 μL/well; 100 μL vol; 10 cycles), with blotting after each rinse, to eliminate excess CDI. While still slightly wet with NMP, MSIA-Tips were then immediately exposed to anti-human DBP antibodies in MES buffered saline, pH 4.7 (0.05 g/L; 150 μL/well; 50 μL volume; 50 cycles; 15 repetitions/loops, approximately 50 min total exposure time) to facilitate their covalent attachment to the MSIA-Tips. Finally, MSIA-Tips were rinsed with 1 M ethanolamine, pH 8.5 (400 μL/well; 100 μL volume; 50 cycles) to cap any remaining CDI-preactivated sites, followed by two rinses with HBS-N (400 μL/well; 100 μL volume; 50 cycles). MSIA-Tips were stored in HBS-N at 4°C and used within 3 months of preparation.
Sample Preparation
When designing experiments that involve affinity extraction, it is important to keep in mind that immobilized affinants (antibodies, binding partners, etc.) do not function by “mopping up” everything presented to them in solution, given enough time. Binding to an immobilized affinity partner is governed by the equilibrium proportion:
where TipAntamt is the amount of protein bound to the affinity tip or sorbent, Tipamt is the molar quantity of binding sites available on the tip or sorbent, [Ant] is the molar concentration of antigen in solution, and Kd is the equilibrium binding dissociation constant. Thus, to maximize extraction yield, efforts should be made to use immobilized binding frits or sorbents with high capacity relative to analytical detection limits and antibodies with the lowest available Kd values should be used. Finally, the concentration of antigen in solution should be kept as high as possible.
For the experiments described here, 125 μL of EDTA plasma was mixed with 1.25 μL of 10% Tween 20 then diluted to 250 μL total volume with HBS. Samples were frozen at −80°C until use. Some plasma samples (as described) were preincubated with calcium by adding a small volume of 1 M CaCl2 (diluted in HBS) to approximately 125 μL plasma to obtain the desired Ca2+ concentration, followed by incubation at 41°C for 2–3 h, then 2-fold dilution with HBS. With the aid of a Beckman Multimek 96-channel automated pipettor robot, antibody prelinked MSIA-Tips were prerinsed (400 μL/well; 150 μL aspirate and dispense cycles; 10 cycles) with HBS then used to extract DBP from individual plasma samples at room temperature (250 μL/well; 85 μL aspirate and dispense cycles; 250 cycles, or about 20 min of exposure time). MSIA-Tips were then ejected from the robot and allowed to sit in their respective plasma samples at room temperature until they were individually washed (by drawing from a fresh reservoir of liquid and dispensing to waste) and eluted as follows: Five cycles of 150 μL of HBS-N, five cycles of 150 μL distilled water, five cycles of 150 μL of 2 M ammonium acetate/acetonitrile (3:1 v/v), and ten cycles of 150 μL distilled water. Elution was accomplished by air-drying the pipette frits then drawing 5 μL of a mixture of 100% formic acid/acetonitrile/distilled water (9/5/1 v/v/v), mixing over the pipette affinity capture frit for 20–30 sec, and dispensing into a 96-conical well polypropylene autosampler tray. Frits were then washed with an additional 5 μL distilled water which was used to dilute the eluted sample. Five microliters was injected into the LC-TOF-MS within 10 min of elution.
Liquid Chromatography/Mass Spectrometry
A trap-and-elute form of sample concentration/solvent exchange rather than traditional LC was used for these analyses. Five-microliter samples were injected by a Spark Holland Endurance autosampler in microliter pick-up mode and loaded by an Eksigent nanoLC*1D at 10 μL/min (90/10 water/acetonitrile containing 0.1% formic acid, solvent A) onto a protein captrap (Microm Bioresources, Auburn, CA) configured for unidirectional flow on a 6-port divert valve. After 2 min, the divert valve position was automatically toggled and flow over the cartridge changed to 1 μL/min solvent A (running directly to the ESI inlet) which was immediately ramped over 8 min to 10/90 water/acetonitrile containing 0.1% formic acid. By 10.2 min the run was completed and the flow back to 100% solvent A.
The bulk of DBP eluted between 5.5 and 7.5 min into a Bruker MicrOTOF-Q (QTOF) mass spectrometer operating in positive ion, TOF-only mode, acquiring spectra in the m/z range of 50 to 3000. ESI settings for the Agilent G1385A capillary nebulizer ion source were as follows: End Plate Offset −500 V, Capillary −4500 V, Nebulizer nitrogen 2 Bar, Dry Gas nitrogen 3.0 L/min at 225°C. Data were acquired in profile mode at a digitizer sampling rate of 2 GHz. Spectra rate control was by summation at 1 Hz.
Data Analysis
Approximately 1.5 min of recorded spectra were averaged across the chromatographic peak apex of DBP elution. The ESI charge-state envelope was deconvoluted with Bruker DataAnalysis v3.4 software to a mass range of 1000 Da on either side of any identified peak.
RESULTS
Microheterogeneity of DBP Revealed by ESI-TOF-MS
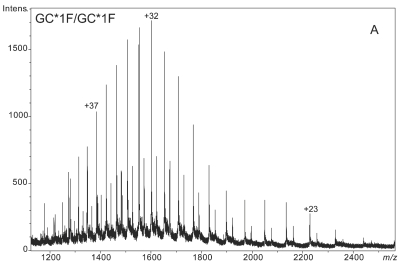
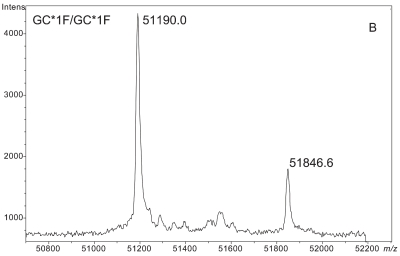
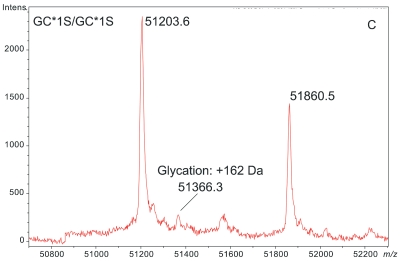
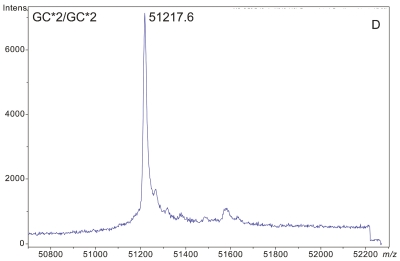
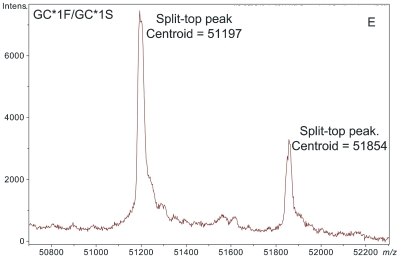
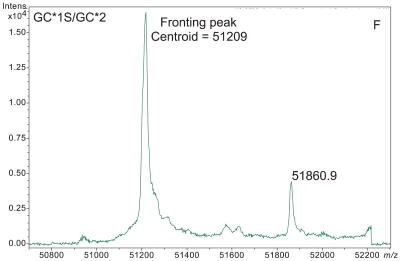
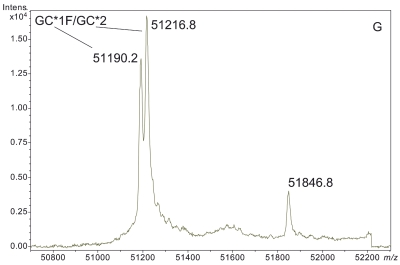
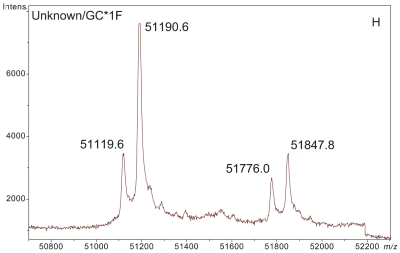
Figure 1 demonstrates the degree of structural micro-heterogeneity observed for DBP when a population of greater than 100 people [61 “healthy” and 52 with type 2 diabetes (T2D)] was examined. Several key features of DBP are notable within the mass spectra presented below.
FIGURE 1.
ESI-TOF mass spectra of intact D binding protein (DBP) isolated directly from the blood plasma of 7 different people, demonstrating the variety of forms in which DBP may be found under nonpathological conditions. The base peak(s) at approximately 51,200 Da represent unmodified DBP (which varies in exact mass according to DBP genotype), a peak at Δm +656.6 represents an O-linked glycoform [a (NeuAc)1(Gal)1(GalNAc)1 trisaccharide27–30], and a small peak at Δm +162 Da (if present) represents glycated DBP. Displayed masses correspond to the observed m/z value of an “MH+” species. A: Representative ESI charge state envelope of DBP. B: Homozygous GC*1F/GC*1F DBP (calculated unmodified DBP m/z = 51189.2). C: Homozygous GC*1S/GC*1S DBP (calculated unmodified DBP m/z = 51203.2). D:H omozygous GC*2/GC*2 DBP (calculated unmodified DBP m/z = 51216.3). E:H eterozygous GC*1F/GC*1S DBP (alleles minimally resolved). F: Heterozygous GC*1S/GC*2. G: Heterozygous GC*1F/GC*2 showing resolved allele products and association of trisaccharide glycoform with only the GC*1F gene product. H Heterozygous unknown rare allele paired with GC*1F. In this case glycosylation is observed on both allele products.
Genotype
Historically, DBP has been studied as a differentiating marker of inheritance since 1960.24 Three common alleles are known to exist along with many rare variants.25,26 The three common DBP alleles arise from two point mutations: D416E and T420K, generating the GC*1F allele (containing D416 and T420), GC*1S allele (containing E416 and T420), and the GC*2 allele (containing D416 and K420).
In the deconvoluted spectra shown in Figure 1, variant DBP genotypes (for which a gene sequence has been established) are readily determined based on mass (see Figure 1 caption for the calculated masses of the different DBP allele products). As given by the deconvoluted mass spectra, the molecular masses of most of the DBP variants observed fit the sequences of the three major DBP alleles reported in the UniProtKB/Swiss-Prot database, considering that all cysteine residues are involved in disulfide bonds. Results are unambiguous and produced in an average of about 15–20 min per sample (from raw plasma sample to deconvoluted mass spectrum) when run in batch mode. The standard deviation in mass accuracy across the 100 samples analyzed was less than 2 Da surrounding the calculated mass.
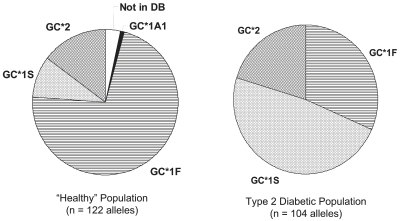
The distribution of DBP alleles in the two populations studied is given in Figure 2. These populations consisted of African-American, Caucasian, and Hispanic individuals. For the “healthy” population, n = 122 alleles, and for the T2D population, n = 104 alleles. The data show a statistical excess of the GC*1S allele (and corresponding deficit of the GC*1F allele) in the diabetic population. Statistically, a Chi-squared test with 2 sample donor types and 3 major DBP alleles, α set equal to 0.01, and 2 degrees of freedom gives χ2 = 49.6, p < 0.0001, and Cramer’s V = 0.474. (Cramer’s V is a statistic measuring the strength of association between two variables as a percentage of their maximum possible variation, i.e., the strength of association or dependency between two (nominal) categorical variables in a contingency table.)
FIGURE 2.
Distribution of D binding protein (DBP) alleles within the “healthy” (n = 122) and T2D populations (n = 104) studied. Chi-squared test: (2 sample donor types by 3 major DBP alleles; α = 0.01; 2 degrees of freedom: χ2 = 49.6, p < 0.0001; Cramer’s V = 0.474).
Glycosylation
The mass spectra shown in Figure 1 clearly document a form of DBP that is mass shifted by +657 Da. This higher mass species is readily identified as a form of DBP (and not some other protein) because sample preparation techniques were designed to specifically isolate DBP, and because the mass shift relative to the base peak stays constant as the parent mass changes due to alterations in genotype (see Figure 1B,C,H).
Based on previous investigations described in the literature27–30 and the observed mass shift, this Δm +657 Da modification corresponds to a (NeuAc)1(Gal)1(GalNAc)1 trisaccharide.27,30–33 Most interestingly, the data collected in this study clearly and directly demonstrate that this trisaccharide glycoform does not modify the GC*2 allele product, even in heterozygous individuals possessing a second gene product that is glycosylated (see Figure 1G). The GC*2 gene product lacks this glycoform due to the mutation of the attachment site (T420) to a lysine residue.
Glycation
DBP is susceptible to glycation. Protein glycation is defined as the covalent attachment of glucose to protein amino groups via the Maillard reaction with Amadori rearrangement resulting in a permanent 1-deoxyfructosyl adduct. Direct evidence for DBP glycation in the form of the signature +162 Da mass shift is readily seen in the deconvoluted mass spectra of some samples (e.g., as in Figure 1C). Indirect evidence that DBP is a target for glycation was first established by Jaleel et al. in 2005.34 Details regarding the degree of DBP glycation within the populations studied will be published elsewhere as part of a larger study involving additional proteins.
Optimized Sample Preparation
Several points regarding sample preparation merit mention as they directly impact the results of analyses like those described below.
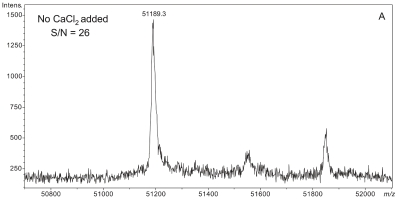
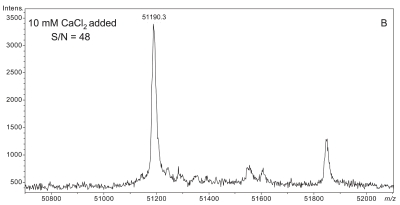
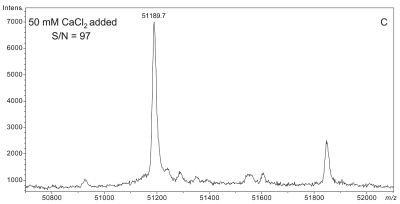
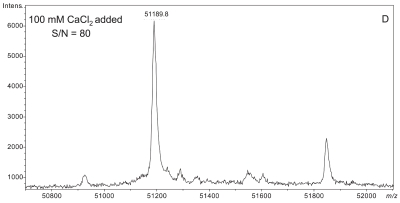
Plasma sample preparation was optimized to maximize affinity extraction yield by introducing 50 mM CaCl2 into raw plasma followed by incubation at 41°C for 2.5 h prior to dilution with HBS buffer. Figure 3 shows a series of four plasma samples fortified with increasing concentrations of CaCl2. A maximal effect at 50 mM CaCl2 was observed with plasma from two different donors (results from only one donor shown). Mere addition of CaCl2 without heating could not bring about the optimal results shown in Figure 3C,D (data not shown).
FIGURE 3.
Effect of increasing CaCl2 fortification during sample preparation on overall signal quality of intact D binding protein (DBP) mass spectra. All spectra were acquired from a single plasma sample (from a homozygous GC*1F/GC*1F individual) that was split into four aliquots, fortified with CaCl2 as shown, and heated at 40–42°C for the same period of time (2.5 h). A: No CaCl2 added. B: 10 mM CaCl2 added. C: 50 mM CaCl2 added. D: 100 mM CaCl2 added.
Elution of proteins from MSIA-Tips is accomplished by exposure of the MSIA-Tips to an acidic solution containing one-third acetonitrile (by volume). In a comparison between 60% (v/v) formic acid, 0.4% (v/v) trifluoroacetic acid, and 40 mM HCl (all calculated by solving the appropriate equilibrium-based quadratic equation to give a final H3O+ concentration of 40–50 mM and thus pH of 1–2), the formic acid and trifluoroacetic acid solutions provided the best sensitivity. In both cases, if samples were left exposed to the atmosphere for greater than about 20 min, oxidation of DBP would began to occur (as evidenced by mass shifts), thus it was necessary to inject samples within about 10 min of elution from the MSIA-Tip. Ultimately, the 60% formic acid solution was chosen for the analysis of the samples discussed here because, in preliminary work, very dilute solutions of isolated protein in trifluoroacetic acid solution tended to give poor ESI-MS signal compared to when trifluoroacetic acid was absent.
DISCUSSION
Comments on Sample Preparation
Perhaps the most striking effect on sample preparation that was documented during these studies was the effect of adding CaCl2 and heat to samples prior to affinity-based extraction of DBP (Figure 3). The reason for the dramatic increase in sensitivity remains unclear, but given the fact that most anticoagulants used to collect plasma bind Ca2+, the explanation may have to do with Ca2+ restoring the natural folding patterns and/or binding interactions of DBP and/or proteins with which it comes into contact, thus facilitating DBP’s binding to our immobilized antibodies. It is well known, for example, that serum albumin carries a large portion of circulating calcium. Disruption of albumin’s natural folding patterns and, thereby, binding interactions, could have a dramatic effect on the “availability” of many different proteins for affinity-based extraction.
Value Gained From Targeted Analysis of DBP
In the data presented here, the peak at +657 Da from DBP in deconvoluted mass spectra was readily identified as the (NeuAc)1(Gal)1(GalNAc)1 trisaccharide-modified DBP. Without having performed these analyses in a manner that specifically targeted DBP (e.g., if samples had been prepared using a nonaffinity-based, broad specificity solid-phase extraction technique) such an identification (i.e., linking the heavier peak to DBP in identity) would have been difficult if not impossible. This is because the first major line of evidence that the peak represented something related to DBP came from the fact that only DBP should have been detected based upon the sample preparation process. Secondly, because no peaks arising from other proteins were present, it was quickly recognized that the peaks at 51846, 51860, and 51776 Da (Figure 1B,C,H) were related (by a common mass shift) to the unmodified forms of the various DBP allele products. Addition of extra peaks to these spectra due to a less specific sample preparation procedure would likely have confounded interpretation.
In fact, it may not even have been possible to distinguish or recognize the various genotypic forms of DBP at all without having performed a targeted analysis of samples from individual donors.
Value Gained From Analysis of DBP Across Populations
The data showing an increased frequency of the GC*1S allele (and corresponding deficit of the GC*1F allele) in the diabetic population are in agreement with studies on Polynesian35 and Japanese36 subjects with regard to linkage of DBP genotype with T2D. Interestingly, these data do not agree with studies on the relationship between DBP genotype and T2D in French Caucasians,37 European-Americans,38 and Polish39 populations. Regardless of whether or not an association exists between DBP genotype and T2D, such information simply becomes unavailable unless larger numbers of people are taken into account and analyzed individually.
Studies by Christiansen et al.40 reported substantial difficulty in finding evidence for glycosylation of DBP in a preparation of the protein from a source originating from pooled plasma. Perhaps a source consisting primarily of donors possessing the GC*2 isoform accounted for the difficulty. Regardless, one would not necessarily have been aware of the lack of glycosylation on the GC*2 allele product and the constant +657 Da mass shift based on the genotype-dictated unmodified protein mass without having data originating from the analysis of plasma from multiple, individual donors.
Value Gained From Analysis of Intact DBP
The knowledge that DBP was intact and completely unmodified in any artificial manner is the feature that makes interpretation of the mass spectra presented here so abundantly simple. Barring rare isobaric variations, the masses of intact proteins are certain to provide comprehensive (albeit, not completely detailed) information with regard to the nature of DBP extracted from individuals—which is more than can be guaranteed anytime a protein is broken apart. The data presented here suggest that many posttranslational modifications (PTMs) are far easier to detect while proteins are still intact. Moreover, as shown in Figure 1C, multiple PTMs were readily detected through the analysis of intact DBP. Analyses of intact proteins may not provide perfectly detailed information, but they serve as comprehensive leads, steering subsequent characterization.
Value of ESI-MS Toward Analysis of DBP
The above discussion warrants a comment about analytical resolving power. As mentioned in the beginning of the article, a major impetus for analyzing larger proteins by ESI-TOF-MS was that analytical blind spots begin to reintroduce themselves as instrumental resolving power (relative to the mass of biological variants) begins to wane. This happens with MALDI-TOF-MS above the m/z range of about 30,000. The data presented here demonstrate the ability of ESI-based mass spectrometry to complement the analytical capabilities of MALDI-TOF for the analysis of intact proteins, providing much needed resolving power by employing highly multiply charged ions to “dilute out” initial ion kinetic energy dispersion. Data on DBP genotype, glycation, and arguably glycosylation would likely simply not be available without ESI-based mass spectrometry.
Lack of Trisaccharidic Glycosylation of the GC*2 Allele Product
The raw data presented here for the GC*2 allele product show that it lacks the common (NeuAc)1(Gal)1(GalNAc)1 trisaccharide glycoform modification in contrast to other DBP allele products. The GC*2 allele product, however, does not lack glycosylation altogether: Yamamoto et al.28–31,41 have shown that the GC*2 allele product carries a (Gal)1(GalNAc)1 disaccharide which converts to DBP-macrophage activating factor (DBP-MAF) upon exposure to β-galactosidase. (Evidence for this disaccharide-modified form of the GC*2 allele product can be seen as a +365 Da mass shift from the base peak in Panel D of Figure 1.) Other allelic forms of DBP also require exposure to sialidase to generate DBP-MAF.
But since the only amino acid difference between the GC*2 and GC*1F forms of DBP is mutation of T420 to lysine (removing the site of trisaccharidic glycosylation in GC*2 allele products), shouldn’t GC*1F (and GC*1S, for that matter) also carry a disaccharide modification—considering that the site of disaccharidic glycosylation on GC*2 remains intact in GC*1 variants? The data shown here actually hint that this is the case: Deconvoluted mass spectra of DBP from homozygous individuals (Figure 1B–D) show (more clearly, at least, than heterozygous cases) a small peak at Δm = +365 Da from the native, unmodified protein (represented by the base peak). In fact, trace amounts of the GC*1S allele product modified by both glycoforms may be evidenced in Panel C of Figure 1 at m/z 52225. We have recently followed up on these molecular clues and additional details on the genotype-linked O-glycosylation patterns of DPB have recently been published elsewhere.31
CONCLUSIONS
ESI-TOF-MS data collected on intact DBP (a 51-kDa protein) in a targeted manner across populations provided functional genotypic analysis and the detection of multiple, specific DBP modifications attached to particular allele products, facilitating the detection and identification of more than 10 forms of DBP—even providing data to suggest that some of these forms may be useful as biomarkers towards T2D. With regard to technique, targeted, mass spectrometric analysis of intact protein across populations was required to accomplish this task. Considering that two major categories of protein biomarker include modification of amino acid sequence and qualitative/quantitative changes in posttranslational modification, the potential utility for this type of analytical approach remains not only overlooked, but essentially untapped.
ACKNOWLEDGMENTS
The authors are grateful to Intrinsic Bioprobes, Inc. team members for their helpful discussions. Work supported by Arizona State University’s Technology and Research Initiative Fund and by the Agilent Technologies Foundation in the form of Research Project Gift 08US-422UR.
REFERENCES
- 1.Mann M, Wilm M. Electrospray mass spectrometry for protein characterization. Trends Biochem Sci. 1995;20:219–224. doi: 10.1016/s0968-0004(00)89019-2. [DOI] [PubMed] [Google Scholar]
- 2.Siuzdak G. The emergence of mass spectrometry in biochemical research. Proc Natl Acad Sci USA. 1994;19:11290. doi: 10.1073/pnas.91.24.11290. [DOI] [PMC free article] [PubMed] [Google Scholar]
- 3.Kiernan UA, Nedelkov D, Tubbs KA, Niederkofler EE, Nelson RW. Proteomic characterization of novel serum amyloid P component variants from human plasma and urine. Proteomics. 2004;4:1825–1829. doi: 10.1002/pmic.200300690. [DOI] [PubMed] [Google Scholar]
- 4.Kiernan UA, Nedelkov D, Tubbs KA, Niederkofler EE, Nelson RW. Selected expression profiling of full-length proteins and their variants in human plasma. Clin Proteomics. 2004;1:7–16. [Google Scholar]
- 5.Kiernan UA, Tubbs KA, Gruber K, et al. High-throughput protein characterization using mass spectrometric immunoassay. Anal Biochem. 2002;301:49–56. doi: 10.1006/abio.2001.5478. [DOI] [PubMed] [Google Scholar]
- 6.Kiernan UA, Tubbs KA, Nedelkov D, Niederkofler EE, Nelson RW. Detection of novel truncated forms of human serum amyloid A protein in human plasma. FEBS Lett. 2003;537:166–170. doi: 10.1016/s0014-5793(03)00097-8. [DOI] [PubMed] [Google Scholar]
- 7.Nedelkov D, Kiernan UA, Niederkofler EE, Tubbs KA, Nelson RW. Investigating diversity in human plasma proteins. Proc Natl Acad Sci USA. 2005;102:10852–10857. doi: 10.1073/pnas.0500426102. [DOI] [PMC free article] [PubMed] [Google Scholar]
- 8.Nedelkov D, Phillips DA, Tubbs KA, Nelson RW. Investigation of human protein variants and their frequency in the general population. Mol Cell Proteomics. 2007;6:1183–1187. doi: 10.1074/mcp.M700023-MCP200. [DOI] [PubMed] [Google Scholar]
- 9.Nedelkov D, Tubbs KA, Niederkofler EE, Kiernan UA, Nelson RW. High-throughput comprehensive analysis of human plasma proteins: a step toward population proteomics. Anal Chem. 2004;76:1733–1737. doi: 10.1021/ac035105+. [DOI] [PubMed] [Google Scholar]
- 10.Niederkofler EE, Tubbs KA, Gruber K, et al. Determination of beta-2 microglobulin levels in plasma using a high-throughput mass spectrometric immunoassay system. Anal Chem. 2001;73:3294–3299. doi: 10.1021/ac010143j. [DOI] [PubMed] [Google Scholar]
- 11.Niederkofler EE, Tubbs KA, Kiernan UA, Nedelkov D, Nelson RW. Novel mass spectrometric immunoassays for the rapid structural characterization of plasma apolipoproteins. J Lipid Res. 2003;44:630–639. doi: 10.1194/jlr.D200034-JLR200. [DOI] [PubMed] [Google Scholar]
- 12.Wu J, Watson JT. A novel methodology for assignment of disulfide bond pairings in proteins. Protein Sci. 1997;6:391–398. doi: 10.1002/pro.5560060215. [DOI] [PMC free article] [PubMed] [Google Scholar]
- 13.Qi J, Wu J, Somkuti GA, Watson JT. Determination of the disulfide structure of sillucin, a highly knotted, cysteine-rich peptide, by cyanylation/cleavage mass mapping. Biochemistry. 2001;40:4531–4538. doi: 10.1021/bi002229x. [DOI] [PubMed] [Google Scholar]
- 14.Qi J, Wu W, Borges CR, Hang D, Rupp M, Torng E, Watson JT. Automated data interpretation based on the concept of “negative signature mass” for mass-mapping disulfide structures of cystinyl proteins. J Am Soc Mass Spectrom. 2003;14:1032–1038. doi: 10.1016/S1044-0305(03)00145-4. [DOI] [PubMed] [Google Scholar]
- 15.Jaffrey SR, Snyder SH. The biotin switch method for the detection of S-nitrosylated proteins. Sci STKE. 2001;2001:PL1. doi: 10.1126/stke.2001.86.pl1. [DOI] [PubMed] [Google Scholar]
- 16.Borges CR, Qi J, Wu W, Torng E, Hinck AP, Watson JT. Algorithm-assisted elucidation of disulfide structure: application of the negative signature mass algorithm to mass-mapping the disulfide structure of the 12-cysteine transforming growth factor beta type II receptor extracellular domain. Anal Biochem. 2004;329:91–103. doi: 10.1016/j.ab.2004.01.037. [DOI] [PubMed] [Google Scholar]
- 17.Kiernan UA, Addobbati R, Nedelkov D, Nelson RW. Quantitative multiplexed C-reactive protein mass spectrometric immunoassay. J Proteome Res. 2006;5:1682–1687. doi: 10.1021/pr0601133. [DOI] [PubMed] [Google Scholar]
- 18.Nelson RW, Krone JR, Bieber AL, Williams P. Mass spectrometric immunoassay. Anal Chem. 1995;67:1153–1158. doi: 10.1021/ac00103a003. [DOI] [PubMed] [Google Scholar]
- 19.Nelson RW, Nedelkov D, Tubbs KA, Kiernan UA. Quantitative mass spectrometric immunoassay of insulin like growth factor 1. J Proteome Res. 2004;3:851–855. doi: 10.1021/pr0499388. [DOI] [PubMed] [Google Scholar]
- 20.Tubbs KA, Kiernan UA, Niederkofler EE, Nedelkov D, Bieber AL, Nelson RW. Development of recombinant-based mass spectrometric immunoassay with application to resistin expression profiling. Anal Chem. 2006;78:3271–3276. doi: 10.1021/ac060013g. [DOI] [PubMed] [Google Scholar]
- 21.Tubbs KA, Nedelkov D, Nelson RW. Detection and quantification of beta-2-microglobulin using mass spectrometric immunoassay. Anal Biochem. 2001;289:26–35. doi: 10.1006/abio.2000.4921. [DOI] [PubMed] [Google Scholar]
- 22.Kiernan UA, Nedelkov D, Nelson RW. Multiplexed mass spectrometric immunoassay in biomarker research: a novel approach to the determination of a myocardial infarct. J Proteome Res. 2006;5:2928–2934. doi: 10.1021/pr060062+. [DOI] [PubMed] [Google Scholar]
- 23.Hermanson GT, Krishna Mallia A, Smith PK. Immobilized Affinity Ligand Techniques. San Diego, CA: Academic Press; 1992. pp. 64–69. [Google Scholar]
- 24.Hirschfeld J, Jonsson B, Rasmuson M. Inheritance of a new group-specific system demonstrated in normal human sera by means of an immuno-electrophoretic technique. Nature. 1960;185:931–932. doi: 10.1038/185931b0. [DOI] [PubMed] [Google Scholar]
- 25.Cleve H, Constans J. The mutants of the vitamin-D-binding protein: more than 120 variants of the GC/DBP system. Vox sang. 1988;54:215–225. doi: 10.1111/j.1423-0410.1988.tb03908.x. [DOI] [PubMed] [Google Scholar]
- 26.Speeckaert M, Huang G, Delanghe JR, Taes YE. Biological and clinical aspects of the vitamin D binding protein (Gc-globulin) and its polymorphism. Clinica Chim Acta. 2006;372:33–42. doi: 10.1016/j.cca.2006.03.011. [DOI] [PubMed] [Google Scholar]
- 27.Viau M, Constans J, Debray H, Montreuil J. Isolation and characterization of the O-glycan chain of the human vitamin-D binding protein. Biochem Biophys Res Commun. 1983;117:324–331. doi: 10.1016/0006-291x(83)91579-6. [DOI] [PubMed] [Google Scholar]
- 28.Yamamoto N. Structural definition of a potent macrophage activating factor derived from vitamin D3-binding protein with adjuvant activity for antibody production. Mol Immunol. 1996;33:1157–1164. doi: 10.1016/s0161-5890(96)00081-8. [DOI] [PubMed] [Google Scholar]
- 29.Yamamoto N, Homma S. Vitamin D3 binding protein (group-specific component) is a precursor for the macrophage-activating signal factor from lysophosphatidylcholinetreated lymphocytes. Proc Natl Acad Sci USA. 1991;88:8539–8543. doi: 10.1073/pnas.88.19.8539. [DOI] [PMC free article] [PubMed] [Google Scholar]
- 30.Borges CR, Jarvis JW, Oran PE, Nelson RW. Population studies of vitamin D binding protein microheterogeneity by mass spectrometry lead to characterization of its genotype-dependent O-glycosylation patterns. J Proteome Res. 2008 doi: 10.1021/pr8002936. Epub ahead of print. [DOI] [PubMed] [Google Scholar]
- 31.Yamamoto N, Kumashiro R. Conversion of vitamin D3 binding protein (group-specific component) to a macrophage activating factor by the stepwise action of betagalactosidase of B cells and sialidase of T cells. J Immunol. 1993;151:2794–2802. [PubMed] [Google Scholar]
- 32.Nagasawa H, Uto Y, Sasaki H, et al. Gc protein (vitamin D-binding protein): Gc genotyping GcMAF precursor activity. Anticancer Res. 2005;25:3689–3695. [PubMed] [Google Scholar]
- 33.Ohkura K, Nagasawa H, Uto Y, Okamura N, Murakami A, Hori H. The role of Gc protein oligosaccharide structure as a risk factor for COPD. Anticancer Res. 2006;26:4073–4078. [PubMed] [Google Scholar]
- 34.Jaleel A, Halvatsiotis P, Williamson B, Juhasz P, Martin S, Nair KS. Identification of Amadori-modified plasma proteins in type 2 diabetes and the effect of short-term intensive insulin treatment. Diabetes Care. 2005;28:645–652. doi: 10.2337/diacare.28.3.645. [DOI] [PubMed] [Google Scholar]
- 35.Kirk RL, Serjeanston SW, Zimmet P. Genes and diabetes in the Pacific. In: Mimura G, Baba S, Goto Y, Kobberling J, editors. Clinicogenetic Genesis of Diabetes Mellitus. Amsterdam: Excepta Medica; 1982. pp. 34–41. [Google Scholar]
- 36.Hirai M, Suzuki S, Hinokio Y, et al. Group specific component protein genotype is associated with NIDDM in Japan. Diabetologia. 1998;41:742–743. doi: 10.1007/s001250050980. [DOI] [PubMed] [Google Scholar]
- 37.Ye WZ, Dubois-Laforgue D, Bellanne-Chantelot C, Timsit J, Velho G. Variations in the vitamin D-binding protein (Gc locus) and risk of type 2 diabetes mellitus in French Caucasians. Metabolism. 2001;50:366–369. doi: 10.1053/meta.2001.20172. [DOI] [PubMed] [Google Scholar]
- 38.Klupa T, Malecki M, Hanna L, et al. Amino acid variants of the vitamin D-binding protein and risk of diabetes in white Americans of European origin. Eur J Endocrinol. 1999;141:490–493. doi: 10.1530/eje.0.1410490. [DOI] [PubMed] [Google Scholar]
- 39.Malecki MT, Klupa T, Wanic K, Cyganek K, Frey J, Sieradzki J. Vitamin D binding protein gene and genetic susceptibility to type 2 diabetes mellitus in a Polish population. Diabetes Res Clinical Practice. 2002;57:99–104. doi: 10.1016/s0168-8227(02)00020-7. [DOI] [PubMed] [Google Scholar]
- 40.Christiansen M, Jorgensen CS, Laursen I, Hirschberg D, Hojrup P, Houen G. Protein chemical characterization of Gc globulin (vitamin D-binding protein) isoforms; Gc-1f, Gc-1s and Gc-2. Biochim Biophys Acta. 2007;1774:481–492. doi: 10.1016/j.bbapap.2007.01.005. [DOI] [PubMed] [Google Scholar]
- 41.Yamamoto N, Homma S, Millman I. Identification of the serum factor required for in vitro activation of macrophages. Role of vitamin D3-binding protein (group specific component, Gc) in lysophospholipid activation of mouse peritoneal macrophages. J Immunol. 1991;147:273–280. [PubMed] [Google Scholar]


