

Abstract
Resting state functional connectivity MRI (fcMRI) has become a particularly useful tool for studying regional relationships in typical and atypical populations. Because many investigators have already obtained large datasets of task related fMRI, the ability to use this existing task data for resting state fcMRI is of considerable interest. Two classes of datasets could potentially be modified to emulate resting state data. These datasets include: 1) “interleaved” resting blocks from blocked or mixed blocked/event-related sets, and 2) residual timecourses from event-related sets that lack rest blocks. Using correlation analysis, we compared the functional connectivity of resting epochs taken from a mixed blocked/event-related design fMRI data set and the residuals derived from event-related data with standard continuous resting state data to determine which class of data can best emulate resting state data. We show that despite some differences, the functional connectivity for the interleaved resting periods taken from blocked designs is both qualitatively and quantitatively very similar to that of “continuous” resting state data. In contrast, despite being qualitatively similar to “continuous” resting state data, residuals derived from event-related design data had several distinct quantitative differences. These results suggest that the interleaved resting state data such as those taken from blocked or mixed blocked/event-related fMRI designs are well-suited for resting state functional connectivity analyses. Although using event-related data residuals for resting state functional connectivity may still be useful, results should be interpreted with care.
INTRODUCTION
Functional neuroimaging data has been utilized for over a decade to examine regional interactions in the brain. Such interactions have been termed “functional connectivity” and at the “Functional Brain Connectivity Workshop” in Dusseldorf, Germany have been formally defined as the “temporal correlations between spatially remote neurophysiological events” (Friston et al., 1993a; Lee et al., 2003). Functional connectivity analyses were first performed using Positron Emission Tomography (PET) (Clark et al., 1984; Friston et al., 1993b; Horwitz et al., 1984; Horwitz et al., 1992; Metter et al., 1984a; Metter et al., 1984b; Prohovnik et al., 1980), and have since expanded into several other imaging modalities, for which many novel analysis strategies have been developed (Bellec et al., 2006; Biswal et al., 1995; Bokde et al., 2001; Buchel and Friston, 1997; Bullmore et al., 2000; Goncalves et al., 2001; Hampson et al., 2002; Horwitz, 2003; Horwitz et al., 2005; Lee et al., 2003; Pugh et al., 2000).
In functional magnetic resonance imaging (fMRI), attention has recently focused on determining regional interactions using data from subjects at rest (i.e. “resting state functional connectivity”) (Biswal et al., 1995; Fox et al., 2005; Fransson, 2005; Greicius et al., 2003). Resting state functional connectivity measures low frequency (< 0.08 Hz) blood oxygen level dependent (BOLD) signal fluctuations between regions occurring at rest (Biswal et al., 1995; Fox et al., 2005; Greicius et al., 2003). These low frequency BOLD fluctuations are presumed to relate to “spontaneous” neural activity (Biswal et al., 1995; Leopold et al., 2003; Nir et al., 2006). By cross-correlating the time series of a particular brain region (seed region) with all other voxels, one can determine which voxels are “functionally connected” with that region.
Resting state functional connectivity measures are of interest for several reasons. First, some consider them to reflect human anatomical connectivity (Koch et al., 2002; Quigley et al., 2003). Second, the reliance of functional connectivity MRI (fcMRI) on resting state data unburdens experimental design, subject compliance, and training demands making it attractive for studies of development and clinical groups (Bokde et al., 2006; Greicius et al., 2004; Rombouts and Scheltens, 2005; Tian et al., 2006; Whalley et al., 2005). Because many investigators have already obtained large task related datasets of atypical populations, the ability to take advantage of existing task data and extract resting state data is of considerable interest.
Two classes of datasets could potentially be modified to emulate resting state data. These sets include the use of 1) interleaved resting blocks from blocked or mixed blocked/event-related sets, and 2) residual timecourses from event-related sets that lack rest blocks.
These two types of datasets present different sets of concerns about their applicability for fcMRI. Using blocked or mixed blocked/event-related fMRI datasets with relatively short resting periods limits the range of frequencies that can be used to extract the resting correlation information; however, it has been suggested that isolating higher frequencies above 0.1 Hz will produce similar correlation profiles (Salvador et al., 2005), but with slightly lower correlation coefficients than if using frequencies below 0.1.Hz. These results suggest that concatenating the short resting epochs of some blocked design data, despite missing the lowest frequency components due to the shorter total sampling period, may yield similar correlation profiles compared to continuous resting state data. Another possible concern is that spontaneous resting state activity may be altered by previous task states. There has been limited work on this issue, but the available data suggest that this may only be a concern on the individual subject level (Waites et al., 2005). Moreover, Hampson et al (Hampson et al., 2002), while examining an approach for identifying interregional correlations in resting state data using two independent data sets, despite some differences, qualitatively observed similar correlation patterns between the resting periods of a blocked design dataset and continuous resting data for a premotor seed region.
Extracting “resting-state” data for functional connectivity analyses from event-related fMRI data presents a different set of problems in that 1) task-induced correlations may contaminate the resting correlations, and 2) constant engagement of a task may alter the underlying spontaneous BOLD fluctuations (Fransson, 2006). Work by Fox et al (Fox et al., 2006b) and Arfanakis et al (Arfanakis et al.) have demonstrated that much of the variance observed in trial-to-trial task-evoked activity can be accounted for by the underlying spontaneous activity. Fox and colleagues suggest that there is a linear addition of task-related activity on top of persistent resting spontaneous activity. The implication here is that constant task engagement would not affect the underlying spontaneous BOLD activity. Results thus far supporting the linear superposition premise have been limited to primary sensory and motor regions and for specific task conditions (Arfanakis et al., 2000; Fox et al., 2006b). Although it remains unclear, if this is a universal property, adequate removal of the task induced variance for functional connectivity should yield a correlation profile similar to “continuous” resting state data. A potential method for removing systematic task induced variance is to model the task effects within a general linear model (GLM) design, remove them, and then analyze the timeseries of the remaining (residual) signal.
Using correlation analysis, we compared the functional connectivity of resting epochs taken from a mixed/block event-related design fMRI data set and the residuals derived from event-related data with standard continuous resting state data to determine which class of data can best emulate resting state data.
METHODS
Subjects
All subjects were right-handed native English speakers with normal or corrected-to-normal vision. Subjects were recruited from Washington University and the local community. Participants were screened with a questionnaire to ensure that they had no history of neurological/psychiatric diagnoses or drug abuse. Informed consent was obtained from all subjects in accordance with the guidelines and approval of the Washington University Human Studies Committee. Subjects participated in return for payment.
Event-related design subjects
Ten healthy, right-handed, native English speaking subjects (6 Male; 19 – 30 years; mean 23 y) were scanned while performing three controlled and four simple lexical tasks. The controlled tasks were verb-, rhyme-, and opposite generation and the simple tasks were reading, repeating, passive auditory presentation of word, and passive visual presentation of words. As previously described (Brown et al., 2005; Schlaggar et al., 2002), single word stimuli were presented serially in two different modalities (auditory and visual).
Prior to each run a fixation crosshair was presented in the center of the screen, remained for the duration of the auditory runs, and for visual runs was replaced only during the appearance of the task word. During all runs subjects were instructed to maintain gaze on the fixation cross and to minimize movement. Words were presented in white on a black background. Each word was presented every second, third, or fourth MR frame (average interstimulus interval = 9.24 s) in a pseudorandom fashion. This jittering allowed the event-related timecourse of the response to be extracted (see below). Visual stimulus duration for visual presentation was relatively prolonged to aid in reading (1.37s), while auditory presentation duration varied by word length. Each run lasted 3 minutes 39 seconds and consisted of 21 stimulus trials.
Mixed blocked/event-related design subjects
Ten healthy adults (5 Male; 21 – 28 years; mean 23.5 y) performed living/non-living category judgments on black and white line drawings of non-living objects and living plants and animals (Wenger et al., 2005). Subjects were instructed to decide whether each stimulus depicted belonged in the “living” or “non-living” category, and to press one of two buttons indicating their choice using their left and right index fingers.
Each subject performed a total of eight functional runs. Each run consisted of three fixation-only periods and two task blocks. The task blocks were 40 MR frames (each frame = 2.5s) long (including cues; see below). The baseline resting epoch before the first task block was 14 frames, the resting epoch between the two task blocks was 17 frames, and the final resting epoch was 13 frames long (see Figure 1). Within each task block, 19 picture stimuli were presented in a pseudorandomly jittered manner (the 19 trials within a single task block were jittered with a flat distribution of 0, 1, or 2 frames between stimulus onsets). Stimulus duration was 1300 ms. At the beginning and end of each task block, the fixation crosshair changed from black to red (start and stop cues) for 1250 ms, indicating that the task block was beginning or ending, respectively.
Figure 1.
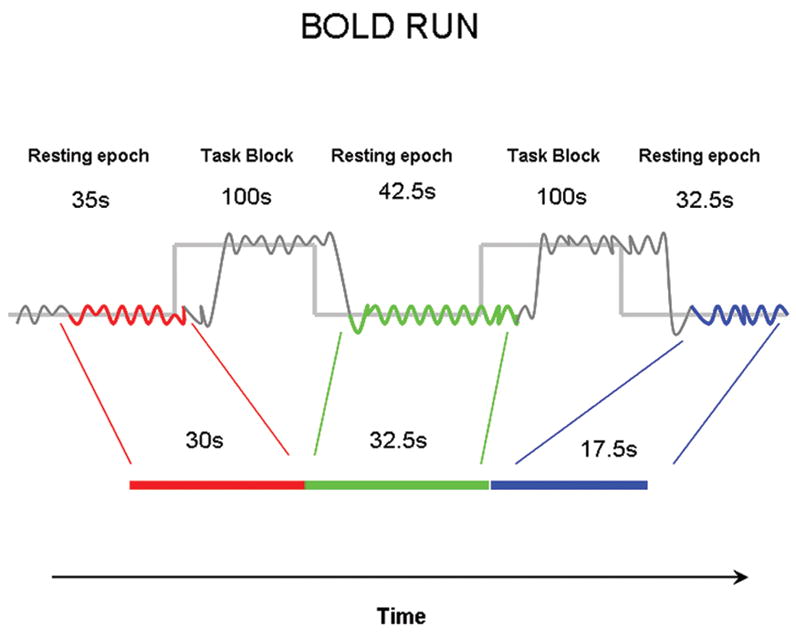
A schematic representing the removal of task periods from a mixed blocked/Event -related dataset. At the start of a BOLD run steady state was assumed after 4 frames (~ 10 s) and for each run these frames were removed on a voxel-wise basis. Two frames after the start of each task block (~ 5s) were included as resting state to account for the hemodynamic delay. At the end of each task block, 6 frames (~ 15s) were excluded from the resting state data, allowing for the hemodynamic response to return to baseline. These measures help minimize the effect of the task blocks on each resting epoch. This procedure provided 256 frames (~ 640 s) of “interleaved” resting state data for each subject.
Continuous resting-state subjects
Ten healthy, right-handed, native English speaking subjects (6 Male; 23 – 26 years; mean 24.6 y) were scanned during resting fixation. Throughout the runs subjects were instructed to maintain gaze on a white fixation cross placed on a black background.
MRI data acquisition
FMRI data were acquired on a Siemens 1.5 Tesla MAGNETOM Vision system (Erlangen, Germany). Subjects’ heads were stabilized using pillows and a thermoplastic mask. Structural images were obtained using a sagittal magnetization-prepared rapid gradient echo (MP-RAGE) three-dimensional T1-weighted sequence (TR = 9.7 ms, TE = 4 ms, flip angle = 12o, TI = 300 ms, voxel size = 1.25 × 1 × 1 mm, slices = 128). Functional images were obtained using an asymmetric spin echo echo-planar sequence sensitive to blood oxygen level-dependent (BOLD) contrast (see table 1 for details). During each scan, 73 MR frames (event-related), 124 MR frames (blocked data), and 128 MR frames (resting data) of 16 contiguous interleaved 8 mm axial slices were acquired parallel to the plane transecting the anterior and posterior commissure (AC-PC plane), allowing complete brain coverage. Steady state magnetization was assumed after three frames (~ 9 s) for event related data and 4 frames (~ 10 s) for block and resting state data.
Table 1.
MR scanning parameters
| Resting | Mixed blocked/event-related | Event-related | |
|---|---|---|---|
| Field Strength | 1.5T | 1.5T | 1.5T |
| BOLD TR | 2.5s | 2.5s | 3.08s |
| BOLD TE | 50ms | 50ms | 50ms |
| BOLD flip angle | 90 | 90 | 90 |
| Voxel Size | 3.75 × 3.75mm | 3.75 × 3.75mm | 3.75 × 3.75mm |
| Frames per Run | 128 | 124 | 73 |
Data preprocessing
Functional images were preprocessed to reduce artifacts (Miezin et al., 2000b). This preprocessing included (i) removal of a central spike caused by MR signal offset, (ii) correction of odd vs. even slice intensity differences attributable to interleaved acquisition without gaps, (iii) correction for head movement within and across runs and (iv) within run intensity normalization to a whole brain mode value of 1000. In all presently reported data, within-run subject motion was less than 1 mm rms. Atlas transformation (Talairach and Tournoux, 1988) of the functional data was computed for each individual via the MPRAGE. Each run then was resampled in atlas space on an isotropic 3 mm3 grid combining movement correction and atlas transformation in one interpolation. All subsequent operations were performed on the atlas-transformed volumetric timeseries.
Correlation Preprocessing
As previously described (Fox et al., 2005), several additional preprocessing steps were used to reduce spurious variance unlikely to reflect neuronal activity. These steps included: 1) a temporal band-pass filter (0.009 Hz < f < 0.08 Hz) and spatial smoothing (6mm full width at half maximum), 2) regression of six parameters obtained by rigid body head motion correction, 3) regression of the whole brain signal averaged over the whole brain 4) regression of ventricular signal averaged from ventricular ROI, and 5) regression of white matter signal averaged from white matter ROI. Regression of first order derivative terms for the whole brain, ventricular, and white matter signals were also included in the correlation preprocessing.
Removal of task effects from event-related data
Deterministic task-related BOLD responses were modeled using the general linear model and then removed by regression. Based on previous results that suggest a linear superposition of task activity and spontaneous BOLD fluctuations (Arfanakis et al., 2000; Fox et al., 2006b), it may be assumed that if task induced variance is adequately removed from an event-related design data set then the remaining residual signal should represent “continuous” resting state data. Task induced variance was removed prior to the functional connectivity preprocessing on a voxel-by-voxel basis using the general linear model (GLM) (Brown et al., 2005; Fair et al., 2006; Miezin et al., 2000a; Schlaggar et al., 2002) as implemented by in-house software programmed in the Interactive Data Language (IDL; Research Systems, Inc., Boulder, CO).
The GLM design included time as a seven level factor, made up of the seven MR frames following stimulus presentation. This method does not assume a canonical hemodynamic impulse response shape. The task-related BOLD response was modeled over a period of ~ 22 s (7 frames, 3.08 s per MR frame). Two additional regressors were coded in the GLM for baseline signal and linear drift. Residual timecourses, created by removing the modeled effects, were used in the functional connectivity preprocessing steps (see below).
Comparison of event-related data before and after task-effect removal
To determine how well the steps described above had removed linear task effects, a GLM was re-computed on the residual timecourses. A main effect of time ANOVA was then performed with time (7 levels: 7 time points) as a factor. Remaining nonlinear task effects could potentially falsely contribute to the functional connectivity correlations, such that seed regions near or at task-evoked activations might show higher correlations with other activated brain regions. To control for this possibility a main effect of time ANOVA, both before and after the task effects had been removed, was created. If our approach did not completely remove the task effects, the remaining task-induced variations might drive correlations between regions of the brain that are similarly activated by the task. Along the same lines, if task effects were not completely removed, differences between the functional connectivity maps derived from “continuous” resting state data and those derived from the event-related residuals might overlap with the strongest task activations.
Removal of interleaved task blocks from mixed blocked/event-related data
The removal of the task epochs from the mixed blocked/event-related design data is represented in Figure 1. On a voxel-wise basis at the start of each BOLD run, steady state was assumed after 4 frames (~ 10 s) and for each run these 4 frames were removed. Two frames after the start of each task block (~ 5s) were included as resting state to account for the hemodynamic delay. At the end of each task block, 6 frames (~ 15s) were excluded from the resting state data, allowing for the hemodynamic response to return to baseline. Both of these measures should help minimize the effect of the task blocks on each resting epoch while the maximizing number of frames included in the analysis. In this manner, after correlation preprocessing, task blocks were excised and the remaining resting epochs were shifted to zero mean and then concatenated. This procedure provided 256 frames (~ 640 s) of resting state data for each subject. Similar lengths and frame counts have been used in previous resting state studies (Salvador et al., 2005). All comparisons (see below) were based on 256 frames of resting state data for each subject. A limited amount of high frequency components may have been introduced into the data using the procedure described here. However, because cross correlations were computed across each frame in the timeseries (see below) and the phase relationships between any two frames, despite splicing, remain intact, the effect of high frequency additions is most likely very limited.
Simulated interleaved resting state data
It has been argued, at least on the individual subject level, that the resting state interregional correlation profiles are altered by previous task states (Waites et al., 2005). To determine the effect of concatenating interleaved resting epochs on functional connectivity, without the influence of any task, we simulated the interleaved condition with “continuous” resting state data. To do this we spliced our “continuous” resting data into identically sized blocks as described above for the Mixed/Block event-related design data task removal, and re-concatenated the data in a pseudorandom order that prohibited previously sequential blocks from being positioned in the same order.
In addition, because our longest resting epoch was 13 frames (~ 32.5 s) long, the lowest frequency we were able to fully analyze was ~ 0.03 Hz. Simulating the interleaved resting data by splicing “continuous” resting state data reproduces this effect. Differences observed in the comparison between the simulated interleaved resting state data and the “continuous” resting state data (see below) may be due to this loss of higher frequencies or the effect of previous task performance as described above.
Group comparisons across different types of “resting” data
Five seed regions (12mm diameter spheres) were chosen from Brown et al (Brown et al., 2005) to be analyzed (Table 3). These seed regions all lay in areas of task activation for the event related data.
It has been suggested that the functional connectivity between regions outside of task induced areas remains largely unchanged during task performance (Arfanakis et al., 2000). To be able to address this idea we specifically chose an additional region (−1, 47, −4) for the analyses of event-related data that carried no event-related task effects. This medial prefrontal region has been identified as part of the “default” brain system (Fox et al., 2005).
For all subjects BOLD timecourses were extracted for each seed region. Correlation maps were generated by computing correlation coefficients between the seed region timecourse and the timecourse for all voxels.
The Fischer z transformation was applied to the correlation coefficients to improve normality for the random effects analysis. One sample t-tests provided qualitative comparisons between all data sets (i.e. residual event – related data, interleaved resting epochs from mixed blocked/event-related data, “continuous” resting state data, and simulated interleaved resting epochs) for each seed.
For each seed, all test groups were directly compared to “continuous” resting state data using two-sample t-tests. A voxel-wise correction based on Monte Carlo simulation was implemented to guard against false positives resulting from conducting a large number of statistical comparisons over many images (Forman et al., 1995). For each comparison map, and for all seeds, to achieve P < 0.05 corrected for voxel clusters, a threshold of 17 contiguous voxels with a z-value > 3.0 was used. Regions were defined using a peak search algorithm to obtain the center of mass and cluster coordinates for statistically significant voxels. Peaks were identified after a 4 mm hard sphere pre-blur and a statistical threshold of z > 3.0. Regions were then defined around the peaks beginning with a radius of 10mm and by consolidating regions with peaks closer than 10mm. Regions smaller than 17 voxels and voxels less than a z of 3.0 (the size of the Monte Carlo correction) were eliminated.
Group differences generated by the two – sample t-test maps were likely to be driven by one of three interactions: 1) One group has a relatively larger correlation than the other, 2) one group has a significant correlation while the other has no correlation, or 3) each group has a significant correlation but with opposite signs. To test for the source of the differences across the regions generated from the random effects comparisons, one-sampled t-tests were performed within each group and categorized based on the type of interaction. Regions with a significant interaction but neither group was statistically different from zero were removed. Regions determined to be within white matter or ventricles were also removed from further analysis.
RESULTS
Removal of task effects from event-related data
Our GLM approach appeared to remove linear task effects. The main effect of time image (ANOVA, monte carlo corrected) prior to task removal showed clear task evoked activity (see Supplementary Material). In contrast, the main effect of time image (ANOVA, corrected) for the residual timecourses revealed no significant activations (See Supplementary Material).
While the group comparisons between the event-related data residuals and the “continuous” resting state data were qualitatively very similar (see Figure 2), distinct quantitative differences were present (see Figure 3).
Figure 2.
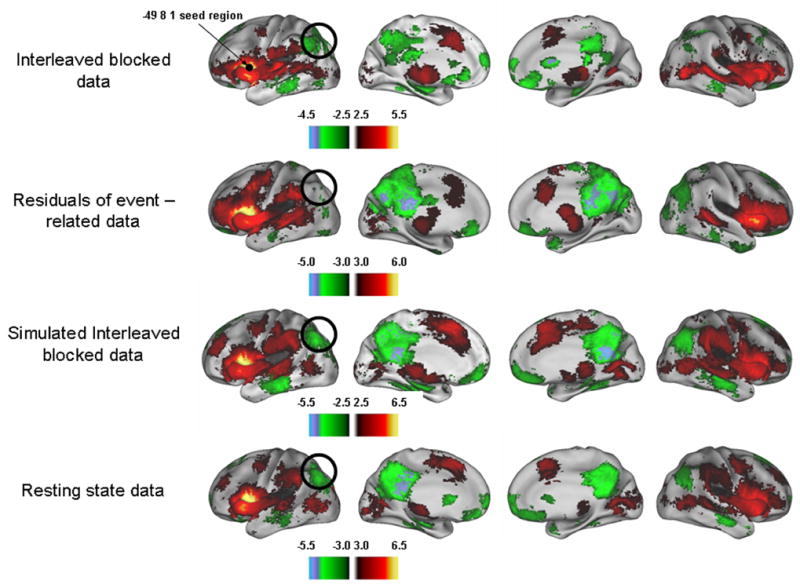
Random effects analyses provided qualitative comparisons between all data sets for each seed. Z-score maps of a sample seed region (−49, 8, 1) are provided here. Similar correlation profiles were observed across all data types; however, distinct differences were evident. Correlation coefficients tended to be slightly decreased in the interleaved data and the simulated interleaved data compared to the resting state data, yet few overt differences were seen (black circles), as was the case with the event-related data.
Figure 3.
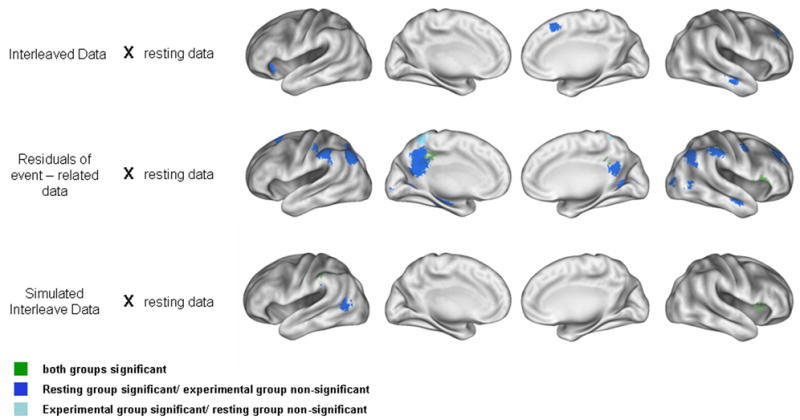
For each seed region direct comparisons were made by two-sample t-tests between each test group and the resting state data. The example seed region (−49, 8, 1) provided in Figure 2 is also the seed used here. Regions with significant interactions in both comparisons groups, but with relative differences are colored in green. Regions with significant correlations in the “continuous” resting state group but not the experimental group are colored in dark blue, while regions with significant correlations in the experimental group but not the “continuous” resting state group are colored in light blue. Few regions were identified as being different in the interleaved data or simulated interleaved data. Differences that were found tended to be a relative decrease in correlation as compared to the “continuous” resting data. More differences were found in the residuals derived from the event-related data. These differences were a combination of increased correlations in the residual data or increased correlations in the resting state data. A full description of these differences is provided in Table 2.
The direct comparisons between these groups across all 5 seed regions identified a total of 128 regions that were statistically different. Of these, 6 had an absolute z-score (herein: |z|) above 3 for correlations in both data sets, 59 had a |z| above 3 for the “continuous” resting state but not the event-related data, 54 regions had a |z| above 3 for the event-related data but not the “continuous” resting state data, and 9 regions had |z| above 3 for both datasets but originally with opposite signs (Table 2).
Table 2.
The number of regions significantly different between “continuous” resting state data and the experimental data for each seed region. Regions statistically different are subdivided by A) region of interest (rows) and B) the type of interaction (i.e. both groups have an absolute z – score above 3 with a relative difference, one group has a z – score above 3 but the other does not, or both have highly significant absolute z - scores above 3 but originally with opposite signs).
| Interleaved (I) vs rest (R) | Event related residuals (E) vs rest (R) | Simulated interleaved (SI) vs rest (R) | ||||||||||
|---|---|---|---|---|---|---|---|---|---|---|---|---|
| Seed Regions | I > 3 R > 3 | I < 3 R > 3 | I > 3 R < 3 | I > 3 R > 3 opp. signs | E > 3 R > 3 | E < 3 R > 3 | E > 3 R < 3 | E > 3 R > 3 opp. signs | SI > 3 R > 3 | SI < 3 R > 3 | SI > 3 R < 3 | SI > 3 R > 3 opp. signs |
| ROI 1: −49, 8, 1 | 0 | 3 | 2 | 0 | 2 | 23 | 1 | 0 | 2 | 2 | 0 | 0 |
| ROI 2: −40, −4, 34 | 0 | 4 | 1 | 1 | 1 | 7 | 23 | 1 | 0 | 0 | 0 | 0 |
| ROI 3: −9, −70, −11 | 0 | 3 | 2 | 0 | 0 | 15 | 13 | 6 | 1 | 2 | 1 | 0 |
| ROI 4: 39, −3, 33 | 1 | 5 | 0 | 0 | 1 | 5 | 13 | 1 | 0 | 2 | 0 | 0 |
| ROI 5: 16, −35, 52 | 0 | 6 | 1 | 0 | 2 | 9 | 4 | 1 | 1 | 3 | 1 | 0 |
| Total | 1 | 21 | 6 | 1 | 6 | 59 | 54 | 9 | 4 | 9 | 2 | 0 |
| Additional seed region analyzed on event-related data without any task induced activity | ||||||||||||
| −1, 47, −4 | - | - | - | - | 1 | 27 | 9 | 0 | - | - | - | - |
The types of differences seen across all the ROIs were not homogeneous. For example, for ROI1 (−49, 8,1) the majority of the regions that showed differences between the event-related data residuals and the “continuous” resting state data were a result of a significant correlation for the “continuous” resting data but not the event-related data residuals (Table 2, Figure 4). For ROI2 (−40, −4, 34) differences were largely driven by a correlation in the event-related residuals not found in the “continuous” resting data (Table 2, Figure 4).
Figure 4.
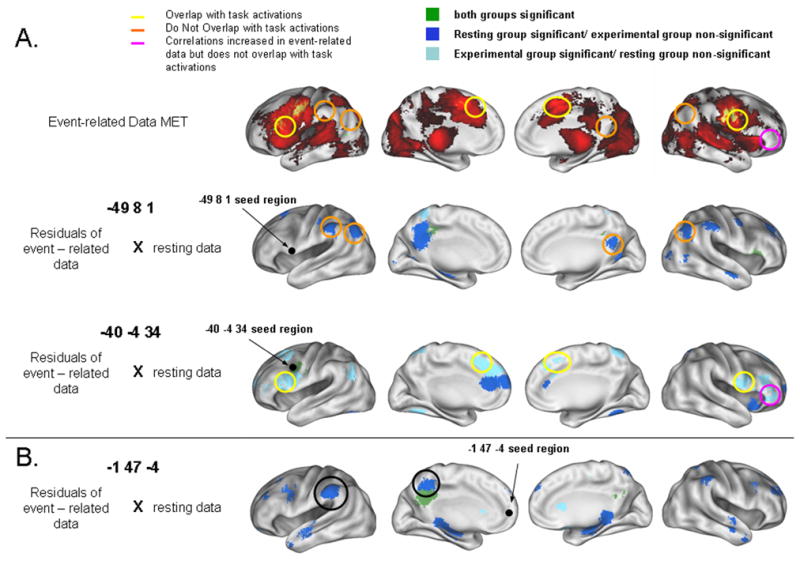
A) To test if the regions that were significantly different in the event-related residual data compared to the “continuous” resting state data coincided with task induced activity, we qualitatively compared them with the main effect of time (ANOVA) image (prior to task removal) that represents the task activity for this dataset. Many of the regions that showed a significant correlation with the seed for the event-related residuals (and not the resting data) (light blue) overlapped with the task induced activation (yellow circles). Regions showing a correlation for the resting data but not the event-related residuals (dark blue) conversely mostly did not overlap with the task induced activations (orange circles). An exception to these general trends is circled in pink. B) To test if the functional connectivity profiles differ for regions without task-related activity, an additional region (−1, 47, −4) was analyzed. The direct comparison between the event-related data residuals and the “continuous” resting state data showed a similar pattern of differences between the data sets as for the other seed regions (see Table 2).
To see if these regions coincided with task induced activity prior to task removal, we qualitatively compared them with the main effect of time ANOVA image (prior to task removal) that represents the task activity for this dataset (Figure 4). Many of the regions that did show a significant correlation derived from the event-related data (and not the resting data) did overlap with the task induced activations (see Figure 4); while, regions which showed a correlation for the resting data (and not the event-related residuals) did not overlap with the task induced activations.
To see if the functional connectivity profiles are affected when regions without task-related activity are used as seeds, an additional region (−1, 47, −4) was analyzed with the event-related design residuals. This seed showed a similar overall pattern of results as the other seeds. A total of 37 regions showed differences. Of these one had an |z| above 3 for correlations in both datasets but with a relative difference. Nine regions had an |z| above 3 for the event-related residual data, but not the resting state data, and 27 regions had an |z| above 3 for the resting state data, but not the residual data (Table 2). Interestingly, some of the differences observed with this seed were in regions known to be functionally connected during rest (Fox et al., 2005).
Interleaved resting blocks from mixed blocked/event-related data
The group comparisons between interleaved resting state data and “continuous” resting state data across all 5 of the seed regions were very similar, with even less distinct qualitative differences than the evet-related data residuals (Table 2, Figure 2).
The direct comparisons identified a total of 29 regions that showed statistical differences between the two data sets. Of these, one had an |z| above 3 for both data sets, 21 regions showed a |z| above 3 for the continuous but not the interleaved data, 6 regions had a |z| above 3 for the interleaved but not the continuous data, and 1 region had |z| above 3 for both datasets but with opposing signs (Table 2).
The direct comparisons showed very few differences for all the seed regions. Differences across all of the seed regions tended to be driven by slightly more significance correlations for the continuous than the interleaved resting state data (Table 2, Figure 3).
Simulated interleaved resting state data
The simulated interleaved data was analyzed to determine the effects of splitting and concatenating resting state data independent of having performed a prior task. As with the interleaved resting state data, the simulated interleaved data was qualitatively very similar to the continuous resting state data (Table 2, Figure 2).
The direct comparisons across all five seed regions identified a total of 15 regions as being statistically different. Of these, four had an absolute z-score above 3 for correlations with both data sets, nine had a |z| above 3 for the resting state but not the simulated block data, two regions had a |z| above 3 for the simulated interleaved data but not the continuous resting state data, and no regions had |z| above 3 for both datasets but originally with opposite signs (Table 2).
As with the interleaved resting epochs, differences across all of the seed regions tended to be driven by slightly more significance correlations for the continuous resting data than the simulated interleaved resting state data (Table 2, Figure 3).
DISCUSSION
In this paper, we examined resting state functional connectivity using two methods that utilize existing event-related and blocked fMRI data. In both methods we attempt to remove the task effects and compare these data to a set of data collected as “continuous” resting state. Both methods produced qualitatively similar results. However, based on the direct comparisons, the interleaved resting state data was superior at emulating “continuous” resting state data.
Residuals derived from event-related data
Although the general linear model (GLM) approach used here successfully removed the linear task effects from the event-related data (Supplementary Figure), and the correlation profiles between the “continuous” resting state data and the event-related residuals were qualitatively mostly similar (Figure 2), differences did exist. In some regions the “continuous” resting data had higher correlation coefficients. This finding might be explained in part by other fMRI and EEG data that suggests that task engagement attenuates spontaneous signals compared to rest (Fransson, 2006; Klimesch et al., 1999; Niedermeyer, 2005). Because event-related tasks continue throughout the entire run, an attenuation of the spontaneous BOLD fluctuations may have resulted in a decrease in the correlation coefficients.
While few, there were some regions that differed from the “continuous” resting state data in that the significant correlation with the seed region was of the opposite sign. Several other regions were identified where the correlations were significant for the even-related residuals, but not the resting state data. These types of differences cannot be explained by a simple attenuation in signal. It was also evident that these differences often, but not always, overlapped with the task induced activation of the data (Figure 4). This overlap may suggest that although linear task effects are being removed successfully in this paradigm, some nonlinear effects may still be affecting the correlation coefficients.
Another account that may explain the differences seen between these two types of data revolves around the underlying source of the coherent BOLD activity at rest. Although it is likely that relaxed fixation periods used for resting state functional connectivity represent a reasonable estimate of “baseline activity” (Raichle and Mintun, 2006), some argue that this is not the case (Stark and Squire, 2001). Because of this view, it has been suggested that uncontrollable sensory or cognitive activations during rest can alter functional connectivity cross - correlation profiles by “contaminating” the spontaneous signal fluctuations with internal “task-like” processing (Arfanakis et al., 2000). Although uncontrollable sensory and cognitive events are likely not the predominant source of coherent BOLD fluctuations during rest (for details see (Fox et al., 2006a; Nir et al., 2006)), it is possible that they might account for some of the differences seen here in this analysis. If the resting subjects in this study were all intermittently performing similar internal tasks that differed from those performed by subjects during the event-related lexical processing task, correlation differences, comparable to what was observed in this investigation, may result.
An alternative view is that interregional functional connectivity may be partly altered when engaged in a task. Hampson et al (Hampson et al., 2004) found that although dorsal cuneus, lingual gyrus, and thalamus were functionally connected to MT/V5, they were not co-activated during a motion task that activated MT/V5 and the middle occipital gyrus. They also found that during the task connectivity remained strong between MT/V5 and the middle occipital gyrus, yet decreased in other regions that were not activated by the task. This result is similar to our results in that, even after removing the task signal, regions that were correlated with the seed region but were not commonly activated in the task tended to have decreased correlation coefficients.
Another study by Lowe et al (Lowe et al., 2000) found that of the regions that correlate with the DLPFC at rest, those involved with working memory tended to increase their correlations with DLPFC during a working memory task. In contrast, motor regions were more strongly correlated with the DLPFC during a finger tapping task. This set of results is also consistent with our data which, in general, showed an increase in the correlation coefficients in regions that tended to be involved in the task. Conceivably, independent of task, interregional correlations may be altered during task states such that correlated spontaneous neural activity strengthens in task-induced areas and weakens in non-task-induced areas.
The idea that the underlying interregional correlated activity can be modified during task states is, in part, supported by our findings when using a seed region that has no task-related activity. These results showed that interregional correlations can be altered during task states independent of the task-related activity. Regions that are known to have correlated activity with the “default system” seed region used here show significant differences when subjects were engaged in the lexical tasks of the event-related data. Similar types of findings have been noted elsewhere (Fransson, 2006).
The experimental design of this analysis was not intended to determine whether the differences observed are a reflection of signal attenuation, remnants of task effects, variation in self-initiated intermittent cognitive operations, or an indication that task engagement alters the underlying interregional relationships. However, distinguishing between these possibilities has meaningful implications and is currently being explored.
The ability to remove nonlinear task effects is the greatest limitation of the GLM design for simulating “resting state” data from an event-related design dataset. Other methods that have been used successfully to remove task induced variance in blocked designs, such as independent component analysis (ICA) (Arfanakis et al., 2000), may provide alternatives to the GLM approach used here. However, the ICA approach has limitations of its own. First, removing the task to simulate “resting state” data for functional connectivity has, thus far, only been successfully applied to blocked designs (Arfanakis et al., 2000), not event-related datasets as used here. Second, the success of the ICA approach is also dependent on elaborate methods to remove the correct components that correspond to task activation. This process can be very difficult and time consuming (Arfanakis et al., 2000). Lastly, if brain regions outside of primary sensory and motor cortices show modifications of their functional connectivity profiles during task periods, then the use of either ICA or the GLM method to remove task induced variance for the purposes of simulating “resting state” data for functional connectivity analyses will have significant shortcomings.
Resting periods interleaved with task periods
The interleaved resting state data faired better in our attempt to simulate “continuous” resting state data. Direct comparisons found minimal differences. Most differences were the consequence of the “continuous” resting state having slightly higher correlation coefficients. This suggests that inter-regional correlations for interleaved data may be slightly decreased, although even this appears minor. Our analyses also addressed the question of whether spontaneous resting state activity is affected by previous behavior (Waites et al., 2005). Our data showed that across several subjects, the correlation coefficients were largely unaffected by the presence of a previous task. When compared to the “continuous” resting state data, both the interleaved and the simulated interleaved data showed mostly similarities with few differences. The only consistent difference was a relative decrease in the magnitude of some correlation coefficients. Based on previous results (Salvador et al., 2005), this minimal decrease was likely due to the narrowed frequency range analyzed secondary to the splicing. Although minor differences can not be ruled out, it is unlikely that functional connectivity of the resting epochs is considerably changed by intermittent task performance.
These results suggest that the interleaved resting state data such as those taken from blocked or mixed blocked/event-related fMRI designs are well-suited for resting state functional connectivity analyses.
Summary and Conclusions
In this report we show that despite some differences, the functional connectivity for the interleaved resting periods taken from blocked designs is both qualitatively and quantitatively very similar to that of “continuous” resting state data. These data showed highly reliable and plausible functional connectivity profiles and support the use of this method with task datasets for resting state functional connectivity analyses. In contrast, despite being qualitatively similar to “continuous” resting state data, residuals derived from event-related design data had several distinct quantitative differences. Although using event-related data residuals for resting state functional connectivity may still be useful, results should be interpreted with care.
Supplementary Material
Acknowledgments
The authors thank the participants in this study, as well as Jessica Church for logistical aid, Mark McAvoy for neuroimaging application development, and David Van Essen and his colleagues for the use of CARET for figures. This work was supported in part by the Washington University Chancellor’s Fellowship and UNCF * Merck Graduate Science Research Dissertation Fellowship to Damien Fair and by NIH NSADA (B.L.S.), NS32979 (S.E.P.), NS41255 (S.E.P.), NS46424 (S.E.P.), The McDonnell Center for Higher Brain function (S.E.P., B.L.S.), and The Charles A. Dana Foundation (B.L.S.).
Footnotes
Publisher's Disclaimer: This is a PDF file of an unedited manuscript that has been accepted for publication. As a service to our customers we are providing this early version of the manuscript. The manuscript will undergo copyediting, typesetting, and review of the resulting proof before it is published in its final citable form. Please note that during the production process errors may be discovered which could affect the content, and all legal disclaimers that apply to the journal pertain.
References
- Arfanakis K, Cordes D, Haughton VM, Moritz CH, Quigley MA, Meyerand ME. Combining independent component analysis and correlation analysis to probe interregional connectivity in fMRI task activation datasets. Magn Reson Imaging. 2000;18:921–930. doi: 10.1016/s0730-725x(00)00190-9. [DOI] [PubMed] [Google Scholar]
- Bellec P, Perlbarg V, Jbabdi S, Pelegrini-Issac M, Anton JL, Doyon J, Benali H. Identification of large-scale networks in the brain using fMRI. Neuroimage. 2006;29:1231–1243. doi: 10.1016/j.neuroimage.2005.08.044. [DOI] [PubMed] [Google Scholar]
- Biswal B, Yetkin F, Haughton V, Hyde J. Functional connectivity in the motor cortex of resting human brain using echo-planar MRI. Magnetic Resonance in Medicine. 1995;34:537–541. doi: 10.1002/mrm.1910340409. [DOI] [PubMed] [Google Scholar]
- Bokde AL, Lopez-Bayo P, Meindl T, Pechler S, Born C, Faltraco F, Teipel SJ, Moller HJ, Hampel H. Functional connectivity of the fusiform gyrus during a face-matching task in subjects with mild cognitive impairment. Brain. 2006;129:1113–1124. doi: 10.1093/brain/awl051. [DOI] [PubMed] [Google Scholar]
- Bokde AL, Tagamets MA, Friedman RB, Horwitz B. Functional interactions of the inferior frontal cortex during the processing of words and word-like stimuli. Neuron. 2001;30:609–617. doi: 10.1016/s0896-6273(01)00288-4. [DOI] [PubMed] [Google Scholar]
- Brown TT, Lugar HM, Coalson RS, Miezin FM, Petersen SE, Schlaggar BL. Developmental changes in human cerebral functional organization for word generation. Cerebral Cortex. 2005;15:275–290. doi: 10.1093/cercor/bhh129. [DOI] [PubMed] [Google Scholar]
- Buchel C, Friston KJ. Modulation of connectivity in visual pathways by attention: cortical interactions evaluated with structural equation modelling and fMRI. Cerebral Cortex. 1997;7:768–778. doi: 10.1093/cercor/7.8.768. [DOI] [PubMed] [Google Scholar]
- Bullmore E, Horwitz B, Honey G, Brammer M, Williams S, Sharma T. How good is good enough in path analysis of fMRI data? Neuroimage. 2000;11:289–301. doi: 10.1006/nimg.2000.0544. [DOI] [PubMed] [Google Scholar]
- Clark CM, Kessler R, Buchsbaum MS, Margolin RA, Holcomb HH. Correlational methods for determining regional coupling of cerebral glucose metabolism: a pilot study. Biological Psychiatry. 1984;19:663–678. [PubMed] [Google Scholar]
- Fair DA, Brown TT, Petersen SE, Schlaggar BL. A comparison of ANOVA and correlation methods for investigating cognitive development with fMRI. Developmental Neuropsychology. 2006;30:531–546. doi: 10.1207/s15326942dn3001_2. [DOI] [PubMed] [Google Scholar]
- Forman SD, Cohen JD, Fitzgerald M, Eddy WF, Mintun MA, Noll DC. Improved assessment of significant activation in functional magnetic resonance imaging (fMRI): Use of a cluster-size threshold. Magnetic Resonance in Medicine. 1995;33:636–647. doi: 10.1002/mrm.1910330508. [DOI] [PubMed] [Google Scholar]
- Fox MD, Corbetta M, Snyder AZ, Vincent JL, Raichle ME. Spontaneous neuronal activity distinguishes human dorsal and ventral attention systems. Proceedings of National Academy of Sciences, USA. 2006a;103:10046–10051. doi: 10.1073/pnas.0604187103. [DOI] [PMC free article] [PubMed] [Google Scholar]
- Fox MD, Snyder AZ, Vincent JL, Corbetta M, Van Essen DC, Raichle ME. The human brain is intrinsically organized into dynamic, anticorrelated functional networks. Proceedings of National Academy of Sciences, USA. 2005;102:9673–9678. doi: 10.1073/pnas.0504136102. [DOI] [PMC free article] [PubMed] [Google Scholar]
- Fox MD, Snyder AZ, Zacks JM, Raichle ME. Coherent spontaneous activity accounts for trial-to-trial variability in human evoked brain responses. Nature Neuroscience. 2006b;9:23–25. doi: 10.1038/nn1616. [DOI] [PubMed] [Google Scholar]
- Fransson P. Spontaneous low-frequency BOLD signal fluctuations: an fMRI investigation of the resting-state default mode of brain function hypothesis. Human Brain Mapping. 2005;26:15–29. doi: 10.1002/hbm.20113. [DOI] [PMC free article] [PubMed] [Google Scholar]
- Fransson P. How default is the default mode of brain function? Further evidence from intrinsic BOLD signal fluctuations. Neuropsychologia. 2006 doi: 10.1016/j.neuropsychologia.2006.06.017. [DOI] [PubMed] [Google Scholar]
- Friston KJ, Frith CD, Frackowiak RSJ. Time-dependent changes in effective connectivity measured with PET. Human Brain Mapping. 1993a;1:69–80. [Google Scholar]
- Friston KJ, Frith CD, Liddle PF, Frackowiak RSJ. Functional connectivity: The principal-component analysis of large (PET) data sets. Journal of Cerebral Blood Flow and Metabolism. 1993b;13:5–14. doi: 10.1038/jcbfm.1993.4. [DOI] [PubMed] [Google Scholar]
- Goncalves MS, Hall DA, Johnsrude IS, Haggard MP. Can meaningful effective connectivities be obtained between auditory cortical regions? Neuroimage. 2001;14:1353–1360. doi: 10.1006/nimg.2001.0954. [DOI] [PubMed] [Google Scholar]
- Greicius MD, Krasnow B, Reiss AL, Menon V. Functional connectivity in the resting brain: a network analysis of the default mode hypothesis. Proceedings of National Academy of Sciences, USA. 2003;100:253–258. doi: 10.1073/pnas.0135058100. [DOI] [PMC free article] [PubMed] [Google Scholar]
- Greicius MD, Srivastava G, Reiss AL, Menon V. Default-mode network activity distinguishes Alzheimer’s disease from healthy aging: evidence from functional MRI. Proceedings of National Academy of Sciences, USA. 2004;101:4637–4642. doi: 10.1073/pnas.0308627101. [DOI] [PMC free article] [PubMed] [Google Scholar]
- Hampson M, Olson IR, Leung HC, Skudlarski P, Gore JC. Changes in functional connectivity of human MT/V5 with visual motion input. Neuroreport. 2004;15:1315–1319. doi: 10.1097/01.wnr.0000129997.95055.15. [DOI] [PubMed] [Google Scholar]
- Hampson M, Peterson BS, Skudlarski P, Gatenby JC, Gore JC. Detection of functional connectivity using temporal correlations in MR images. Human Brain Mapping. 2002;15:247–262. doi: 10.1002/hbm.10022. [DOI] [PMC free article] [PubMed] [Google Scholar]
- Horwitz B. The elusive concept of brain connectivity. Neuroimage. 2003;19:466–470. doi: 10.1016/s1053-8119(03)00112-5. [DOI] [PubMed] [Google Scholar]
- Horwitz B, Duara R, Rapoport SI. Intercorrelations of glucose metabolic rates between brain regions: application to healthy males in a state of reduced sensory input. Journal of Cerebral Blood Flow and Metabolism. 1984;4:484–499. doi: 10.1038/jcbfm.1984.73. [DOI] [PubMed] [Google Scholar]
- Horwitz B, Grady CL, Haxby JV, Ungerleider LG, Schapiro MB, Mishkin M, Rapoport SI. Functional associations among human posterior extrastriate brain regions during object and spatial vision. J Cogn Neuroscience. 1992;4:311–322. doi: 10.1162/jocn.1992.4.4.311. [DOI] [PubMed] [Google Scholar]
- Horwitz B, Warner B, Fitzer J, Tagamets MA, Husain FT, Long TW. Investigating the neural basis for functional and effective connectivity. Application to fMRI. Philos Trans R Soc Lond B Biol Sci. 2005;360:1093–1108. doi: 10.1098/rstb.2005.1647. [DOI] [PMC free article] [PubMed] [Google Scholar]
- Klimesch W, Doppelmayr M, Schwaiger J, Auinger P, Winkler T. ‘Paradoxical’ alpha synchronization in a memory task. Brain Res Cogn Brain Res. 1999;7:493–501. doi: 10.1016/s0926-6410(98)00056-1. [DOI] [PubMed] [Google Scholar]
- Koch MA, Norris DG, Hund-Georgiadis M. An investigation of functional and anatomical connectivity using magnetic resonance imaging. Neuroimage. 2002;16:241–250. doi: 10.1006/nimg.2001.1052. [DOI] [PubMed] [Google Scholar]
- Lee L, Harrison LM, Mechelli A. A report of the functional connectivity workshop, Dusseldorf 2002. Neuroimage. 2003;19:457–465. doi: 10.1016/s1053-8119(03)00062-4. [DOI] [PubMed] [Google Scholar]
- Leopold DA, Murayama Y, Logothetis NK. Very slow activity fluctuations in monkey visual cortex: implications for functional brain imaging. Cerebral Cortex. 2003;13:422–433. doi: 10.1093/cercor/13.4.422. [DOI] [PubMed] [Google Scholar]
- Lowe MJ, Dzemidzic M, Lurito JT, Mathews VP, Phillips MD. Correlations in low-frequency BOLD fluctuations reflect cortico-cortical connections. Neuroimage. 2000;12:582–587. doi: 10.1006/nimg.2000.0654. [DOI] [PubMed] [Google Scholar]
- Metter EJ, Riege WH, Kameyama M, Kuhl DE, Phelps ME. Cerebral metabolic relationships for selected brain regions in Alzheimer’s, Huntington’s, and Parkinson’s diseases. Journal of Cerebral Blood Flow and Metabolism. 1984a;4:500–506. doi: 10.1038/jcbfm.1984.74. [DOI] [PubMed] [Google Scholar]
- Metter EJ, Riege WH, Kuhl DE, Phelps ME. Cerebral metabolic relationships for selected brain regions in healthy adults. Journal of Cerebral Blood Flow and Metabolism. 1984b;4:1–7. doi: 10.1038/jcbfm.1984.1. [DOI] [PubMed] [Google Scholar]
- Miezin F, Maccotta L, Ollinger J, Petersen S, Buckner R. Characterizing the hemodynamic response: Effects of presentation rate, sampling procedure, and the possibility of ordering brain activity based on relative timing. Neuroimage. 2000a;11:735–759. doi: 10.1006/nimg.2000.0568. [DOI] [PubMed] [Google Scholar]
- Miezin FM, Maccotta L, Ollinger JM, Petersen SE, Buckner RL. Characterizing the hemodynamic response: Effects of presentation rate, sampling procedure, and the possibility of ordering brain activity based on relative timing. Neuroimage. 2000b;11:735–759. doi: 10.1006/nimg.2000.0568. [DOI] [PubMed] [Google Scholar]
- Niedermeyer E. Ultrafast EEG activities and their significance. Clin EEG Neurosci. 2005;36:257–262. doi: 10.1177/155005940503600404. [DOI] [PubMed] [Google Scholar]
- Nir Y, Hasson U, Levy I, Yeshurun Y, Malach R. Widespread functional connectivity and fMRI fluctuations in human visual cortex in the absence of visual stimulation. Neuroimage. 2006;30:1313–1324. doi: 10.1016/j.neuroimage.2005.11.018. [DOI] [PubMed] [Google Scholar]
- Prohovnik I, Hakansson K, Risberg J. Observations on the functional significance of regional cerebral blood flow in “resting” normal subjects. Neuropsychologia. 1980;18:203–217. doi: 10.1016/0028-3932(80)90066-4. [DOI] [PubMed] [Google Scholar]
- Pugh KR, Mencl WE, Shaywitz BA, Shaywitz SE, Fulbright RK, Constable RT, Skudlarski P, Marchione KE, Jenner AR, Fletcher JM, Liberman AM, Shankweiler DP, Katz L, Lacadie C, Gore JC. The angular gyrus in developmental dyslexia: task-specific differences in functional connectivity within posterior cortex. Psychol Sci. 2000;11:51–56. doi: 10.1111/1467-9280.00214. [DOI] [PubMed] [Google Scholar]
- Quigley M, Cordes D, Turski P, Moritz C, Haughton V, Seth R, Meyerand ME. Role of the corpus callosum in functional connectivity. AJNR Am J Neuroradiol. 2003;24:208–212. [PMC free article] [PubMed] [Google Scholar]
- Raichle ME, Mintun MA. Brain work and brain imaging. Annual Review of Neuroscience. 2006;29:449–476. doi: 10.1146/annurev.neuro.29.051605.112819. [DOI] [PubMed] [Google Scholar]
- Rombouts S, Scheltens P. Functional connectivity in elderly controls and AD patients using resting state fMRI: a pilot study. Curr Alzheimer Res. 2005;2:115–116. doi: 10.2174/1567205053585783. [DOI] [PubMed] [Google Scholar]
- Salvador R, Suckling J, Coleman MR, Pickard JD, Menon D, Bullmore E. Neurophysiological architecture of functional magnetic resonance images of human brain. Cerebral Cortex. 2005;15:1332–1342. doi: 10.1093/cercor/bhi016. [DOI] [PubMed] [Google Scholar]
- Schlaggar BL, Brown TT, Lugar HM, Visscher KM, Miezin FM, Petersen SE. Functional neuroanatomical differences between adults and school-age children in the processing of single words. Science. 2002;296:1476–1479. doi: 10.1126/science.1069464. [DOI] [PubMed] [Google Scholar]
- Stark CE, Squire LR. When zero is not zero: the problem of ambiguous baseline conditions in fMRI. Proceedings of National Academy of Sciences, USA. 2001;98:12760–12766. doi: 10.1073/pnas.221462998. [DOI] [PMC free article] [PubMed] [Google Scholar]
- Talairach J, Tournoux P. Co-Planar Stereotaxic Atlas of the Human Brain. Thieme Medical Publishers, Inc.; New York: 1988. [Google Scholar]
- Tian L, Jiang T, Wang Y, Zang Y, He Y, Liang M, Sui M, Cao Q, Hu S, Peng M, Zhuo Y. Altered resting-state functional connectivity patterns of anterior cingulate cortex in adolescents with attention deficit hyperactivity disorder. Neuroscience Letters. 2006;400:39–43. doi: 10.1016/j.neulet.2006.02.022. [DOI] [PubMed] [Google Scholar]
- Waites AB, Stanislavsky A, Abbott DF, Jackson GD. Effect of prior cognitive state on resting state networks measured with functional connectivity. Human Brain Mapping. 2005;24:59–68. doi: 10.1002/hbm.20069. [DOI] [PMC free article] [PubMed] [Google Scholar]
- Wenger KK, Miezin FM, Petersen SE, Schlaggar BL. Implementation of the mixed block/event-related fMRI design to study the development of sustained activity in a semantic judgement task. Cognitive Neuroscience Society; New York, NY: 2005. [Google Scholar]
- Whalley HC, Simonotto E, Marshall I, Owens DG, Goddard NH, Johnstone EC, Lawrie SM. Functional disconnectivity in subjects at high genetic risk of schizophrenia. Brain. 2005;128:2097–2108. doi: 10.1093/brain/awh556. [DOI] [PubMed] [Google Scholar]
Associated Data
This section collects any data citations, data availability statements, or supplementary materials included in this article.