

Abstract
Current research of risk factors potentially associated with successful aging faces the difficulty of taking into consideration two distinct outcome measures: survival and functioning. Previous studies either used successful aging measures restricted to survivors or presented more than one outcome measure to handle the dual outcome. This article illustrates the utility of health expectancy measures, based on life tables, to integrate the effects of survival and functioning across all ages. It is shown that three hypothetical successful aging strategies, considered equally successful according to the traditional measures restricted to survivors, are associated with vastly different changes in the years lived with and without disability. Furthermore, the intervention considered most successful when considering multiple successful aging measures, was associated with the largest increase in the time lived with disability. It is recommended that research on successful aging should be based on summary measures of population health that reflect both survival and functioning throughout life. These will provide more relevant information than is currently available for individuals and societies to evaluate and choose between successful aging strategies.
Keywords: successful aging, disability, mortality
Modern societies have witnessed a revolutionary life extension over the past two centuries. Since the middle of the 1800s life expectancy has increased by more than 30 years in the world's low mortality countries.1 Having achieved such successful reductions in mortality, many societies recognise the need to also address the challenges of increasing longevity. The primary challenge is the burden to the person and society associated with the cognitive and physical losses of the aged.
In an influential paper, Rowe and Kahn2 suggested that the rate of age associated functional decline is not solely related to age, but also to factors such as environment, lifestyle, and psychosocial influences, which are extrinsic to the aging process. Rowe and Kahn advocated exploiting the observed heterogeneity between individuals to make a distinction between usual aging, in which extrinsic factors heighten the effects of aging alone, and successful aging, in which extrinsic factors play a neutral or positive part. In essence, successful agers are those who experience little or no loss in function relative to the average of their younger counterparts.2 This has in turn led to research and policy agendas aimed at identifying and changing modifiable factors that moderate the aging process, with the ultimate goal of reducing the burden of death, disability, and health care costs.3,4,5,6,7 These successful aging research and policy agendas are also known as “active aging”, “healthy aging”, “productive aging”, “better aging”, and “aging well”, and we use these terms interchangeably.
Several studies have examined behavioural factors that may predict successful aging based on prospective data.8,9,10,11,12,13,14,15,16 A difficulty faced in these studies, however, is that successful aging is difficult to measure, primarily because it involves two distinct outcome measures: survival and functioning.11 Studies differ in the way they handle this dual outcome when trying to identify risk factors potentially associated with successful aging. Some ignore survival and compare healthy survivors with unhealthy survivors.9,15,16 Others present more than one comparison, for example, survivors with non‐survivors and healthy survivors with unhealthy survivors,11,14 healthy survivors with all other (unhealthy survivors and death together) and healthy survivors with unhealthy survivors,8 or healthy survivors with unhealthy survivors and with deaths.10 As often the behavioural factors affect both survival and functioning, it would obviously be preferable to take into account these two effects simultaneously when assessing the effect of a specific behavioural factor. Health expectancy measures, such as life expectancy with and without disability, take into account both survival and functioning until death.17,18,19,20,21,22,23
The aim of this paper is to illustrate the use of health expectancy measures, such as life expectancy with(out) disability, to assist assessment of and choice between potential successful aging interventions. Health expectancy measures, based on life tables, can be derived from prospective datasets commonly used in successful aging research. We show the added value of these measures relative to the traditional successful aging measures, by comparing the healthy aging effect of three hypothetical interventions. These interventions mimic the effect of exposure to three risk factors that equally affect functioning but differ in their effect on mortality.
Illustration
Multi‐state life table, its transition rates and outcome measures
We use a non‐hierarchical multi‐state life table consisting of three states: “no disability”, “disability”, and “death”. The multi‐state life table is the standard method to calculate health expectancy measures from prospective data. The multi‐state life table (increment‐decrement life table) is an extension of the standard single decrement life table used to calculate life expectancy, and can be described as a finite space, continuous time Markov model.24 In a non‐hierarchical model, re‐entry in a given health state is permitted.
The multi‐state life table is based on age specific transition rates between “no disability” and “disability” and from “no disability” and “disability” to “death”. For this illustration, any set of age specific transition rates and any non‐hierarchical population based multi‐state life table programme to calculate life expectancy with(out) disability can be used. The transition rates used in this paper were originally derived for the Netherlands in the second half of the 1980s from prospective data. The equations and parameters of these transition rates are presented in appendix 1A. Detailed information on the estimation of the transition rates and original data sources is given elsewhere.22,25 The multi‐state life table for the illustration was programmed in Excel, but software programs for the multi‐state life table, such as IMaCh26,27 can also be used. While in this illustration we do not present confidence intervals, confidence intervals are provided by the IMaCh software or can be derived using bootstrapping, for example, with @RISK (anonymous 2000; MathSoft Inc 1999), or by using the delta method.28
For the ease of interpretation and comparability with other studies on successful aging we started the life table with a population free of disability at age 70, but any age and any disability prevalence can be analysed using this method. The life table was closed at age 120 and was used to calculate life expectancy without and with disability, and total life expectancy at age 70. The two most widely used traditional successful aging measures were derived from the same life table to maximise comparability. The first measure is the proportion remaining alive and non‐disabled (or healthy) at follow up. The second measure is the proportion of survivors that is non‐disabled at follow up. We present these measures for a period of 10 years of follow up. Appendix 1B and 1C give the equations used to calculate health expectancy measures and the traditional successful aging measures, respectively.
Baseline situation
We consider the baseline situation as “normal aging”. With increasing age the probability of developing disability increases, as does the probability of dying from both the non‐disabled and the disabled state. The probability of recovering from disability decreases with increasing age (fig 1). For this normal Dutch population, after 10 years 56% of the 70 year old non‐disabled men will be still alive and 31% will be alive and non‐disabled (table 1). Of the survivors, 56% will be non‐disabled after 10 years. For women the percentage still alive after 10 years is higher (73%), but the percentage non‐disabled is the same to men, and of the survivors the percentage non‐disabled is lower (42%). The health expectancy measures presented in table 2, combine information on survival and disability across all ages above age 70. At age 70, total life expectancy is 11.5 years for men and 15.2 years for women. Of these years, men and women both spend about 7.5 years free of disability and 3.9 years (men) and almost 7.7 years (women) with disability.

Figure 1 (A) Age specific transition rates for men. (B) Age specific transition rates for women.
Table 1 Successful aging outcome measures after 10 years of follow up, by sex.
| Sex | (1) Proportion alive and non‐disabled | (2A) Proportion non‐disabled relative to all survivors | (2B) Proportion alive |
|---|---|---|---|
| Baseline | |||
| Men | 0.31 | 0.56 | 0.56 |
| Women | 0.31 | 0.42 | 0.73 |
| (1) Five years delayed disability and five years delayed mortality rates | |||
| Men | 0.49 | 0.69 | 0.71 |
| Women | 0.47 | 0.56 | 0.84 |
| (2) Five years delayed disability and no change in mortality rates | |||
| Men | 0.41 | 0.69 | 0.59 |
| Women | 0.43 | 0.57 | 0.76 |
| (3) Five years delayed disability and 10 years delayed mortality rates | |||
| Men | 0.54 | 0.68 | 0.80 |
| Women | 0.49 | 0.55 | 0.89 |
Table 2 Change in total life expectancy (LE), disability free life expectancy (DFLE), life expectancy with disability (LwD), and percentage of life disabled associated with three hypothetical successful aging interventions, relative to baseline.
| LE (y) | DFLE (y) | LwD (y) | Percentage of life disabled* | |
|---|---|---|---|---|
| Baseline (life expectancy measures at age 70) | ||||
| Men | 11.5 | 7.6 | 3.9 | 34.1 |
| Women | 15.2 | 7.5 | 7.7 | 50.4 |
| (1) Five year delayed disability and five years delayed mortality rates | ||||
| Men | 3.2 | 2.7 | 0.5 | −4.2 |
| Women | 3.7 | 2.7 | 1.0 | −4.4 |
| (2) Five years delayed disability and no change in mortality rates | ||||
| Men | 0.5 | 1.4 | −0.9 | −8.6 |
| Women | 0.7 | 1.9 | −1.2 | −9.8 |
| (3) Five year delayed disability and 10 years delayed mortality rates | ||||
| Men | 5.9 | 3.8 | 2.1 | 0.5 |
| Women | 6.8 | 3.2 | 3.6 | 0.7 |
*Person years with disability (⩾70 years)/person years alive (⩾70 years).
Successful aging interventions
In comparison with this “normal aging” baseline scenario, we model three potential successful aging interventions, each of which has the same age shift in disability rates, but different shifts in mortality rates. We compare the outcome measures of each intervention with the baseline situation.
In the first scenario we assume that after the intervention, the entire population consists of successful agers, equivalent in all ways to five year younger normal agers. That is, we imagine a successful aging intervention in which the population experiences the disability, recovery, and mortality rates of five year younger normal agers. In essence, a 70 year old “successful ager” would have the remaining disability and mortality experience of a 65 year old normal ager, and so on. This implies a reduction in the rates of functional loss and death and an increase in the rates of functional regain equivalent to being five years younger. The second and third interventions have a different degree of mortality risk reduction. In the second there is no change in mortality risks, mimicking a factor that exclusively affects functional ability. In the third the mortality rate reduction is comparable to a 10 year younger normal ager, mimicking a factor with a greater delay in mortality than in functioning.
Traditional measure
Table 1 compares the three interventions with a baseline situation of no change based on the two most widely used successful aging measures. While the proportion remaining alive and non‐disabled (or healthy) after 10 years is 0.31 for the baseline scenario, it increases to 0.41 (men) and 0.43 (women) when disability alone is delayed (by five years) (intervention 2), to 0.49 (men) and 0.47 (women) when both disability and mortality are delayed by five years (intervention 1), and to 0.54 (men) and 0.49 (women) when disability is delayed by five years and mortality by 10 years (intervention 3).
The second measure of healthy aging used (the proportion of survivors that is non‐disabled after 10 years) (table 1, measure 2A) shows that while in the baseline scenario the proportion of healthy agers is 0.56 (men) and 0.42 (women), in all three interventions the proportion is virtually the same: about 0.69 (men) and 0.55 (women). That is, based on this measure, the three successful aging interventions would be rated as equally successful. Some successful aging studies consider this measure in combination with the proportion of all survivors (table 1, measure 2B). When taking all the successful aging measures into consideration at once the intervention where disability is delayed by five years and mortality by 10 years (intervention 3) would be considered most successful.
Health expectancy measures
Table 2 compares the same interventions, but this time using a set of health expectancy measures based on the life table. The intervention delaying all the transition rates associated with aging by five years (intervention 1) leads to life extension by 3.2 (men) and 3.7 (women) years, and a longer life expectancy free of disability (2.7 years). The same intervention, however, also tends to extend the life expectancy with disability by 0.5 (men) and 1.0 (women) years. With intervention 2, where disability is delayed by five years and mortality is not delayed, we see an increase in total life expectancy, an increase in life expectancy without disability, and a decrease in life expectancy with disability. However, as expected, the increase in total life expectancy is substantially less than in the first scenario. Finally, with intervention 3, where functional decline is delayed by five years and mortality is delayed by 10 years, we find a large increase in the life expectancy with disability (2.1 (men) and 3.6 (women) years. As expected, there still is a large gain in both life expectancy and life expectancy without disability. In this scenario, we find the greatest increase in total life expectancy: about six (men) and seven (women) years.
As the interventions not only change the number of years with disability but simultaneously increase the amount of time spent without disability, it is also informative to consider the relative burden of disability. The last column in table 2 gives the (change into the) percentage of person years lived with disability out of the total number of person years lived. For intervention 2, where disability is delayed by five years but mortality is not delayed we see the largest reduction in the proportion of remaining life spent with disability (8.6 (men) and 9.9 (women) percentage points). For intervention 1, where all the transition rates associated with aging are delayed by five years, the reduction is smaller (4.4 percentage points). However, this illustrates that while the longer life extension associated with intervention 1 tends to be accompanied by an increased absolute burden of disability, once the longer lifetime is taken into account, the relative burden is still lower than in the baseline situation. In contrast with interventions 1 and 2, the percentage of remaining life with disability associated with intervention 3, where functional decline is delayed by five years and mortality is delayed by 10 years, instead tends to increase slightly.
Comparison of measures
A traditional successful aging measure that only analyses the survivors (table 1, measure 2A) would rate each of the interventions as equally successful. In contrast, both the life expectancy without disability (table 2, DFLE) and the successful aging measure that includes deaths (table 1, measure 1) showed that while all the interventions led to an extension of the period free of disability, the degree differed. As expected, the degree of extension was clearly linked to the degree of mortality improvement. Greater improvements in mortality rates were associated with greater increases in disability free life expectancy and with greater proportions of successful agers. The health expectancy measures also showed that the effect of each intervention on the years lived with disability varied, however, this time in a manner depending on the relative improvements of each of the transition rates. While an intervention with a much greater delay in functional decline than in mortality led to a decrease in the life expectancy with disability, that with a much greater delay in mortality suggested an increase in the life expectancy with disability. Traditional successful aging measures fail to catch this effect and would either rate all three interventions equally successful (measure 2a), or would rate intervention 3, which was associated with the largest increase in the relative and absolute amount of time lived with disability as most successful (measure 1 or combination of measures).
Discussion
Successful aging interventions, such as the introduction of assistive devices or a rehabilitation programme may delay disability, without improving the probability of survival. However, interventions focusing on lifestyle factors, such as physical activity and smoking, generally affect not only functioning but also mortality. In this study we simulated three hypothetical interventions with the same improvement in functioning, but with different degrees of improvement in mortality rates. We showed that these interventions (or factors), were considered equally successful according to successful aging measures restricted to survivors, but were associated with vastly different gains in total life expectancy and years lived without disability, and with opposite effects on the number of years lived with disability. We showed that an intervention (or factor), that delays disability rates by five years still can lead to an increase in the number of years, or proportion of the lifetime, lived with disability, depending on its relative effect on functional ability and mortality. Furthermore, the intervention that was apparently most successful when taking all the successful aging measures into consideration at once, was the intervention associated with the largest increase in the relative and absolute amount of time lived with disability.
What the paper adds
The field of healthy aging has focused on identifying factors associated with delays in functional loss and mortality. A number of factors have been identified, including non‐smoking, being physically active, and maintaining normal weight, that are hoped to lead to a decrease in population disability levels and health care costs. Our study shows the limitations of current measures of successful aging, which are either dominated by mortality or completely ignore it. Their important limitation is that they ignore differences in the time lived with functional loss. Using summary measures of population health, we show that strategies delaying both survival and functional loss may still increase the relative and absolute amount of time spent with functional loss.
Currently, behavioural factors known to be associated with maintenance of functioning at older ages are considered to be determinants of successful aging.13 A recent overview study showed that there was evidence of an association with healthy aging for: non‐smoking, being physically active, maintaining weight within normal ranges, and moderate alcohol consumption.13 However, many of these reported modifiable external factors are significantly associated with both increased functional loss and mortality.14 Furthermore, the relative effect on these two outcomes differs between risk factors. For example, one study found that while moderate alcohol consumption tends to be associated with a greater reduction in the risk of mortality than loss of functioning, moderate body weight was associated with similar reductions in the risks of both mortality and loss of functioning.10 It is understood (and shown again here) that the interpretation of methods such as the odds of remaining free of disability after a short period of follow up can be dominated by a factor's effect on mortality.8,10 For that reason some studies present a number of measures, including those based on analyses restricted to survivors.8,9
A method that does integrate information about a factor's effects on disability and mortality defines successful aging as survival to age 80 (men) and 85 (women) and dying without disability.12 However, the choice of survival age for this method is always arbitrary. Another disadvantage is that the definition of successful aging implies no period of disability at all, which is less useful for public health decisions in an aging population in which disability will always exist. We argue that evaluation of the degree of change in the number of years and proportion of remaining life lived with disability is an important addition to the current methods of assessing potential factors involved in successful aging. Successful aging strategies are unlikely to eliminate all time spent with disability, and could equally lead to a smaller, equivalent or higher burden of disability. Successful aging is more successful if it not only delays functional losses to older ages, but also additionally reduces the time spent with disability in the remaining lifetime.14,29
Policy implications
Our work shows that strategies that delay both survival and functional loss may still result in higher population levels of functional loss. This is a message that is generally not taken into account, with many current successful aging policy documents implying that successful aging strategies will necessarily lead to decreases in disability and health care costs. Furthermore, our work shows a tool—summary measures of population health—that we recommend be regularly used to identify and choose between strategies involved in successful aging.
A few studies have examined the effect of behavioural factors on life expectancy with and without disability based on prospective data. For instance, studies by Ferucci et al,28 Nusselder et al,22 and Belanger et al30 used short term follow up studies to derive life tables by smoking status. This enabled quantification of the degree to which non‐smokers, or never smokers, differ in the time they life with and without disability by integrating the effects of smoking on the incidence of disability, recovery from disability, mortality without disability, and mortality once disabled. However, such analyses are not routine in the successful aging literature. While to date only disability has been examined in this way, there are no restrictions on the type of health state examined. Inclusive definitions such as engagement in social and productive activities, resilience, and wisdom31 could also be used as long as being in the state of interest can be measured.
While health expectancy measures based on the multi‐state life table fit closest to the data and the approach currently used in successful aging research, there are other summary health measures that combine data on survival and functioning. Well known examples include: health expectancy measures based on the Sullivan method, disability adjusted life expectancy (DALE), and disability adjusted life years (DALY). The Sullivan method32,33 is the standard method to calculate health expectancy on a routine basis and uses the observed age specific disability prevalence from a cross sectional study to subdivide the number of person years lived into years with and without disability. The DALE also belongs to the family of health expectancies, but this measure uses disability weights to summarise the expected number of years lived in the equivalent of full health.34 The DALY measures the gap between a population's actual health and some defined goal and is generally based on a combination of disease specific incidence‐prevalence‐mortality models and disability weights, in combination with age weighting and discounting.34,35,36 More information on these measures, their calculation methods, strong points, and limitations is given elsewhere,18,19 but essentially the primary outcomes are the same as those presented here.
The important limitation of using health expectancy measures based on age specific transition rates between health states is the need for prospective data. However, for the traditional successful aging measures these type of data are also needed, although potentially requiring a smaller sample size. Moreover, the number of prospective studies is rapidly increasing. A second limitation of all summary population health measures is that they are based on a life table model, which entails additional analyses steps compared to traditional measures of successful aging. It is noteworthy, however, that the same is true for total life expectancy, which is the standard measure for the mortality level of a population. Moreover, using such a life table model also reduces the data requirements, as long term follow up is not required. Like total life expectancy measures which generally are based on mortality within one year, health expectancy measures can be constructed from short term follow up data. As long as all ages above the initial age are included in the follow up study of disability and mortality, total life expectancy and life expectancy without and with disability can be calculated following a period approach. In such an approach, the life table represents a population consisting of persons from different birth cohorts (synthetic cohort). When long term follow up data are available, a cohort approach, following a real cohort through time, can also be used to calculate health expectancies.37
As our illustration showed that the overall effects of successful aging interventions are impossible to determine intuitively, we recommend the use of life tables, which can integrate the effects of mortality, functional losses, and recovery across age, providing a synthetic life course measure of successful aging. They synthesise information from short term follow up data to give an idea of the effect across the lifetime (individual perspective) or the age range (population health perspective). They also provide the range of outcome measures necessary to better understand the individual and population health consequences of potential interventions. Measures such as those presented here can help inform choices between strategies for improving the health of aging populations.5 In addition, they may help to predict the burden of disability still present after implementation of the recommended successful aging strategies. This information is important from the perspective of a person making choices about a change in lifestyle. It is also important from a societal perspective where one of the assumptions underlying the promotion of successful aging is that society will experience less disability and therefore lower health care costs.5
While healthy aging is a worthy goal, it remains an ill defined concept. Life extension can generally be considered a success, even more so if accompanied by the extension of life free of functional losses. However, interventions that extend life expectancy free of functional loss will often also extend life expectancy with significant functional losses. Decisions will have to be made regarding what are reasonable trade offs between these two effects. To allow individuals and society at large to make informed decisions, these effects need to be made explicit.
Acknowledgements
This study was discussed within the context of the Netherlands Epidemiology and Demography Compression of Morbidity Research Group (NEDCOM), whose other members include J Barendregt, L Bonneux, C De Laet, A Mamun, F Janssen, A Kunst, J Mackenbach, and F Willekens.
Appendix
1A EQUATIONS TO CALCULATE TRANSITION RATES
We used three functions to describe the relationship of the incidence, recovery, and mortality rates (that is, transitions rates) with age: the exponential model, the Gompertz‐Makeham model, and the Sigmoid model.
(1) The exponential model is specified as follows:
Or equivalently:
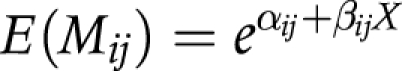 |
where: Nij is the expected number of events (that is, transitions from state i at the beginning of the interval to state j at the end of the interval); αij is the log (expected number of events during 1 unit of time at age 0); βij is the log (ratio of the number of events during 1 unit of time at age x and age x+1); X is age; Ri is exposure time and Mij is the transition rate from state i to state j. Log(Ri) handles differences in exposure times and is known in statistical literature as the “offset parameter”.
(2) The Gompertz‐Makeham model is specified as follows:
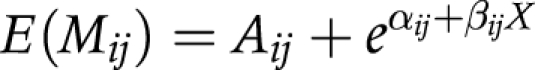 |
where: Aij is the constant of Makeham, which reflects that besides the exponential component, there also exists a component, which is independent of age.
(3) The Sigmoid model is specified as follows:
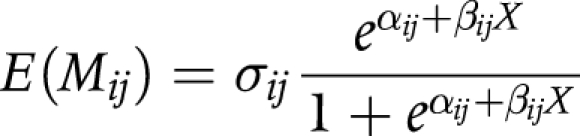 |
where: σij is a constant that can be interpreted as an age‐independent maximum transition rate.
The likelihood ratio test was used to select between the exponential model and the Gompertz‐Makeham and Sigmoid model, respectively. We used a significance level of 0.01 rather than 0.05 to take into account dependency between the observations in the subsequent waves. All models were estimated in GLIM. Table A1 presents the parameters of the regression equations for incidence of disability, recovery from disability, mortality among non‐disabled and among disabled persons for men and women.
Table A1 Parameters of the poisson regression analysis (SE).
| Type of model | aij at age 70* | bij | Mij | sij | |
|---|---|---|---|---|---|
| Men | |||||
| Incidence of disability | Gomp+Mak | −2.945 (0.0399) | 0.0859 (0.00333) | 0.0237 | NA |
| Mortality among non‐disabled | Gompertz | −3.813 (0.0718) | 0.1078 (0.00698) | NA | NA |
| Recovery from disability | Sigmoid | −0.906 (0.0546) | −0.1052 (0.00453) | NA | 0.5056 |
| Mortality among disabled | Gompertz | −2.505 (0.0663) | 0.0577 (0.00507) | NA | NA |
| Women | |||||
| Incidence of disability | Gomp+Mak† | −2.487 (0.0323) | 0.0725 (0.00283) | 0.0192 | NA |
| Mortality among non‐disabled | Gompertz | −4.642 (0.1199) | 0.1097 (0.01153) | NA | NA |
| Recovery from disability | Sigmoid | −0.627 (0.0429) | −0.1085 (0.00344) | NA | 0.3384 |
| Mortality among disabled | Gompertz | −3.308 (0.0730) | 0.0747 (0.00520) | NA | NA |
NA, not applicable. Gomp+Mak, Gompertz‐Makeham. *Age was transformed to age 70. †For women the p value for the Makeham constant was 0.015 (that is, larger than the significance level of 0.01). To obtain models of the same type for men and women we kept this constant for women as well.
1B EQUATIONS AND ASSUMPTIONS TO CALCULATE HEALTH EXPECTANCY
(1) We converted transition rates (M) into probabilities (P)
Firstly, we arranged the transition rates in matrix notation:
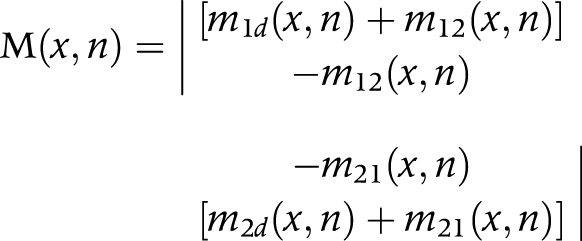 |
where:
M(x,n) is the matrix of transition rates
m1d (x,n) = transition rate from state 1 (non‐disabled) to dead
m12 (x,n) = transition rate from state 1 (non‐disabled) to state 2 (disabled)—that is, incidence
m2d (x,n) = transition rate from state 2 (disabled) to dead
m21 (x,n) = the transition rate from state 2 (disabled) to state 1 (non‐disabled)—that is, recovery
(x,n) is the age interval x to x+n
n is the length of the age interval
Then, we estimated transition probabilities from transition rates, using the linear assumption:
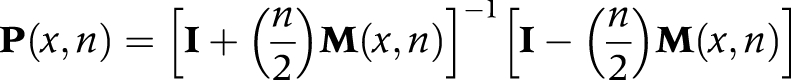 |
where:
P(x,n) is the transition‐probability matrix, consisting of elements Pij(x) that represent the probability that an individual alive in state i at age x will be in state j at age x+n
I is the identity matrix
For our life table with two living states, the transition probabilities are:
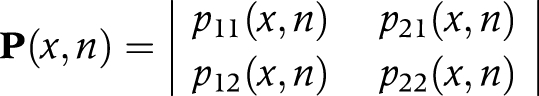 |
or
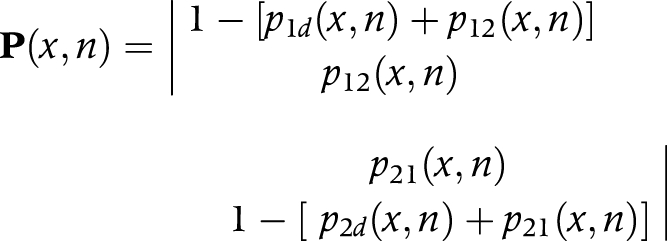 |
(2) We multiplied transition probabilities (P) by the number of survivors (li) in each state at age x to obtain the number of survivors in each state at age x+n
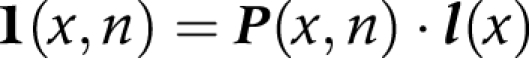 |
or
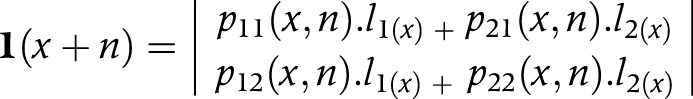 |
where:
l(x) is a vector, having elements li(x) which represent the number of persons in state i at the exact age of x
l1(x) is the number of non‐disabled persons at exact age x
l2(x) is the number of disabled persons at exact age x
(3) We calculated the number of person years (Li) in each state from the number of survivors in each state (li) at age x and age x+n
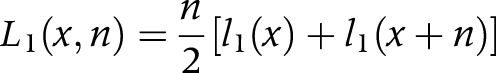 |
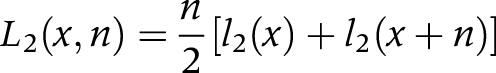 |
L1(x,n) is the number of person years in the non‐disabled state between age x and x+n
L2(x,n) is the number of person years in the disabled state between age x and x+n
For oldest age group (ω) we used the following equation:
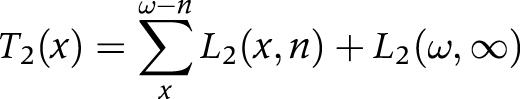
(4) We aggregated the number of person years (Li) in each state across ages to obtain the person years lived after age x (Ti) in each state
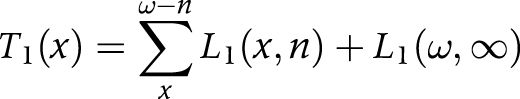 |
 |
T1(x) is the number of person years lived after age x in the non‐disabled state
T2(x) is the number of person years lived after age x in the disabled state
(5) We divided the person years lived after age x (T) in each state by the number of survivors (l) at age x to obtain life expectancy (ei) at age x, in each state
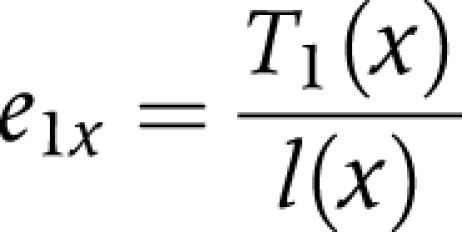 |
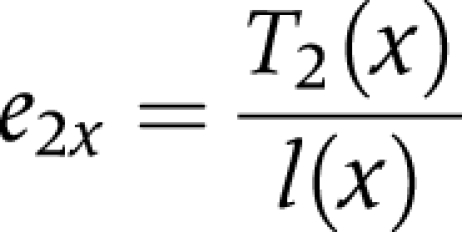 |
e1x is the life expectancy in the non‐disabled state at age x
e2xis the life expectancy in the disabled state at age x
Assumptions of the multi‐state life table
(1) In a Markov model the probability that a person will leave a state depends only on the present state. This present state is assumed to include all relevant information; the influence of duration or past history is ignored. That is, only age, sex, and the present disability state determine the transition rates.
(2) Competing transition rates from the same state of origin (for example, incidence of disability and mortality among non‐disabled) are assumed to be independent, which means that a change in one transition rate does not affect the estimates of competing transition rates.
(3) The linear method is used to approximate Li(x,n) and to transform the transition rates into transition probabilities (and vice versa). This method assumes that deaths and other transitions are distributed uniformly over the interval x to x+n, yielding (piecewise) linear survival functions. The mean duration for transfer is n/2, that is, transitions occur on average in the middle of the interval.
(4) In the calculation of health expectancy it is assumed that current age and sex specific mortality and disability rates remain constant.
1C EQUATIONS TO CALCULATE SUCCESSFUL AGING MEASURES
(1) Proportion remaining alive and non‐disabled (or healthy) after 10 years (SA1)
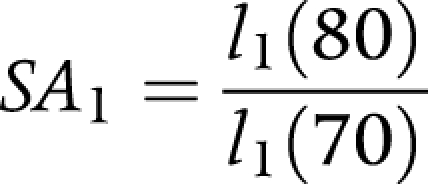 |
where:
l1(70) is the number of non‐disabled persons at exact age 70.
l1(80) is the number of non‐disabled persons at exact age 80.
(2) Proportion of survivors that is non‐disabled after 10 years (SA2)
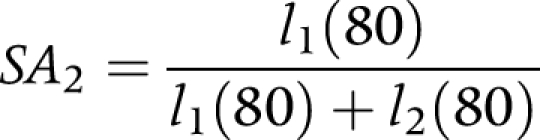 |
where:
l1(80) is the number of non‐disabled persons at exact age 80.
l2(80) is the number of disabled persons at exact age 80.
(3) Proportion of survivors after 10 years (SA3)
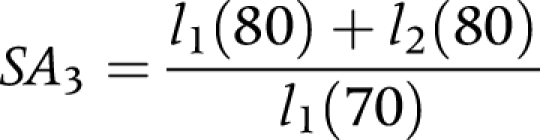 |
where:
l1(70) is the number of non‐disabled persons at exact age 70.
l1(80) is the number of non‐disabled persons at exact age 80.
l2(80) is the number of disabled persons at exact age 80.
Footnotes
Funding: this work was supported by ZON‐MW contract 014‐91‐054 and 904‐68‐493. AP was partly funded as a VicHealth Research Fellow during this study. These funding organisations did not participate in the design and conduct of the study, collection, management, analysis, and interpretation of the data; and preparation, review, or approval of the manuscript.
Competing interests: none.
Ethical approval was not required as this was a secondary data analysis.
References
- 1.Wilmoth J R. Demography of longevity: past, present, and future trends. Exp Gerontol 2000351111–1129. [DOI] [PubMed] [Google Scholar]
- 2.Rowe J W, Kahn R L. Human aging: usual and successful. Science 1987237143–149. [DOI] [PubMed] [Google Scholar]
- 3.Chronic Disease Prevention and Health Promotion Special focus: healthy aging. Chronic disease notes and reports 1999121–16. [Google Scholar]
- 4.Chronic Disease Prevention and Health Promotion Healthy aging: preventing disease and improving qualtity of life among older americans. Atlanta, GA: Chronic Disease Prevention and Health Promotion, 2002
- 5.Kalache A, Keller I. The WHO perspective on active ageing. Promot Educ. 1999;6: 20–3, 44, 54, [DOI] [PubMed]
- 6.Kalache A, Keller I. The greying world: a challenge for the twenty‐first century. Sci Prog 20008333–54. [PubMed] [Google Scholar]
- 7.Kalache A, Aboderin I, Hoskins I. Compression of morbidity and active ageing: key priorities for public health policy in the 21st century. Bull World Health Organ 200280243–244. [PMC free article] [PubMed] [Google Scholar]
- 8.Roos N P, Havens B. Predictors of successful aging: a twelve‐year study of Manitoba elderly. Am J Public Health 19918163–68. [DOI] [PMC free article] [PubMed] [Google Scholar]
- 9.Strawbridge W J, Cohen R D, Shema S J.et al Successful aging: predictors and associated activities. Am J Epidemiol 1996144135–141. [DOI] [PubMed] [Google Scholar]
- 10.Guralnik J M, Kaplan G A. Predictors of healthy aging: prospective evidence from the Alameda County study. Am J Public Health 198979703–708. [DOI] [PMC free article] [PubMed] [Google Scholar]
- 11.Reed D M, Foley D J, White L R.et al Predictors of healthy aging in men with high life expectancies. Am J Public Health 1998881463–1468. [DOI] [PMC free article] [PubMed] [Google Scholar]
- 12.Leveille S G, Guralnik J M, Ferrucci L.et al Aging successfully until death in old age: opportunities for increasing active life expectancy. Am J Epidemiol 1999149654–664. [DOI] [PubMed] [Google Scholar]
- 13.Peel N M, McClure R J, Bartlett H P. Behavioral determinants of healthy aging. Am J Prev Med 200528298–304. [DOI] [PubMed] [Google Scholar]
- 14.Haveman‐Nies A, de Groot L C, van Staveren W A. Dietary quality, lifestyle factors and healthy ageing in Europe: the SENECA study. Age Ageing 200332427–434. [DOI] [PubMed] [Google Scholar]
- 15.Newman A B, Arnold A M, Naydeck B L.et al “Successful aging”: effect of subclinical cardiovascular disease. Arch Intern Med 20031632315–2322. [DOI] [PubMed] [Google Scholar]
- 16.Ford A B, Haug M R, Stange K C.et al Sustained personal autonomy: a measure of successful aging. J Aging Health 200012470–489. [DOI] [PubMed] [Google Scholar]
- 17.Robine J M, Ritchie K. Healthy life expectancy: evaluation of global indicator of change in population health. BMJ 1991302457–460. [DOI] [PMC free article] [PubMed] [Google Scholar]
- 18.Robine J M, Jagger C, Mathers C D.et alDetermining health expectancies. Chichester: Wiley, 2003
- 19.Murray C J L, Salomon J A, Mathers C D.et al Summary measures of population health. In: Murray CJL, Salomon JA, Mathers CD, et al, eds. Summary measures of population health. Geneva: World Health Organisation, 2002221–231.
- 20.Crimmins E M, Hayward M D, Saito Y. Changing mortality and morbidity rates and the health status and life expectancy of the older population. Demography 199431159–175. [PubMed] [Google Scholar]
- 21.Guralnik J M, Land K C, Blazer D.et al Educational status and active life expectancy among older blacks and whites. N Engl J Med 1993329110–116. [DOI] [PubMed] [Google Scholar]
- 22.Nusselder W J, Looman C W, Marang‐van de Mheen P J.et al Smoking and the compression of morbidity. J Epidemiol Community Health 200054566–574. [DOI] [PMC free article] [PubMed] [Google Scholar]
- 23.Rogers A, Rogers R G, Branch L G. A multistate analysis of active life expectancy. Public Health Reports 1989104222–226. [PMC free article] [PubMed] [Google Scholar]
- 24.Schoen R.Modelling multigroup populations. New York, NY: Plenum Press, 1988
- 25.Nusselder W.Compression or expansion of morbidity? A life table approach. Rotterdam: Erasmus University Rotterdam, 1998
- 26.Lievre A, Brouard N. The estimation of health expectancies from cross‐longitudinal surveys. Math Popul Studies 200310211–248. [Google Scholar]
- 27.INED/EuoREVES Computing health expectancies using IMaCH (a maximum likelihood computer program using interpolation of Markov Chains) 2004. http:euroreves.ined.fr/mach/doc/imach.html
- 28.Ferrucci L, Izmirlian G, Leveille S.et al Smoking, physical activity, and active life expectancy. Am J Epidemiol 1999149645–653. [DOI] [PubMed] [Google Scholar]
- 29.Campion E W. Aging better. N Engl J Med 19983381064–1066. [DOI] [PubMed] [Google Scholar]
- 30.Belanger A, Martel L, Berthelot J M.et al Gender differences in disability‐free life expectancy for selected risk factors and chronic conditions in Canada. J Women Aging 20021461–83. [DOI] [PubMed] [Google Scholar]
- 31.Rowe J W, Kahn R L. Successful aging. Gerontologist 199737433–440. [DOI] [PubMed] [Google Scholar]
- 32.Sullivan D F.Disability components for an index of health. Washington, DC: Government Printing Office, 1971 [PubMed]
- 33.Sullivan D F. A single index of mortality and morbidity. HSMHA Health Reports 197186347–354. [PMC free article] [PubMed] [Google Scholar]
- 34.Mathers C D, Sadana R, Salomon J A.et al Healthy life expectancy in 191 countries, 1999. Lancet 20013571685–1691. [DOI] [PubMed] [Google Scholar]
- 35.Murray C J, Lopez A D. Regional patterns of disability‐free life expectancy and disability‐adjusted life expectancy: global burden of disease study. Lancet 19973491347–1352. [DOI] [PubMed] [Google Scholar]
- 36.Anand S, Hanson K. Disability‐adjusted life years: a critical review. J Health Econ 199716685–702. [DOI] [PubMed] [Google Scholar]
- 37.Mamun A A, Peeters A, Barendregt J.et al Smoking decreases the duration of life lived with and without cardiovascular disease: a life course analysis of the Framingham heart study. Eur Heart J 200425409–415. [DOI] [PubMed] [Google Scholar]