Abstract
Objectives
Death rates are an outcome that can be used to describe a service. We measured three death rates that can be used to describe an emergency department (ED): death rates for those seen in the ED and discharged, those that die within the ED, and those that die after admission. We also wanted to establish how easy it was to obtain these rates and how frequently autopsy was performed.
Setting
ED within a large teaching hospital.
Results
Between 1 December 2003 and 1 December 2004, 76 060 patients attended the ED of which 205 died within the department. A total of 16 489 were admitted of which 876 died within 30 days. A total of 59 366 were discharged home of which 111 subsequently died over the next 30 days. The rates were 0.19% (111/59 366) for those discharged, 4.6% (766/16 489) for those admitted, and 0.27% (205/76 060) for those patients attending the ED who died within it. The autopsy rate was low (20%) and was more likely if the patient died in the department, died within the first few days of admission, or was young. The data were easy to collect.
Conclusions
These three death rates were easy to calculate and could be used to describe the outcome of an ED service. Further research to establish the range of rates for different departments is now required to determine their potential use.
Keywords: autopsy rates, emergency department, mortality rates
Outcomes are important to every specialty but much of the current measurement of emergency department (ED) activity is based on process rather than outcome. This approach is reflected in the Department of Health's four hour waiting target, which is a measure of organisation. Identifying suitable outcome measures is difficult. A recent attempt by emergency service personnel to identify suitable indicators reported that only two of the thirty six indicators that achieved consensus were outcomes.1 The outcome data that is available to EDs relate to special populations using funded databases—for example, Trauma and Audit Research Network2 and Intensive Care National Audit and Research Centre.3
Why are outcomes so difficult to measure in the ED? Perhaps it is because the patient's time spent in the department is short, their care is often shared with others afterwards, and the outcome often occurs beyond the department.
One outcome worth revisiting is death. It has the merit of being clearly identifiable, routinely recorded, and must in some way reflect the standard of care that preceded the death.
Death may be usefully considered in the following three categories with regard to the ED.
1. Those patients who have been seen in the department, discharged, and have subsequently died.
Kefer et al4 in Milwaukee usefully subdivided death as expected or unexpected based on the patient's clinical status at the time of discharge, and directly related or not directly related to the ED visit based on a review of all records and the cause of death as listed on the death certificate. They found the overall death rate of patients discharged from the ED of 13 per 100 000. The rate of unexpected death directly related to the ED visit was 3 per 100 000 patients discharged from the ED in the previous 8 days.
2. Those patients who died in the ED.
Clearly there are many patients that die in the ED that have arrested prior to arrival in the ED or have a terminal illness. Roller et al5 identified that 85% of in‐department deaths in a North Carolina ED fell into this category and suggested that the remaining 15% be described as unexpected and be a measure of the quality of care. The United Kingdom literature is limited typically to single audits undertaken some time ago. Nevertheless, these papers reported in‐departmental deaths rates between 0.05% and 0.5%.6,7
3. Deaths of patients receiving their initial care in the ED who are subsequently admitted to hospital.
Trying to establish the contribution of the ED to a subsequent in‐patient death is problematic but it would be reasonable to assume that the later the death occurred the less the contribution from the ED. Our literature search identified one paper,8 which studied 200 patients who died on a medical unit after emergency admission. Although not designed to identify the ED contribution to patient care it usefully identified that 70% had come through the ED.
Aim of the study
We wished to establish how easy it was to measure these three different death rates using existing hospital databases and what these rates were for our own department. We were also aware from previous papers9,10 that the diagnosis of the cause of death in the absence of an autopsy can be erroneous and we wanted to also measure the autopsy rate.
Method
Information about deaths relating to the Southampton ED, based in a teaching hospital seeing typically more than 70 000 patients per annum, was obtained from the Patient Activity System (PAS) database, which was interrogated using the Cognos Impromptu software. We wished to establish how easy it was to retrieve this information as well as its content. We did not want to conduct an in‐depth study of individual cases. A spreadsheet of all the patients who died within 30 days having attended the ED between 1 December 2003 and 1 December 2004 was formed and analysed by the three categories of death, age, and sex. This was made possible by the requirement that deaths within the community that is served by the hospital are reported to the medical records department by the general practitioner. By linking with the pathology department database it was possible to establish which patients had had an autopsy.
Results
Between the 1 December 2003 and 1 December 2004, 76 060 new patients attended the ED of whom 16 489 were subsequently admitted and 59 366 discharged home.
Those patients who were seen in the department, discharged, and subsequently died within the following 30 days
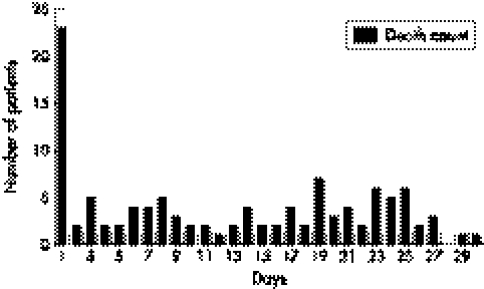
Altogether, 111 of the 59 366 (0.2%) patients that were discharged directly from the department subsequently died within 30 days; 47 of which died in the first 8 days (fig 1) (79 per 100 000 discharged). Fifty seven per cent of this group were male and 33 (40%) were under the age of 66 years (Table 1). Twenty three (20%) died within 24 hours. Twenty two out of the 111 (20%) had an autopsy.
Figure 1 Number of patients who died within 30 days after discharge from the emergency department
Table 1 Age distribution for patients who died within the three groups.
| Age (years) | Died post discharge from ED (n = 111) | Died within the ED (n = 205) | Died after admission (n = 876) |
|---|---|---|---|
| 0–16 | 1 | 7 | 1 |
| 17–45 | 13 | 20 | 30 |
| 46–55 | 4 | 14 | 30 |
| 56–65 | 15 | 20 | 66 |
| 66–75 | 21 | 42 | 153 |
| >75 | 57 | 102 | 596 |
Patients who died within the department
A total of 205 patients died within the department (including those who arrived in cardiac arrest) out of the 76 060 attendances (0.3%). Of these, 123 (60%) were male and 82 (40%) were female. Table 1 shows the breakdown according to the patient's age. Altogether, 115 out of 205 (56%) had an autopsy.
Deaths of patients receiving their initial care in the ED who are subsequently admitted to hospital
A total of 876 of the 16 489 patients who were admitted died within a 30 day period. A total of 766 died in hospital during their initial admission and 110 died after discharge from an in‐patient bed or on a subsequent admission.
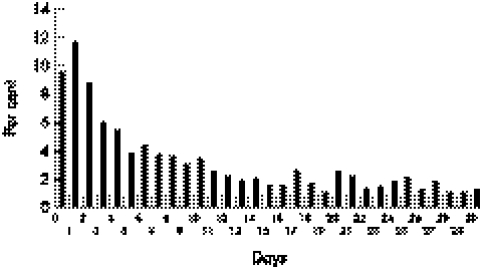
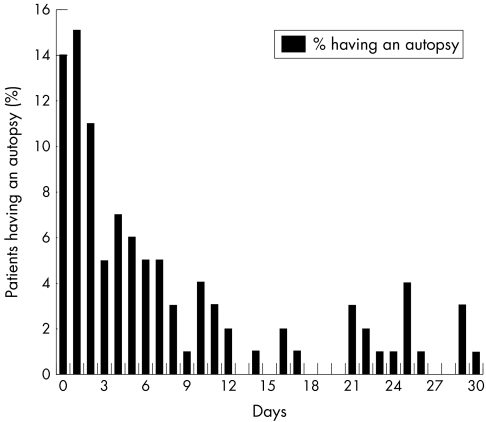
Of these 876, 423 (48%) were male. Table 1 shows the breakdown by age and fig 2 shows the percentage of patients who died within 30 days of admission. The in‐patient death rate is 4.6% (number of in‐patient deaths/number of emergency admissions); one third occurred in the first 72 hours, which is about 20 cases per month for our hospital. Of the 876 deceased patients, 101 (11.5%) either had a hospital or coroner's autopsy. Table 2 and fig 3 demonstrate that autopsy is more likely the younger the patient and the sooner death occurs after admission.
Figure 2 The distribution of patients who died as a percentage of all those who died within 30 days of admission
Table 2 Autopsy rates broken down by age for patients who died within 30 days of admission.
| Age (years) | Number of deaths | Number of autopsies (%) |
|---|---|---|
| 0–16 | 1 | 1 (100) |
| 17–45 | 30 | 11 (37) |
| 46–55 | 30 | 7 (23) |
| 56–65 | 66 | 14 (21) |
| 66–75 | 153 | 24 (16) |
| >75 | 596 | 44 (7) |
Figure 3 Percentage of patients undergoing autopsy by length of hospital stay
Discussion
Obtaining the data was relatively easy: it took 15 minutes for the data analyst to set up the query in IMPROMPTU. Collection of data on a monthly basis would then take under 5 minutes to run the search and print out depending on network speed.
There are two unavoidable factors that may result in under reporting of the death rate. All deaths within the community that is served by the hospital are reported to the hospital medical records department by the general practitioner (in order to prevent appointments being sent out to the deceased). If this system fails, patients who die after discharge may be under reported. In addition, patients who are registered with a general practitioner outside the Southampton Hospital catchment area may also not be reported. The reporting mechanism has not been formally audited, but is thought to work well.11
The death rate of those discharged who died within 24 hours is striking and those within 8 days is high compared with Kefer's data, but small enough (47 cases) to be reviewed in detail, focusing on those patients who had unexpected deaths.
The low total in‐departmental death rate means that case by case review is possible especially if those cases of prehospital arrest or terminal illness are excluded.
The postmortem rates were low and the literature suggests that we cannot be certain of the cause of death in 20% of cases not undergoing post mortem.10
Outcomes such as these death rates could be used to follow trends within individual institutions but cannot be used for comparison between departments unless case mix adjustment is undertaken. There is at present only one potential generic adjustment measure and that has been validated for medical patients admitted from an ED in Sweden.[12]
This study has shown that mortality data for patients attending the ED can be rapidly and easily obtained from an existing hospital information system. The next stage of this research will be to gather more information from other departments so that we can establish the variation of these rates and their potential usefulness.
Acknowledgements
The authors wish to acknowledge the help of Kirsty Anderson, Clinical Information Services, Southampton University Hospital Trust; Adrian Bateman, Consultant Pathologist, Southampton University Hospital Trust; and Joanne Horne, Team Leader Biomedical Scientist, Lead IT Officer, Cellular Pathology, Southampton University Hospital Trust.
Abbreviations
ED - emergency department
Footnotes
Funding: none.
Competing interests: none declared.
References
- 1.Beattie E, Mackway‐Jones K. A Delphi study to identify performance indicators for emergency medicine. Emerg Med J 20042147–50. [DOI] [PMC free article] [PubMed] [Google Scholar]
- 2.Lecky F E, Woodford M, Bouamra O.et al Lack of change in trauma care in England and Wales since 1994. Emerg Med J 200219520–523. [DOI] [PMC free article] [PubMed] [Google Scholar]
- 3.Simpson H K, Clancy M, Goldfrad C.et al Admissions to intensive care units from emergency departments: a descriptive study. Emerg Med J 200522423–428. [DOI] [PMC free article] [PubMed] [Google Scholar]
- 4.Kefer M P, Hargarten S W, Jentzen J. Death after discharge from the Emergency Department. Annals of Emerg Med 199424(6)1102–1107. [DOI] [PubMed] [Google Scholar]
- 5.Roller J E, Prasad N H, Garrison H G.et al Unexpected emergency department death: incidence, causes and relationship to presentation and time in the department. Annals of Emerg Med 199221(6)743–745. [DOI] [PubMed] [Google Scholar]
- 6.Shalley M J, Cross A B. Which patients are likely to die in an accident and emergency department? BMJ 1984289419–421. [DOI] [PMC free article] [PubMed] [Google Scholar]
- 7.Beckett M W, Longstaff P M, McCabe M J.et al Deaths in three accident and emergency departments. Arch Emerg Med 19874227–232. [DOI] [PMC free article] [PubMed] [Google Scholar]
- 8.Seward E, Greig E, Preston S.et al A confidential study of deaths after emergency medical admission: issues relating to quality of care. Clin Med 20033(5)425–434. [DOI] [PMC free article] [PubMed] [Google Scholar]
- 9.Goldman L, Sayson R, Robbins S.et al The value of the autopsy in three medical eras. NEJM 19833081000–1005. [DOI] [PubMed] [Google Scholar]
- 10.Vanbrabant P, Dhondt E, Sabbe M. What do we know about patients dying in the emergency department? Resuscitation 200460(2)163–170. [DOI] [PubMed] [Google Scholar]
- 11.Correspondence with data quality department Southampton General Hospital, Southampton, UK
- 11.Olsson T, Terent A, Lind L. Rapid emergency medicine score: a new prognostic tool for in‐hospital mortality in non‐surgical emergency department patients. J Internal Med 2004225(5)579–587. [DOI] [PubMed] [Google Scholar]


