

Abstract
The aim of the study was (1) to develop methods for evaluating tone production of children with cochlear implants (CIs) who speak Mandarin Chinese and (2) to evaluate the efficacy of using these methods to assess tone production. The subjects included two groups of native-Mandarin-Chinese-speaking children: 14 prelingually deafened children who had received CIs and 61 normal-hearing (NH) children as controls. The acoustic analysis focused on quantification of the degree of differentiation among lexical tones based on tonal ellipses and the overall similarity of tone contours produced by the children with CIs to normative contours derived from the 61 NH children. An artificial neural network was used to recognize tones produced by the children with CIs after trained with tone tokens produced by the NH children. Finally, perceptual judgments on the tone production of both groups were obtained from eight native-Mandarin-speaking NH adults to evaluate the efficacy of the methods. The results showed that all measures using the acoustic, neural-network, and perceptual analyses were highly correlated with each other and could be used to effectively evaluate tone production of children with CIs.
I. Introduction
The main purpose of this study was twofold. One was to develop methods to assess Mandarin-Chinese tone production in children with cochlear implants (CIs). The second purpose was to validate these methods and evaluate their relative utility in the assessment of tone production in children with CIs.
Mandarin Chinese is a tonal language that uses pitch differences to contrast word meanings. The four tones in Mandarin Chinese are commonly referred to as tones 1, 2, 3, and 4. Tone 1 is a high level tone that has a flat fundamental frequency (F0) contour. Tone 2 has a rising F0 contour. Tone 3 is a falling and rising tone with a dip in the middle of the vowel. Tone 4 is a high falling tone (Duanmu, 2000; Whalen and Xu, 1992). Chao (1948) introduced a nomenclature that delineates the F0 patterns for the four Mandarin-Chinese tones. The four tones are named tone 55, tone 35, tone 214, and tone 51. The numbers reflect the relative levels of the starting and ending points of the F0 contours, or those of the starting, middle, and ending points of the F0 contour in the case of tone 3. Although F0 is the primary acoustic correlate for Mandarin tone perception, other cues such as duration and amplitude contour may also assist tone identification (Whalen and Xu, 1992; Xu et al., 2002).
It is believed that Mandarin-Chinese tone is acquired by typically developing children at a very young age (e.g., Li and Thompson, 1997), probably even earlier than the mastery of segmentals (i.e., vowels and consonants). Research has shown that children with CIs who speak tonal languages have deficits in tone perception (e.g., Wei et al., 2000; Ciocca et al., 2002; Lee et al., 2002; Wong and Wong, 2004) due to the lack of F0 information in the electrical stimulation in current CI technology [see Moore (2003) for a review]. The degree of their deficits in tone perception varied tremendously from individual to individual. Tone perception performance of these children ranged from chance level to as high as 80% correct. Some studies observed postoperative improvement of tone perception to about 65% correct (e.g., Wei et al., 2000), whereas other reports demonstrated that children with CIs could only perceive tones with an accuracy slightly above chance (Lee et al., 2002; Ciocca et al., 2002). With the limited tone exposures that the current CIs provide, prelingually deafened children also experience difficulties in tone production due to the lack of acoustic feedback. Recent studies (Xu et al., 2004; Han et al., 2007; Peng et al. 2004) all showed that a majority of the prelingually deafened children with CIs did not master Mandarin-Chinese tones. Moreover, age at implantation and duration of device use appeared to correlate with tone development of children with CIs (Wu and Yang; 2003,Wu et al., 2006; Peng et al., 2004; Han et al., 2007).
The current methods used for evaluating Mandarin tone production involve mainly acoustic analysis and perceptual judgments from adult native speakers. Methods based on acoustic analysis for evaluating Mandarin tone production of either normal hearing (NH) or CI users are still limited. Xu et al. (2004), in their preliminary reports of Mandarin tone production in children with CIs, described the CI children's Mandarin-Chinese tone production by presenting the F0 contour of each tone produced by individual children. Wang et al. (2003) studied nonnative speakers' tone production by comparing their F0 contours to an averaged native form. They normalized the duration and height of F0 contours of the speakers to fit their F0 range in levels arranging from 1 to 5 corresponding to the five-point pitch scale for Mandarin tone proposed by Chao (1948). Five evenly spaced F0 values were chosen to compare with the native forms. Analysis of variance was performed to evaluate whether the mean deviation between the native and nonnative production differed across positions on an F0 contour. Although the pitch contours were examined, neither study quantified the acoustic properties of the tone production. In contrast, a more sophisticated method of acoustic analysis was developed by Barry and Blamey (2004) for Cantonese tones. They studied the tonal ellipses generated over the scatter plots of the onset versus offset values of the F0 contours. The spread and degree of overlap among tonal ellipses were quantified to indicate the degree of differentiation among Cantonese tones.
A more commonly used method to the assessment of Mandarin tone, however, has been perceptual judgments. It is widely used to evaluate speech outcome for NH subjects, and especially for CI users. We used a four-alternative forced-choice perceptual test (Xu et al., 2004; Han et al., 2007) in which native adult speakers of Mandarin were presented with audio recordings of the subjects' tone production and were required to identify the tones they heard. Methods using auditory judgment involved measuring the correctness of tone production on equal interval scales (e.g., Peng et al., 2004). The problem with the perceptual studies is the limited information they offer about the property of tone production besides percentage scores.
In summary, the existing methods for evaluating tone production in Mandarin-speaking implant users are limited and are largely restricted to the use of perceptual intelligibility judgments. We aimed at further developing methods for evaluating tone production of Mandarin-speaking CI users and to assess the efficacy of the methods.
We followed the approach of Barry and Blamey (2004) that was used for assessing Cantonese tone production, and adjusted and expanded that approach to accommodate its use for Mandarin Chinese. In the present study, the two indices of differentiation first developed by Barry and Blamey were modified based on the differences of the two languages, the differences being the number of tones as well as their acoustic properties [see Ciocca et al. (2002) for a review]. In addition, a new index that allows the examination of the degree of differentiation of an individual tone from the others was proposed.
Although examination of the tonal ellipses can reflect the degree of differentiation among tones, it does not provide a complete description of the Mandarin-Chinese tone contours. The approach used by Wang et al. (2003), which attempted to examine the tone contours of nonnative speakers by calculating their deviation from the native forms, involved also only five positions on the contours. We proposed a cross-correlation method that uses a common technique for random signal processing to study the correlation of two contours. It makes possible a direct comparison of F0 contours produced by each child with a CI with the normative contours and yields a correlation coefficient to indicate the degree of similarity between the contours.
In addition to the acoustic analysis, we also developed an artificial neural network to classify the tones produced by CI users. Neural network classifiers are able to emulate perception of human sensory functions. In such neural networks, simple nodes, or neurons are interconnected to form a network, which operates on a principle similar to biological neurons. Training of the neural network enables it to learn by adjusting its parameters and to generalize the acquired knowledge to new situations like humans do. A neural network bases its working mechanism on a defined mathematical algorithm and classifies tones into categories much like how perception works. Several studies have used artificial neural networks to classify Mandarin or Cantonese tones (Chang et al., 1990; Wang and Chen, 1994; Lee et al., 1995; Lan et al., 2004; Xu et al., 2006, 2007; Zhou et al., 2007). In our recent study, a feedforward multilayer perceptron was used to recognize the tones produced by a group of Mandarin-speaking children with NH (Xu et al., 2007). In the study, it was found that, in terms of recognition accuracy, performance of the multilayer perceptron was comparable to that of human listeners and was even superior to human ears when the classification task involved a large number of speakers and tokens (Xu et al., 2007). The rationale for using a neural network in addition to the acoustic analysis in the present study was that the neural network could not only produce human perception-like performance, but also operates automatically and economically.
To examine the relative utility of the proposed acoustic analysis and neural-network approaches, a traditional tone perception task was carried out using native-Mandarin-speaking listeners. Further, a correlational analysis was conducted for each pair of the measures including the perceptual results. Information that these measures provide and their strength and limitations were further discussed.
Considering the relative independence of each approach, we describe and discuss the tonal ellipse analysis, contour correlation analysis, neural network, and perception tests separately in Secs. II–V. General discussions are provided in Sec. VI.
II. Acoustic Analysis Based on Tonal Ellipses
A. Methodology
1. Subjects and recording procedures
Two groups of native Mandarin-Chinese-speaking children were recruited. One group consisted of 14 prelingually deafened children who had received CIs from the Cochlear Implant Center of Beijing Tongren Hospital, China. There were no specific criteria for recruitment in terms of age, device experience and type, or other contributing factors of tone production. Our sampling provided cross-section data on tone development. Their chronological ages ranged from 2.9 to 8.3 years old (5.2±1.8, mean ± SD). Five of the fourteen children used hearing aids before the implantation. The implants that they had received included Clarion CII, N24M, and N24R. The duration of CI use ranged from 0.3 to 2.6 years (1.7±0.8, mean ± SD). All of them had received rehabilitation at professional rehabilitation centers in Beijing after implantation with the amount of rehabilitation varied. Their demographic information is summarized in Table I. The control group consisted of 61 NH children from kindergartens and elementary schools in Beijing. The ages of the NH children ranged from 3.1 to 9.0 years old (6.2±1.7, mean ± SD). All the 61 NH children had a pure tone average (at 500, 1000, and 2000 Hz) ≤20 dB HL.
Table I.
Demographic information of the CI subjects. The order of the subject number is consistent with that in Fig. 1. The order follows the perception scores by the adult listeners on tone production of individual children with CIs, from high to low.
| Subject number | Gender | Age at implantation (years) | Chronological age (years) | Duration of implant use (years) | CI device |
|---|---|---|---|---|---|
| 1 | F | 3.10 | 5.51 | 2.41 | N24M |
| 2 | M | 1.16 | 2.93 | 1.77 | Clarion CII |
| 3 | M | 1.50 | 3.60 | 2.10 | N24M |
| 4 | F | 2.05 | 4.27 | 2.22 | N24M |
| 5 | M | 1.32 | 3.38 | 2.06 | N24M |
| 6 | M | 5.73 | 8.33 | 2.60 | N24M |
| 7 | M | 3.90 | 5.50 | 1.60 | Clarion CII |
| 8 | M | 2.60 | 2.91 | 0.30 | N24R |
| 9 | F | 5.19 | 7.53 | 2.34 | Clarion CII |
| 10 | F | 2.59 | 4.41 | 1.82 | N24M |
| 11 | F | 5.56 | 6.53 | 0.97 | N24R |
| 12 | F | 4.55 | 5.35 | 0.79 | N24R |
| 13 | M | 1.70 | 4.27 | 2.57 | N24M |
| 14 | M | 7.09 | 7.67 | 0.58 | N24R |
To collect their tone production samples, both groups of children were instructed to produce tones 1–4 for the following monosyllables: ai, bao, bi, can, chi, du, duo, fa, fu, ge, hu, ji, jie, ke, la, ma, na, pao, pi, qi, qie, shi, tu, tuo, wan, wen, wu, xian, xu, ya, yan, yang, yao, yi, ying, you, yu, yuan, zan, zhi. These syllables were chosen because when associated with the four tones, they all produce real words in Mandarin Chinese. The children heard each of the syllables in its high flat tone, and were asked to produce the syllables in four tones. The children's familiarity with the words was not a concern because language education in kindergartens and elementary schools in Beijing greatly emphasizes tone drills. The tone drills require producing four tones for any syllables even though the children might not know the words. The elicited production of the monosyllabic words was digitally recorded at a sampling rate of 44.1 kHz with a 16-bit resolution in quiet rooms with ambient noise typically round 40 dB SPL. In total, 9760 tone tokens were obtained (40 syllables × 4 tones × 61 speakers) from the NH control group, and 2240 tone tokens were obtained (40 syllables × 4 tones × 14 speakers) from the CI group. The mean and standard deviation of the durations of all the 9760 and 2240 tokens from the NH and CI groups were 511.31±30.18 and 610.50±35.26 ms, which were significantly different [t(73)=10.75, p<0.001]. It was evident that the typically developing NH children sometimes produced inaccurate tones. One legitimate approach would be to exclude those inaccurate tone tokens from the normative data. However, we regarded the errors as part of the development process in the typically developing children. Therefore, all the tone tokens from the NH children were included as normative data in the analysis.
2. F0 extraction and F0 onset–offset plotting
The F0 contours of the vowel part of the monosyllabic words were extracted using an autocorrelation algorithm. Although there are other cues that contribute to Mandarin tone perception, the focus of this research was F0, as the major problem with tone development in CI users has been the unresolved F0. The update rate of the F0 extraction was 8 ms with a frame size of 24 ms. The lower and upper boundaries for the extraction were 50 and 500 Hz. The extracted F0 contours were plotted onto and compared with the narrowband spectrograms (window size = 13.61 ms) generated from matlab (MathWorks, Natick, MA) to verify the accuracy of F0 extraction. The extraction might sometimes include a small part of the preceding voiced consonant, but the voicing of the consonant usually does not produce reliable F0 (Duanmu, 2000). The unreliable F0 data points from the voiced consonant could be easily identified and manually deleted based on the narrowband spectrograms. Occasional errors of halving or doubling were also manually corrected with reference to the narrowband spectrograms.
The offset values of the F0 contours were plotted against the onset values for each tone token. To summarize the distribution of the onset–offset plots for each child, tonal ellipses around each tone type were plotted in a manner similar to that introduced by Barry and Blamey (2004). First, the inclination of an ellipse (i.e., the direction of the semi-major axis of the ellipse) was determined by the positive angle of the linear fit of the data points of a particular tone. The ellipse center was located using the mean of the F0 onset values along the fitting line. A perpendicular line to the fitting line defined the direction of the semiminor axis. The lengths of the semimajor and the semiminor axes were determined by two standard deviations of all data points away from the center along the linear fitting line and the perpendicular line, respectively. Thus, each tonal ellipse encompassed 95% of the onset–offset data points of a tone category. The plot of the F0 onset and offset values capture the extreme values of the F0 contours of a Cantonese speaker. Barry and Blamey (2004) defined such a plot as the tonal space. In Mandarin Chinese, the plot of the F0 onset and offset values should also capture most of the extreme values of the F0 contours except sometimes for tone 3. Thus, we regarded such a plot as approximating the tonal space in Mandarin Chinese.
3. Definition of the three indices
The four tonal ellipses that outlined the F0 onset–offset data points were used for studying the differentiability of the tones. Following Barry and Blamey (2004), Index 1 was defined by the ratio of two areas, i.e., At over . At was the area of the triangle formed by joining the centers of the three most differentiated tonal ellipses in Cantonese, which was referred to as the tonal area. was the averaged area of these three ellipses. Based on the lengths of the semiminor (a) and semimajor (b) axes of the ellipse, an ellipse area was calculated using a×b×π.
The reason that only three tonal ellipses were chosen for analysis was that Cantonese has six tones and their tonal ellipses are relatively crowded in the tonal space. In contrast, the tonal ellipses for Mandarin Chinese tones are more separable in that each of the four tonal ellipses is located in one of the four quadrants of the tonal space. Specifically, the flat tone 1 with an F0 onset–offset pair that is high and similar in level, is located in the upper right-hand quadrant; the rising tone 2 with a low onset and high offset is in the upper left-hand quadrant; the low dipping tone 3 with both median onset and offset is in the lower left-hand quadrant; and the high falling tone 4 with the high onset and low offset is in the lower right-hand quadrant (see Fig. 1, top left-hand panel). Thus, connecting the centers of the four tonal ellipses, which forms a quadrangle, measures the span of the F0 range for Mandarin Chinese tones. Index 1 of Barry and Blamey (2004) was then modified for Mandarin Chinese using:
FIG. 1.

(Color online) Tonal ellipses of one NH child (subject NH15) and the 14 children with CIs. The data from the representative NH child is shown in the top left-hand panel. The remaining panels are organized in the order of tone production accuracy scores provided by human listeners (see Sec. V) for each CI child. The tone production accuracy score (percent correct) is shown in the upper right-hand corner of each panel. Each data point represents a pair of F0 onset–offset value of a monosyllabic word. Different symbols represent different tones as indicated by the legend in the top left-hand panel.
| (1) |
where Aq is the area of the quadrangle and is the averaged area of the four ellipses.
Index 2, also proposed by Barry and Blamey (2004), was the ratio of the averaged lengths of the two axes for six Cantonese tonal ellipses and the averaged distance of the centers of the six tonal ellipses from each other. In the present study, this index was adopted for the four Mandarin Chinese tones:
| (2) |
Because Index 1 and Index 2 used the parameters of the four tonal ellipses to measure the overall differentiability of the four tones, these indices did not measure the separability of a particular tone from the other three. A new index was developed to examine the false detections of any individual tone. This index enabled us to infer the degree of differentiation of that tone from the others. As a result of the overlap of tonal ellipses, a given tonal ellipse might enclose not only data points from that tone category but also data points from the other tone categories. Data points from the target tone were considered hits, whereas the data points from all other three tones were categorized as false detections. To determine whether a data point was enclosed by a given tonal ellipse, the position of the data point relative to the ellipse was evaluated using the ellipse function (i.e., x2/a2+y2/b2−1=0, where a and b are the semimajor and semiminor of the ellipse, and x and y are the coordinates of a data point). The coordinates of the data point were first adjusted using the ellipse center as the origin of the axes. If x2/a2+y2/b2−1>0, then the data point was outside the ellipse. If x2/a2+y2/b2−1<0, then the data point was counted to be within the ellipse. For all the data points that were in a particular ellipse, they were further categorized as hits if they were identified to be from the target tone, or false detections if they were from other tones. The false detection probability (Pfd) of the target tone was defined as the probability of other tones being falsely recognized as the target tone. It was calculated as the number of false detections over the total number of data points from the other three tones. Index 3 was thus defined as
| (3) |
B. Results and discussion
Tonal ellipses were generated for each tone for individual children. The tonal ellipses of one typical NH child (NH15, 6.2 years old) and the 14 children with CIs are shown in Fig. 1. The tonal ellipses of the NH child demonstrated an easily separable pattern, with four tonal ellipses being located in the four quadrants of the child's tonal space. The ellipses of tones 1 and 2 were completely separable from those of tones 3 and 4. Although the ellipses of certain tone pairs overlapped, they were still spatially separable. The data points for tones 1 and 2 were relatively densely clustered and restricted to a location in the tonal space. As a result, the sizes of these tonal ellipses were small. The small size of the ellipses suggests small variances in these data points, which in turn indicates that the child had consistent use of F0 range for tone 1 and tone 2. Such an easily separable pattern of ellipses was compromised to various degrees in the plots for the children with CIs. For some children with CIs, their data points scattered from the center of the ellipses, leading to larger sizes of the tonal ellipses. This suggests that they lacked a consistent use of F0 range to produce a certain tone. For those children with CIs whose tonal ellipses were comparatively small, the centers of their ellipses, however, shifted toward each other from the locations observed in the NH children. Consequently, the tonal ellipses largely overlapped with each other. The loss of contrast among tones in their F0 onset and offset characteristics could lead to the overlapping ellipses, thus a decreased degree of differentiation.
Two components of Index 1 quantify the size and separation of the tonal ellipses. Recall that is the averaged area of the four tonal ellipses. of the NH children did not differ from that of the children with CIs (Wilcoxon rank sum test, z=1.54, p=0.1228), which suggests that the two groups had comparable variability in F0 use for individual tones. Interestingly, of the NH children showed a nonlinear decrease with their ages (Fig. 2), a trend of developing toward a smaller variation in F0 use for individual tones. The development appeared to saturate at around 6 years of age. Data analysis revealed that it was mainly the ellipses of tones 3 and 4 that decreased in size with age. It is worth noting that Barry and Blamey (2004) found the tonal ellipse size of their NH children was even larger than that of the CI group. This discrepancy might be due to a younger age of their NH children group (all ≤6 years old). The majority of their group might still be in the process of developing tone normalization skills (Barry and Blamey, 2004). There was no correlation found between ellipse size and chronological age or duration of implant use for the CI group (p>0.05). It is possible though that the children with CIs may need more device experience to develop tone production skills. Although the F0 use of individual tones used by the NH children did not show a more confined pattern than the children with CIs, Aq (i.e., the tonal area that connects the centers of the four ellipses) for the NH children was in average three times larger than that of the CI group and this difference was statistically significant (Wilcoxon rank sum test, z=4.11, p<0.0001). The broader tonal area of the NH children compensated for their diffused tonal ellipses such that the tonal ellipses were still differentiated from each other. In contrast, the equally diffuse tonal ellipses coupled with the small tonal area of the children with CIs resulted in their poorly differentiable tones. The shrunken tonal area of the children with CIs was also observed in the study by Barry and Blamey (2004) of native Cantonese speakers.
FIG. 2.
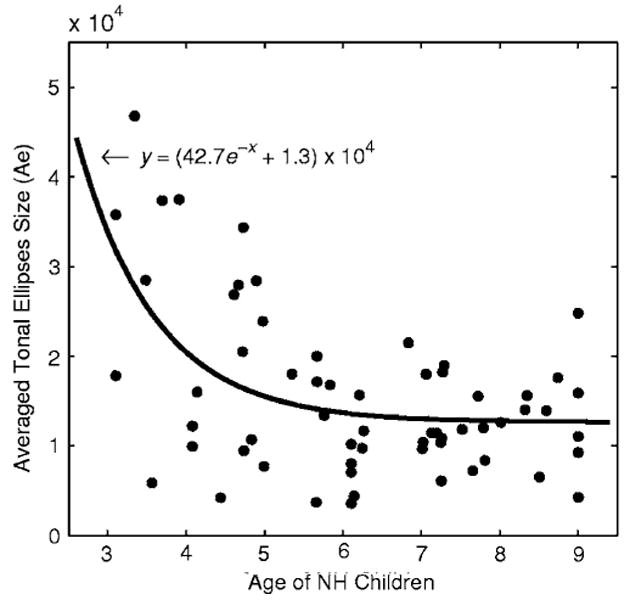
Averaged tonal ellipses size ( ) as a function of age of the NH children. An exponential fitting is plotted with the solid line. Each symbol represents one NH child.
For all the three indices, the greater the value, the more differentiated the tones were. Values of the three indices obtained from the 14 children with CIs were compared with those of the 61 NH children (Fig. 3). The NH data were grouped together to be compared with those of the CI group, because although there was age differences in pitch range use (i.e., ) by the NH children, their Aq and scores of Index 1 were not found to correlate with age (p>0.05). Besides, the number of children with CIs was too small to be further divided into age or hearing age subgroups. The results of the nonparametric two-sample tests showed that the two groups differed on all three index comparisons (Wilcoxon rank sum test, Index 1: z=−4.78, p<0.0001; Index 2: z=−4.96, p<0.0001; Index 3: z=−4.98, p<0.0001). The tones produced by the CI group were significantly less differentiable than those produced by the NH group as indicated by the index comparisons.
FIG. 3.
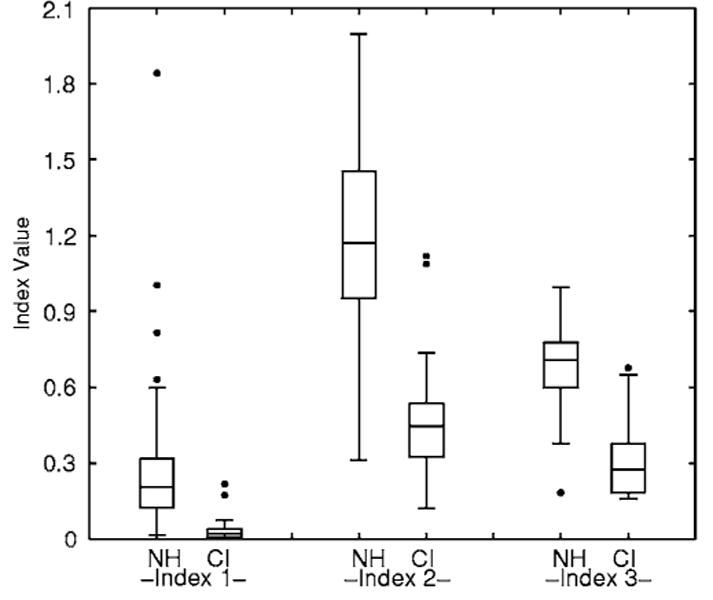
Box plots of the values of three indices (from left to right) for the NH and CI groups. Each box depicts the lower quartile (Q1), median, and upper quartile (Q3). The whiskers show the range of the rest of the data. The outliers plotted with filled circles are data points that fall more than 1.5 box-lengths (Q3–Q1) away from the lower or upper quartile.
The mean value of the probabilities of false detection (i.e., Pfd) for each tone category was obtained for both groups of children. For the CI group, the probabilities of other tones being falsely recognized as tones 1–4 were 0.644, 0.711, 0.767, and 0.725, respectively. The corresponding averaged values of Pfd for tones 1–4 for the NH children were 0.228, 0.249, 0.406, and 0.389, respectively. Results of t test confirmed that Pfd for the NH children was significantly lower than that for the children with CIs on all tone comparisons [tone 1: t(73)=−6.55, tone 2: t(73)=−7.89, tone 3: t(73)=−3.83, tone 4: t(73)=−3.82, all p<0.001].
Indices 1 and 2 from Barry and Blamey (2004) were modified to measure the degree of differentiation for Mandarin Chinese tones. One limitation of Index 1 for Cantonese was that the overall differentiability of the six tones was evaluated based on the measures for only three of them. Our Index 1 evaluated all four tones in Mandarin Chinese to obtain their overall differentiation, thus the evaluation might be more accurate than what Index 1 for Cantonese provides. Another limitation of Index 1 for Cantonese as pointed out by Barry and Blamey was that the centers of the three tonal ellipses that defined the triangle could fall onto a line, which resulted in a zero tonal area. With four tonal ellipses, Index 1 for Mandarin Chinese used a quadrangle to represent the tonal area, thus greatly reducing the probability of having a zero area.
From the point of view of Signal Detection Theory (Green and Swets, 1966), Indices 1 and 2 are essentially analogous to the discriminability index d′ (Barry and Blamey, 2004). The d′ describes how differentiable a signal is from noise by evaluating the separation between the signal-plus-noise distribution and the noise-alone distribution (Green and Swets, 1966). The d′ is defined by dividing the difference between means of the two distributions by their variances. For Index 1, the tonal area, (i.e., Aq) represents the separation among the distributions, whereas the averaged area of the ellipses (i.e., ) reflects the pooled variance of the distributions. For Index 2, the averaged distances between any two ellipse centers (i.e., Ave Dist.) likewise represents the separation between the distributions and the averaged lengths of the semiminor and semimajor axes (i.e., Ave Ax1+2) reflect the pooled variance of the distributions. Suppose only two distributions were examined instead of four (i.e., four tonal ellipses), or only one instead of two variables (i.e., onset and offset) were studied, the two indices would be equivalent to the d′ described in the classic Signal Detection Theory (Green and Swets, 1966). In essence, Indices 1 and 2 measured the overall separability of the four tones based on the two variables.
Index 3 provided a direct description of the overlap of tonal ellipses in terms of an averaged false detection probability of four tones. The main strength of this measure is that such description (Pfd) can be made for each individual tone, as opposed to an overall description of the differentiation of tones as provided by Indices 1 and 2. Further, the ellipse size used for determining the counts of false detections could be optimized according to a desired level of detection and false alarm probabilities. Such optimization can be performed separately for individual tones, thus allowing greater flexibility in adjusting the threshold of detection.
In order to evaluate the relationship between the indices, the correlation coefficients between each pair of the indices were computed. Figure 4 shows the scatter plots of pairs of indices obtained from the 14 children with CIs. Each pair was highly correlated and the correlations were all significant after controlling for family-wise type I error using Bonferroni correction [r12=0.94, r13=0.95, r23=0.98, p<0.0167]. The high correlation between each pair of the indices indicates that they are consistent with each other in evaluating tone differentiation of the CI children's production.
FIG. 4.

Correlation between each pair of the three indices. Each data point represents one child with a CI.
III. Acoustic Analysis of F0 Contours
A. Methodology
1. Standard F0 contour from NH children
The F0 contours of the Cantonese tones are either flat, rising, or falling. The use of the onset–offset pair for analyzing Cantonese tones is justified because the two endpoints can catch most of the F0 contour information of Cantonese tones such as direction and level. As shown in the previous section, the use of the onset–offset endpoints is also effective in differentiating Mandarin Chinese tones because the tonal ellipses have restricted locations in the tonal space. However, this method does not characterize the F0 contours for Mandarin Chinese tones that have complex contours such as tone 3. That is because these tones do not have simple rising or falling patterns, the direction and slope of which cannot be characterized by the two endpoints of the contours. This section explores a way to characterize a complex F0 contour by comparing it to a normative standard. The approach is based on cross correlation, a measure of similarity between two signals.
The normative contour for each of the four tones was obtained from the 61 NH children by averaging all the contours for each tone produced by these children. The 9760 F0 contours extracted from the 61 NH children were uneven in duration thus different in sampling numbers. To obtain an averaged value at a given time, normalization of F0 contour duration and interpolation of F0 samples were performed. The mean duration of the contours for each tone category was calculated and the longest among the four (i.e., 334 ms) was chosen as the target duration for normalization. Then, all the tone tokens were normalized to the target duration. After the normalization of duration, that is, stretching or squeezing the contours to the same length, the F0 samples on all the contours became no longer aligned on the time axis. In order to average them at any given point on the time axis, linear interpolation, or resampling of the F0 contours was performed. The interpolation rate for a tone category was determined by the number of samples greatest in that tone category divided by the normalization duration. After normalization and interpolation, the contours with time-wise matched F0 samples were then averaged for each tone to generate four normative contours (Fig. 5, upper panel). The normative contours of the four tones were then used as the standard for comparisons with the F0 contours produced by each CI child.
FIG. 5.

(Top) Normative contours of the four tones plotted from left to right in solid lines. The contours were averaged from the 61 NH children. The dotted lines represent one standard deviation from the mean. (Middle and bottom): Mean F0 contours of two children with CIs (CI2 and CI12) plotted onto the normative contours for tones 1–4. The normative contours are in dashed lines and the mean F0 contours of the children with CIs are plotted in solid lines. The R values of the contour correlation are shown for each comparison. Both duration of the tones and the F0 level of all the contours were normalized.
2. Comparing F0 contours using cross correlation
To compare the contours produced by the CI children with the normative ones, four averaged contours for each CI child were generated using the same methods of normalization and linear interpolation as described earlier. The normalization duration and interpolation rate were matched with those used for generating the normative contours. This was to ensure the same length and same number of samples for any pairs of contour comparison. Because the contours of children with CIs and the normative contours may differ in F0 levels, they were all normalized in level by forcing the mean F0 sample values of the contours to zero.
The overall similarity in the patterns of the F0 contours produced by children with CIs to the normative ones was evaluated by cross correlation with a zero-time shift. Cross correlation is commonly used to find features in an unknown signal by comparing it to a known one. It involves shifting the unknown signal in time and multiplying it by the known signal, thus it is a function of the relative time between the two signals (Couch, 1996). In our case, however, the similarity between two F0 contours was measurable only when they were aligned in time. Therefore, we were only interested in the output of cross-correlation function at zero-time shift, which was thereafter referred to as contour correlation and was calculated using
| (4) |
where F0T stands for the normalized F0 contour of a child, F0S stands for the normative F0 contour, and N denotes the total number of samples.
Note that F0T and F0S are two zero-mean time sequences. If the two contours show opposite patterns, multiplication of the two [i.e., F0T×F0S] will result in a negative R value. If a contour deviates randomly from the normative contour, the result of the multiplication [i.e., F0T×F0S] will have similar properties to a zero-mean random sequence, which in turn causes the R value to approximate zero. On the other hand, if F0T and F0S show similar patterns, multiplication of the two will result in a positive R value. Note that for the previously described multiplication to work, the two sequences or contours must be normalized to have zero mean. The F0 height normalization procedure developed by Rose (1987, 1993) transforms F0 values to Z scores based on the overall mean F0 value of a particular speaker. Rose's method reduces between-subject variations and clusters their F0 contours to better summarize the acoustic characteristics of a given tonal language. This normalization method however does not produce zero-mean F0 contours thus does not suit our purpose here.
B. Results and discussion
The overall similarity of each child's contours to the normative contours was examined. Two examples of the comparisons were plotted in Fig. 5 (lower panels), where the contours from two children with CIs (CI2 and CI12) were plotted over the normative contours. The contour of tone 4 of subject CI2 followed the normative contour closely and the calculation of R yielded a large positive value. In contrast, the contour of tone 3 of the child and the normative contour had a quite different pattern, thus the R value became negative. The contours of all tones produced by subject CI12 were essentially flat. Consequently, the R values for all four tones approximated zero.
Contour correlation was very sensitive to comparing two F0 contours that had noticeable F0 change with time. These include contours of tones 2, 3 and 4. R value can clearly indicate the similarity in the patterns of these tones. An example can be seen from the comparison of tone 4 for subject CI2 (Fig. 5). On the other hand, this approach did not show comparable sensitivity to comparing tone 1. That is because F0 values of tone 1 fluctuate only slightly around a constant level. The similarity in patterns of tone 1 contours cannot be adequately evaluated by the contour correlation, because multiplication of two near-zero vectors produces R value approaching zero (Fig. 5).
Although the R values could not precisely estimate the similarities between the contours of tone 1, an averaged R value across tones could still successfully reflect the quality of tone production of a CI child. To compare whether the contours produced by the NH children had patterns more similar to the normative contours than that of children with CIs, the contour correlation was also calculated individually for the NH children. The averaged R values of children with CIs ranged from −240.5 to 388.9, with a median of 120.1. The R values of the NH children ranged from 92.3 to 397.5 with a median of 249.2 (Fig. 6). The two distributions were easily differentiable. The R values from the NH were all positive, whereas that of children with CIs were spread across zero. The results of the two-sample independent t test confirmed that such a difference between the two groups was statistically significant [t(73)=5.49, p<0.001]. The significant difference suggested that the use of contour correlation was effective in detecting the differences between the two groups in terms of the overall similarity of their F0 contours to a normative standard. The R values for the CI group averaged for each tone were 5.2, 83.7, −70.9, and 394.2, respectively. Although the result of the contour correlation was not particularly indicative for the quality of production of tone 1, tone 4 was otherwise singled out as the best produced tone by the CI children.
FIG. 6.
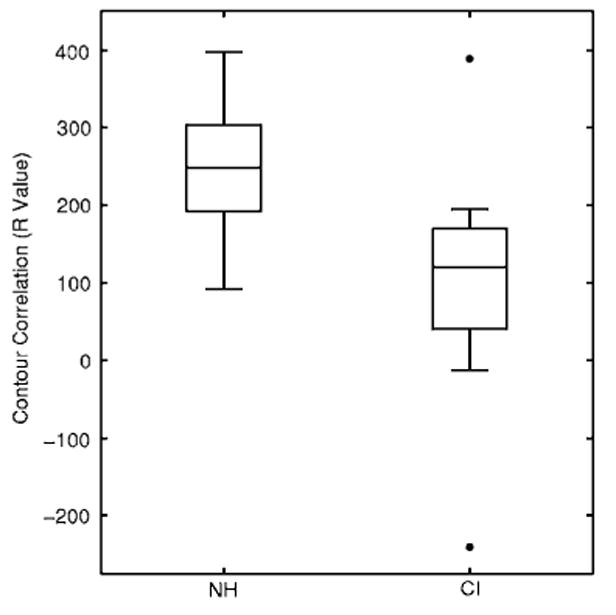
Box plots of the contour correlation (R values) for the NH and CI groups. Each box depicts the lower quartile (Q1), median, and upper quartile (Q3). The whiskers show the range of the rest of the data. The outliers plotted with filled circles are data points that fall more than 1.5 box-lengths (Q3–Q1) away from the lower or upper quartile.
IV. Neural Network Analysis of F0 Contours
A. Methodology
1. Neural network and its structure
A feedforward backpropagation multilayer perceptron (MLP) was implemented in matlab with the Neural Network Toolbox and used to recognize the tone production of the children with CIs. The neural network had three layers, i.e., an input layer, a hidden layer, and an output layer. Inputs to the MLP were F0 contours. Based on our previous studies on optimization of neural-network configurations for Mandarin Chinese tone recognition (Xu et al., 2006, 2007; Zhou et al., 2008), the number of inputs was set at 12. The F0 contour was evenly segmented to 12 parts, and the averaged F0 value for each part made up the inputs to the neural network. The number of neurons in the hidden layer was set at 16. The output layer of the neural network consisted of four neurons representing the four Mandarin Chinese tones. The Levenberg–Marquardt optimization was used as the training algorithm (Hagan and Menhaj, 1994). Our previous study (Xu et al., 2007) indicated that this neural network was highly tolerant to between or within F0 variation in children speakers. Therefore, no normalization procedure was necessary for adjusting the height of input F0s.
2. Evaluation of tone production of children with CIs with the neural network
The neural network was trained with all the tone tokens from the 61 NH children. Training was stopped when the sum of squared errors became less than 0.01. Given the large amount of training data compared to the testing data, to avoid overfitting, the number of iterations for the training was set at 50. Overfitting refers to the situation in which the neural network starts to learn patterns in the noise signal due to too many training iterations or too many hidden neurons used, which results in poor performance in real test conditions.
The tone tokens of each CI child were tested with the neural network upon the completion of training with the tone tokens from the NH children. Half of the tone tokens from each CI child were tested 10 times with different randomization of inputs. A tone confusion matrix was used to describe the error patterns by the CI group.
B. Results and discussion
The mean recognition rate for each CI child was obtained. The recognition scores ranged from 13.5% to 69.6% correct (41.1% ± 15.8% correct). The averaged recognition scores for tones 1–4 by the children with CIs were 66.4%, 27.4%, 23.5%, and 46.8% correct, respectively. Note that the level tone 1 was more accurately recognized than any of the contour tones, and the falling tone 4 was better recognized than the rising tone 2. The confusion matrix revealed that 30%–40% of the time, the contour tones (i.e., tones 2, 3, and 4) produced by the children with CIs were recognized as tone 1 (Fig. 7). The same neural network was used for recognizing the tones of the 61 NH children in our recent work (Xu et al., 2007). The corresponding recognition scores for the four tones by the NH children were 91.3%, 88.5%, 71.7%, and 83.9% correct, respectively. A group of t tests indicated that the recognition scores for the NH children were significantly higher than those of children with CIs for all tones [tone 1: t(73)=5.38, tone 2: t(73)=13.87, tone 3: t(73)=7.95, tone 4: t(73)=6.28, all p<0.001].
FIG. 7.
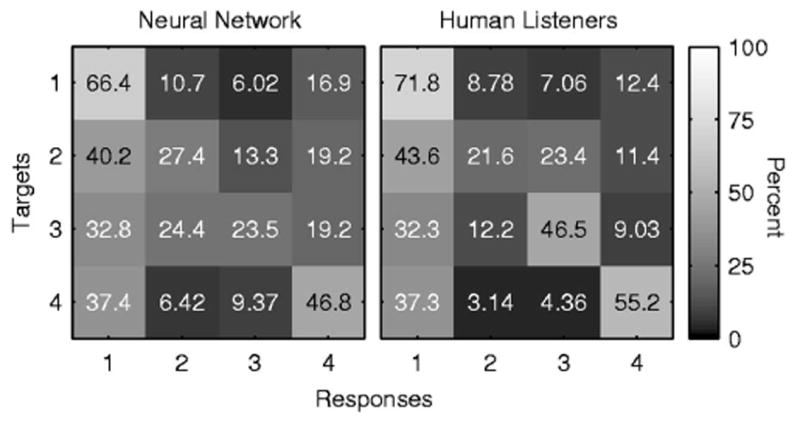
The tone recognition error patterns by the neural network (left) and by human listeners (right). The value in the cell of row j and column k is the percent of times stimulus tone j was recognized as tone k (j=1,2,3, or 4; k=1,2,3, or 4). The gray scale in each cell reflects the value in it with reference to the color bar on the right.
V. Perceptual Study
A. Methodology
Eight NH adult native-Mandarin-Chinese speakers were recruited from Ohio University for the tone perception tests. The group included seven female and one male adult listeners, with ages ranging from 26 to 43 years. A hearing test was performed for each adult listener to confirm that his/her pure tone thresholds were ≤20 dB HL at octave frequencies from 250 to 8000 Hz.
A custom graphical user interface was developed in matlab to present the tone tokens and to collect the listeners' responses. The tone perception tests were done in an IAC double-walled sound booth. All the tone tokens (i.e., 12 320=9760+2560) from both NH and CI groups were randomized and half of them (i.e., 6160 tokens) were presented at the most comfortable level to the listeners via a circumaural headphone (Sennheiser, HD 265). The listeners were instructed to use a computer mouse to click on a button labeled 1, 2, 3, or 4 after each presentation of the stimulus to indicate the tone of the speech token that they had heard. Clicking on any of the buttons activated the presentation of the next tone token. It took approximately 5–6 h for each listener to complete the tone perception test.
B. Results and discussion
The tone perception scores were sorted out for each CI and NH child and the mean scores across all eight adult listeners were used to represent the tone production accuracy. The percent correct scores for the children with CIs ranged from 17.4% to 78.3% correct (48.5% ± 19.2% correct). Scores for the NH children ranged from 57.2% to 96.7% correct (79.9% ± 7.9% correct), which was significantly higher than that of the CI group [t(73)=9.8, p<0.001].
Percent correct scores varied for individual tones. They were 71.8%, 21.6%, 46.5%, and 55.2% correct for tones 1–4, respectively, for the children with CIs. For comparison, percent correct scores for individual tones produced by the NH children were 94.6%, 86.6%, 45.1%, and 93.2% correct for tones 1–4, respectively. Both groups showed patterns of better scores on the level tone 1 and falling tone 4. The rising tone 2 was perceived to be particularly poorly produced by the CI group. Consistent with the findings of the confusion matrix from the neural network, the confusion matrix from the perception tests also showed that the intended contour tones by the children with CIs were perceived as tone 1 about 30%–40% of the time (Fig. 7). It is worth noting that the preferred choice of tone 1 by the adult listeners reflects the monotonic features of the production of these children. It suggests that they either attempt to manipulate pitch in vain or that the limited tone information they receive through the implants hinders them from developing satisfactory tone production. Except for the 20 percentage points higher perception score on tone 3, the error patterns from the perception tests were in accordance with those from the neural network analysis.
VI. General Discussion and Conclusions
Several approaches were proposed and used for evaluating Mandarin Chinese tone production. The measures included three indices based on the acoustic analysis of the F0 onset–offset pair, contour correlation based on the examination of the patterns of F0 contours, and perception like classification based on the neural network analysis. These methods measure different aspects of tone production. The three indices evaluate the differentiation of tones. Indices 1 and 2 measure the overall differentiation of tones, whereas Index 3 breaks down to false detection probabilities of each tone category thus measures the differentiation of one particular tone from the others. The two components of Index 1 provide further information of pitch use and pitch range of a speaker. The tonal ellipse size measures variation of F0 use for individual tones, whereas the tonal area measures the F0 span used for all tones. The coefficients (i.e., R values) of the contour correlation evaluate the degree of similarity between two F0 contours. Although the previous acoustic measures describe certain acoustic properties of tone production, the neural network provides direct classification results, from which the recognition percent correct scores as well as tone confusion matrix can be generated.
These measures analyze different components of tone production. Pearson's correlation was performed for any two approaches, including results of the perceptual tests. The results of the correlations showed that any pairs of the approaches were significantly correlated after controlling for the family-wise type I error using Holm correction (i.e., Bonferroni step-down correction, family-wise α=0.05). In the order of level of correlation, neural-network recognition and perception test correlated with the greatest level, followed by neural-network recognition with contour correlation, contour correlation with perception test, neural network with Indices 1, 2, and neural network, and perception test with Index 3 (Fig. 8).
FIG. 8.
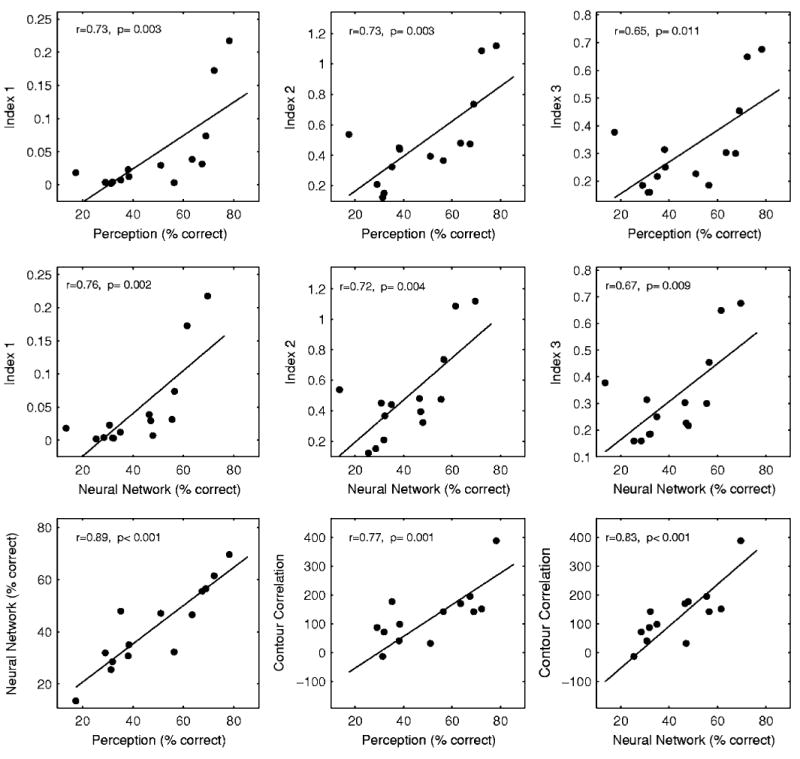
Correlation among measures. (Top) Pearson's linear correlation between the perceptual scores and the three indices; (middle): Pearson's linear correlation between the scores of neural network and the three indices; and (bottom): Pearson's linear correlation between the perceptual scores and the scores of the neural network, contour correlation and the perceptual scores, and the scores of neural network and the contour correlation. Each symbol represents one child with a CI. The solid line represents the linear fit of the data in each panel.
The differences in the level of correlation are related to the nature of the analysis each measure entails. The three indices using the F0 onset–offset scatter plot mainly concern the level and slope of the F0 contour, whereas the contour correlation examines the patterns of the F0 contour. Contour correlation uses all the available samples from an F0 contour and it showed greater consistency with human perception and the neural network than the indices did. Regarding the strength of correlation to the perception test, neural network correlated better with the performance of human listeners than the contour correlation. Given the nature of the input to the neural network, it takes into account both dimensions (i.e., endpoints and pattern) of the F0 contours in the classification. As perception is also likely to involve the use of both level and contour cues, it is not surprising to see that the performance of the neural network has a greater correlation with the perceptual performance of human listeners than with the other approaches. Even though we consider the auditory judgment by adult listeners to be the fairest judge to tone production, we do not intend to imply that the usefulness of the other measures should be scaled on the strength of their correlation with the perception test. These measures emphasize different aspects of tone production whereas perception involves the use of weighted total of these aspects. We should also use caution when interpreting the correlations because the results of the perception tests may be favored with other cues such as duration that was not examined in other measures.
These measures were quite successful and consistent with each other in scoring individual children with CIs. As for the averaged scores for different tone categories, again, the results of the neural network and the perception tests were the closest. It was shown that tones 1 and 4 were the relatively better produced tones. Confusion matrices of the two approaches also closely matched except for tone 3. Human ear could more correctly identify tone 3 than the neural network probably because tone 3 has a quite reliable duration cue that was available to human ears but was normalized in the neural network input. The contour correlation also indicated that tone 4 was the best produced tone albeit failed to evaluate tone 1. The production of tone 1, however, was better estimated with the false detection probabilities. It was shown that it was the least possible tone being falsely recognized.
Each measure has its strength and limitations. In general, the neural network demonstrated performance comparable to that of the human listeners with a high correlation of percent correct scores for individuals and very similar tone confusions. It is partly because the neural network works on a complex mathematical model with high tolerances of errors that emulate a biological perception system (Bishop, 1995; Arbib, 1995). It is thus ideal to use neural network to obtain perception like classification results. Nonetheless, the underlying process of the function approximation that the neural network relies on is hardly transparent. On the contrary, the acoustic analysis built on the examination of the level and pattern of the F0 contours provides more straightforward accounts for tone production performance. More importantly, the acoustic analysis offers more detailed and useful information of the acoustic properties of tone production than the perceptual judgments or neural networks do. The acoustic analysis is particularly useful for studying the children's development in tone production. The tonal ellipses visualize the tonal space and pitch use for individual tones by a particular speaker. The indices can also quantify these parameters and evaluate the degree of differentiation among tones. Tonal ellipse analysis has its merit in particular. It greatly simplifies the analysis using just the onset and offset points of an F0 contour. Nonetheless, this simplification, as pointed out, prevents this method from giving a comprehensive representation of the contour tones in particular. The contour correlation is a useful complementary analysis in addition to the tonal ellipses. It quantifies the similarity of one tone contour to a standard form. Thus, the contour tones of Mandarin Chinese can be more adequately evaluated using this method.
In conclusion, the proposed methods can be used to evaluate the tone production of children with CIs effectively. The proposed methods can also be used to evaluate tone production of hearing impaired people, or to study tone acquisition in developmental research. They all focus on, however, different aspects of the F0's. It will be interesting in future studies to address aspects other than F0 (e.g., duration) in the assessment of tone production.
Acknowledgments
The authors are grateful to Xiuwu Chen and Xiaoyang Zhao for their assistance in data collection in Beijing and to Erin Furman, Hui-Hui Li, Chessy Seebohm, Jessica Wolfanger, and Yunfang Zheng, for their technical support. They would like to thank the reviewers and the associate editor for their constructive comments in an earlier version of this paper. The study was supported in part by NIH NIDCD Grant No. R03-DC006161.
References
- Arbib MA. Handbook of Brain Theory and Neural Networks. 2nd. MIT Press; Cambridge, MA: 1995. [Google Scholar]
- Barry JG, Blamey PJ. The acoustic analysis of tone differentiation as a means for assessing tone production in speakers of Cantonese. J Acoust Soc Am. 2004;116:1739–1748. doi: 10.1121/1.1779272. [DOI] [PubMed] [Google Scholar]
- Bishop CM. Neural Networks for Pattern Recognition. Oxford University Press; Oxford, UK: 1995. [Google Scholar]
- Chang PC, Sun SW, Chen SH. Mandarin tone recognition by multi-layer perception; Proceedings of the 1990 IEEE Conference on Acoustic Speech Signal Processes; 3–6 April 1990; Albuquerque, NM. 1990. pp. 517–520. [Google Scholar]
- Chao YR. Language and Symbolic Systems. Oxford University Press; Oxford, UK: 1948. [Google Scholar]
- Ciocca V, Francis AL, Aisha R, Wong L. The perception of Cantonese lexical tones by early-deafened cochlear implantees. J Acoust Soc Am. 2002;111:2250–2256. doi: 10.1121/1.1471897. [DOI] [PubMed] [Google Scholar]
- Couch LW. Digital and Analog Communication Systems. Prentice Hall; Upper Saddle River NJ: 1996. [Google Scholar]
- Duanmu S. The Phonology of Standard Chinese. Oxford University Press; Oxford, UK: 2000. [Google Scholar]
- Green DM, Swets JA. Signal Detection Theory and Psychophysics. Wiley; New York: 1966. [Google Scholar]
- Hagan MT, Menhaj M. Training feedforward networks with the Marquardt algorithm. IEEE Trans Neural Netw. 1994;5:989–993. doi: 10.1109/72.329697. [DOI] [PubMed] [Google Scholar]
- Han D, Zhou N, Li Y, Chen X, Zhao X, Xu L. Tone production of Mandarin-Chinese-speaking children with cochlear implants. Int J Pediatr Otorhinolaryngol. 2007;71:875–880. doi: 10.1016/j.ijporl.2007.02.008. [DOI] [PMC free article] [PubMed] [Google Scholar]
- Lan N, Nie KB, Gao SK, Zeng FG. A novel speech-processing strategy incorporating tonal information for cochlear implants. IEEE Trans Biomed Eng. 2004;51:752–760. doi: 10.1109/TBME.2004.826597. [DOI] [PubMed] [Google Scholar]
- Lee KYS, van Hasselt CA, Chiu SN, Cheung DMC. Cantonese tone perception ability of cochlear implant children in comparison with normal-hearing children. Int J Pediatr Otorhinolaryngol. 2002;63:137–147. doi: 10.1016/s0165-5876(02)00005-8. [DOI] [PubMed] [Google Scholar]
- Lee T, Ching PC, Chan LW, Cheng YH, Mak B. Tone recognition of isolated Cantonese syllables. IEEE Trans Speech Audio Process. 1995;3:204–209. [Google Scholar]
- Li CN, Thompson SA. The acquisition of tone in Mandarin-speaking children. J Child Lang. 1977;4:185–199. [Google Scholar]
- Moore BCJ. Coding of sounds in the auditory system and its relevance to signal processing and coding in cochlear implants. Otol Neurotol. 2003;24:243–254. doi: 10.1097/00129492-200303000-00019. [DOI] [PubMed] [Google Scholar]
- Peng S, Tomblin JB, Cheung C, Lin YS, Wang L. Perception and production of Mandarin tones in prelingually deaf children with cochlear implants. Ear Hear. 2004;25:251–264. doi: 10.1097/01.aud.0000130797.73809.40. [DOI] [PubMed] [Google Scholar]
- Rose P. Considerations in the normalization of the fundamental frequency of linguistic tone. Speech Commun. 1987;6:343–352. [Google Scholar]
- Rose P. A linguistic phonetic acoustic analysis of Shanghai tones. Austr J Ling. 1993;13:185–219. [Google Scholar]
- Wang Y, Jongman A, Sereno J. Acoustic and perceptual evaluation of Mandarin tone productions before and after perceptual training. J Acoust Soc Am. 2003;113:1033–1043. doi: 10.1121/1.1531176. [DOI] [PubMed] [Google Scholar]
- Wang YR, Chen SH. Tone recognition of continuous Mandarin speech assisted with prosodic information. J Acoust Soc Am. 1994;96:2637–2645. doi: 10.1121/1.411274. [DOI] [PubMed] [Google Scholar]
- Wei WI, Wong R, Hui Y, Au DKK, Wong BYK, Ho WK, Tsang A, Kung P, Chung E. Chinese tonal language rehabilitation following cochlear implantation in children. Acta Oto-Laryngol. 2000;120:218–221. doi: 10.1080/000164800750000955. [DOI] [PubMed] [Google Scholar]
- Whalen DH, Xu Y. Information for Mandarin tones in the amplitude contour and in brief segments. Phonetica. 1992;49:25–47. doi: 10.1159/000261901. [DOI] [PubMed] [Google Scholar]
- Wong AOC, Wong LLN. Tone perception of Cantonese-speaking prelingually hearing-impaired children with cochlear implants. Otolaryngol-Head Neck Surg. 2004;130:751–758. doi: 10.1016/j.otohns.2003.09.037. [DOI] [PubMed] [Google Scholar]
- Wu JL, Lin CY, Yang HM, Lin YH. Effect of age at cochlear implantation on open-set word recognition in Mandarin speaking deaf children. Int J Pediatr Otorhinolaryngol. 2006;70:207–211. doi: 10.1016/j.ijporl.2005.06.013. [DOI] [PubMed] [Google Scholar]
- Wu JL, Yang HM. Speech perception of Mandarin Chinese speaking young children after cochlear implant use: Effect of age at implantation. Int J Pediatr Otorhinolaryngol. 2003;67:247–253. doi: 10.1016/s0165-5876(02)00378-6. [DOI] [PubMed] [Google Scholar]
- Xu L, Chen X, Zhou N, Li Y, Zhao X, Zhao X, Han D. Recognition of lexical tone production of children with an artificial neural network. Acta Oto-Laryngol. 2007;127:365–369. doi: 10.1080/00016480601011477. [DOI] [PMC free article] [PubMed] [Google Scholar]
- Xu L, Li Y, Hao J, Chen X, Xue SA, Han D. Tone production in Mandarin-speaking children with cochlear implants: A preliminary study. Acta Oto-Laryngol. 2004;124:363–367. doi: 10.1080/00016480410016351. [DOI] [PubMed] [Google Scholar]
- Xu L, Tsai Y, Pfingst BE. Features of stimulation affecting tonal-speech perception: Implications for cochlear prostheses. J Acoust Soc Am. 2002;112:247–258. doi: 10.1121/1.1487843. [DOI] [PMC free article] [PubMed] [Google Scholar]
- Xu L, Zhang W, Zhou N, Lee CY, Li Y, Chen X, Zhao X. Mandarin Chinese tone recognition with an artificial neural network. J Otol. 2006;1:30–34. [Google Scholar]
- Zhou N, Zhang W, Lee CY, Xu L. Lexical tone recognition by an artificial neural network. Ear Hear. 2008 doi: 10.1097/AUD.0b013e3181662c42. in press. [DOI] [PMC free article] [PubMed] [Google Scholar]