Abstract
A disproportionate number of fatal injuries occur after dark. The paper presents some statistics of road traffic injuries in a novel way which suggests that low luminance plays a major role in this effect. A sound physiological explanation for this is advanced based on the poor temporal characteristics of rod photoreceptors. It is argued that processing information based on low luminance, low contrast targets is much slower than that for high contrast bright targets. To test the idea, simple visual reaction times were measured under typical low visibility conditions encountered on non‐lit roads and were found to be substantially longer than under optimal conditions. It is shown that longer reaction times translate into significantly increased stopping distances. This important point has received insufficient attention in the road safety literature, by the Highways Agency, the police, injury prevention officials, and the UK Highway Code.
Keywords: night driving, reaction time, road casualties, road lighting, stopping distances
Every year more than 40 000 people die and over one million are injured in road crashes in the Member States of the European Union.1 Although road fatal injuries account for only a small minority of deaths, they constitute the leading cause of death in those aged under 40 years in developed countries.2 In the UK, the general statistics on road traffic injuries make unacceptable reading; 3600 fatalities (plus 230 000 injuries) in 2001—on average 60 deaths per million people. However, the UK is one of the safest countries in Europe to drive, having a fatality rate of six per 100 000 compared with the EU average of 11.3
Apart from the human cost in terms of tragedy, psychological damage, and suffering of crash victims and their families, the financial cost to the UK NHS is millions of pounds each year. It has been estimated that the value to society of preventing a fatal injury is £1.45 million (2002 prices—human, medical, police costs, and property damage), whereas the equivalent serious injury saving is around £168 000.4 The total annual economic loss is estimated to be about 2% of GDP in EU (OECD) countries.3,5
Road injury statistics and night driving
Driving is a complex task conducted in a constantly changing environment and consequently there are many factors contributing to a collision. Aside from engineering factors such as the construction and maintenance of vehicles and roads, a large percentage of road injuries are attributed to human perceptual error.6
Several studies have provided sound evidence that drivers' ability to avoid collisions is impeded under dim lighting.7,8,9,10,11 An important point is that the number of miles driven decreases substantially at night compared with daytime, yet more than half of all traffic deaths occur after dark. As a consequence, the number of fatalities per vehicle‐miles driven is significantly higher at night than during the day.7 Moreover, it has been shown that the number of night‐time crashes generally declines following the installation of overhead lighting,10 and when days are longer, as in the summer months.11,12 Other studies have highlighted the strong effect of lighting levels on fatal pedestrian crashes, with pedestrians being three to seven times more vulnerable in the dark than in the daylight.8,11
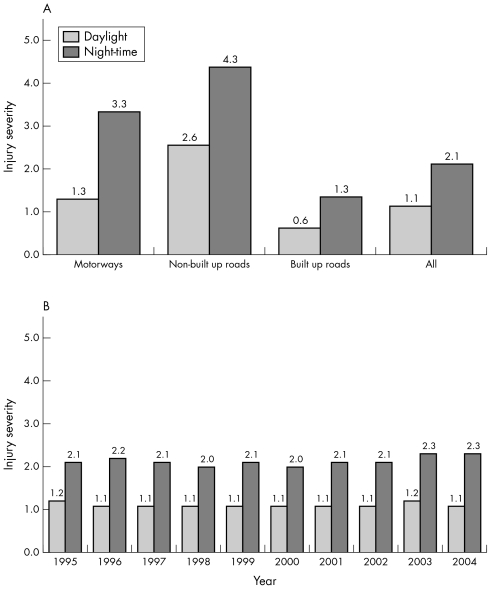
The best indicator of the importance of ambient light levels comes from the analysis of the “severity” of injuries. In this paper, severity is defined as the ratio of the number of fatal collisions per 100 collisions. It is a measure of the seriousness of collisions and implies that fatal (compared to non‐fatal) injuries are worse in terms of higher speeds and/or perceptual judgements. Figure 1A shows how severity rate varies with daytime and night‐time driving and with different road types in the UK. Presumably, because of the higher average speeds, severity rates are higher on “non‐built‐up” roads (speed limit up to 70 mph) and motorways than on “built up” roads (speed limit up to 40 mph). The most notable observation is that severity is doubled at night, when averaged across different road types, and this value is constant for the period analysed as seen in figure 1B. Note that changes in severity may be a result of the lower number of minor collisions at night. The data are compelling evidence that dim lighting contributes to the severity of road injuries. A more telling question is does this relation extend to urban conditions, where there are many more variables such as local lighting, light from shops and offices, and vehicle headlamps?
Figure 1 (A) Average severity rates (years 1995–2004) at daylight and night‐time by different road types. (B) Severity rates averaged across different road types. Note that the rate is fairly constant for all years for both daylight and night‐time. Severity is defined as the number of fatal collisions per 100 collisions (source: Road Accidents Great Britain, 1996–200513).
Addressing this question is not straightforward. The urban night‐time injury pattern might be expected to be further complicated by extraneous factors such as driving speed,14 alcohol use,15,16 sleep, obstructive apnea, fatigue,15,17 driving population, and traffic flows. Presumably congestion and speed are acting against each other for built up roads because, although there may be increased frequency of accidents due to traffic flow, average speed will be lower resulting in fewer severe accidents. Although all these factors must certainly contribute, their effects on the statistics can be reduced by calculating severity ratios for different road conditions, under the assumption that they are randomly distributed.
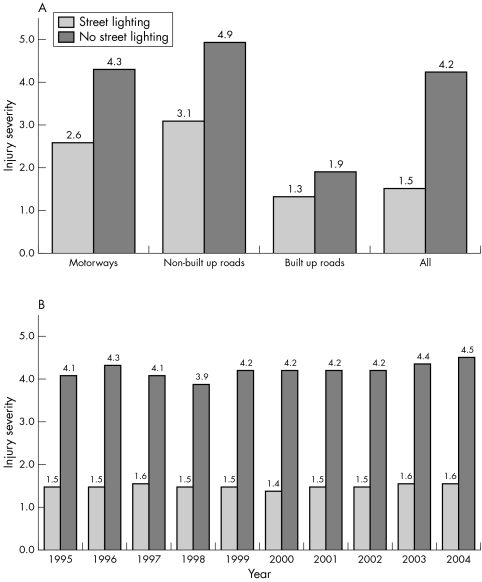
Figure 2A illustrates average injury severity rates at night‐time as a function of street lighting. The data show that overall, injury severity is almost three times higher on roads with no lighting. This difference is most obvious on unlit motorways probably due to higher speeds. Figure 2B reinforces this point, by showing a remarkable consistency in the difference in injury severity between well lit and unlit roads, for years 1995 to 2004.
Figure 2 UK mean (years 1995–2004) injury severity at night by street lighting and different road types (A), and as analysed across different road types for years 1995–2004 (B). Severity is defined as in figure 1.
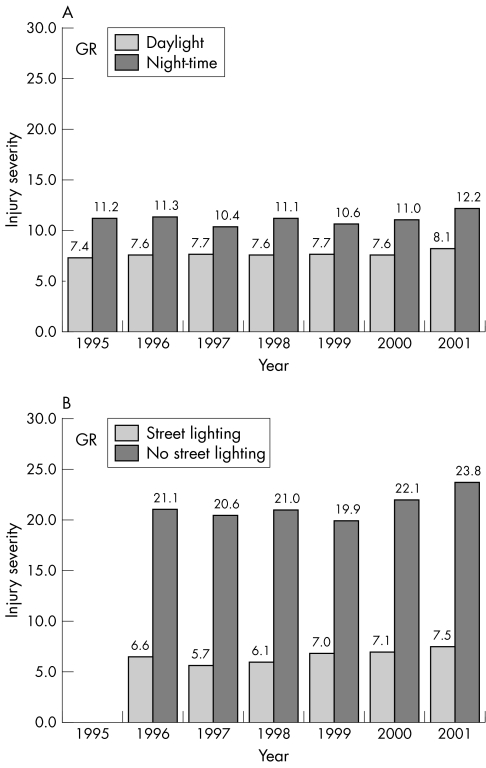
Having established the link between road traffic injuries and low luminance levels in the UK, it would be interesting to know whether the principle holds for other EU countries. Greece is an attractive candidate because of its poor road injury record.1 In figure 3 we have analysed the Greek data18 similarly to the UK data. First, in the top panel we show the difference in severity of injuries for daylight and darkness. Again, as for the UK data, there is good consistency over the years between daylight and darkness. The mean ratio between them for the seven years is 1.44, but note that the absolute number of severe accidents is dramatically different. There are five times more severe night‐time injuries in Greece than in the UK. Second, the lower panel reveals the major benefits of street lighting in Greece. In the presence of street lighting, injury severity is reduced by around a factor of 3, a similar number to that for the UK (2.8).
Figure 3 Greece injury severity rates (averaged across different road types for years 1995–2001) at daylight and night‐time (A) and at night by street lighting (B). Severity is defined as in figure 1 (source: General Secretariat of National Statistical Service of Greece, 1996–200218).
Visual performance under dim lighting conditions
Our visual world is relatively impoverished under dim conditions; spatial and temporal resolution are poor, sensitivity to contrast is diminished, and color vision is distorted or absent. Primarily this is because, as light levels are reduced, vision is mediated more and more by rod photoreceptors which are specialised for low lighting. The other photoreceptors—the cones—operate at high luminance levels and are responsible for more sophisticated forms of information processing. They mediate detailed vision, color vision, and provide motion perception. Some neurons in the visual cortex are specialised for making movement based judgements but these all rely on fast processing.19 Motion based perception, which relies on rods, is impaired due to their poor temporal characteristics. Hence, when driving at night, because of the involvement of rod pathways, there is a possibility of underestimating the speed of other vehicles,20 particularly at roundabouts and junctions where such judgements are crucial. It is obvious that artificial lighting minimises the disadvantages of rod mediated vision.
Monitoring visual processing time: critical stopping distance
Since driving is almost exclusively a visuo‐motor task, one possible approach for assessing drivers' ability to deal with hazardous conditions is to measure visual reaction times. It is well known from physiological experiments that as information is transmitted from eye to brain it is analysed along two separate parallel pathways each specialising in different and complementary aspects of the retinal image.19 It has been demonstrated that whether visual processing is fast or slow depends on the luminance and spatial characteristics of the object of interest and this has been confirmed in reaction time studies using low contrast, low luminance targets.21,22
Visual reaction times have been used as an estimate of the time to collision with an approaching object under specific conditions.23 They offer valuable information, when translated into critical stopping distances (CSDs),24 one key human factor in traffic safety, used in the UK Highway Code. The CSD is described as the sum of the “perception” distance (the product of vehicle velocity V and reaction time (RT), the time needed to perceive an object and react by depressing the brake), and the “braking” distance (BD) required to stop the vehicle (after the brakes have been applied):
CSD = V×RT + BD
Thus, the safe stopping distance can be estimated from the speed of the vehicle and the driver's reaction time. The calculation made in the UK Highway Code is based on optimal conditions but as established above, RT increases substantially for low contrast, low luminance targets.23 We must conclude that the Highway Code underestimates CSD for driving on unlit roads.
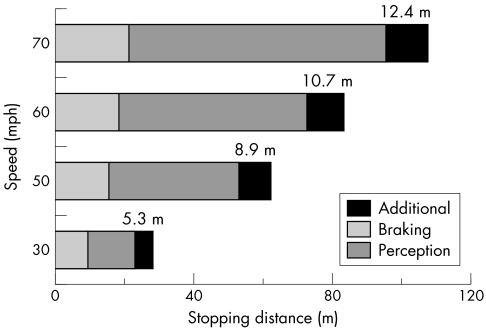
The discrepancy due to reduced lighting can be estimated from the data of Plainis and Murray23 and the results are illustrated in figure 4, which shows the different components of stopping distance for a range of vehicle speeds. The first component is the “braking distance”, the second is the “perception” distance, and the third is the “additional distance” covered because of the slower reaction time under poor lighting conditions. It is clear that a modest delay in visual processing (from 200 to 600 ms, consistent with experimental data; see Plainis and Murray, 200223) results in significant increases in stopping distances (for example, 10.7 m at 60 mph), which is similar to driving 5.5 mph faster. It is expected that driver fatigue, adverse weather conditions such as wet roads, and poor visibility would further increase these values.
Figure 4 Critical stopping distances (CSDs) for different vehicle speeds. For each speed the CSD has three components. The first is braking distance, the second is the perception distance travelled during an average reaction time, and the third is the additional distance travelled during a reaction time prolonged by dim lighting conditions. Note that 4 m is the length of an average car.
Conclusions
It has been known for some time that a disproportionate number of road traffic injuries occur after dark. By comparing road injury data under dim and bright conditions for two EU countries we show that low luminance is likely to contribute to this effect. The extent of the role of low lighting is difficult to estimate quantitatively. The presence of road lighting leads to an approximate factor of 3 decrease in the severity of injuries in both countries, despite the fact that they have dramatically different injury rates. Injuries to pedestrians are not discussed here, but it is important to note that pedestrians are particularly vulnerable when they present a low contrast target, such as when wearing dark clothing.
A credible physiological explanation for the importance of good lighting for road safety is provided; low luminance, low contrast images are processed slowly by the visual apparatus, due mainly to the limited temporal characteristics of the rod photoreceptors. Visual RTs are described as a measure of performance, which both reflect the underlying physiology and can be used to estimate the stopping distances required when visibility is good compared with when it is poor. It is important to recognise that even the most conservative driver cannot be aware of the significant effects low luminance and low contrast scenes can have on his ability to respond to an emergency.
Key points
A disproportionate number of fatal road injuries occur after dark.
Statistics show that reduced lighting, as well as other factors such as fatigue, alcohol, or traffic density, contribute to the impaired ability of drivers to avoid collisions at night. For example, injury severity (the ratio of fatal collisions per 100 collisions) increases in roads with no street lighting.
Introducing road lighting leads to an approximate three times decrease in the severity of injuries in both UK and Greece, despite the fact that these countries have dramatically different injury rates.
Visual reaction times are substantially longer under adverse, low visibility conditions than under optimal conditions, leading to increased stopping distances when driving.
Footnotes
Funding: this work is part of a collaborative research project between The University of Manchester, UK and The University of Crete, Greece, funded by the Greek Secretariat for Research and Technology (GSRT) and the British Council.
Competing interests: none.
References
- 1.CARE Community Road Accident Database. Available at http://europa.eu.int/comm/transport/care/index_en.htm (accessed January 2006)
- 2.European Commission Road Safety: Directorate General for Energy and Transport 2002
- 3.OECD RRG Road and Traffic accident database: Organisation for Economic Co‐operation and Development. Paris: Road Research Group, 2001
- 4.Highway Economics Notes on valuation of accidents. Department for Transport, UK 2002
- 5.Peden M, Sminkey L. World Health Organization dedicates World Health Day to road safety. Inj Prev 20041067. [DOI] [PMC free article] [PubMed] [Google Scholar]
- 6.Hills B L. Vision, visibility, and perception in driving. Perception 19809183–216. [DOI] [PubMed] [Google Scholar]
- 7.Owens D A, Sivak M. Differentiation of visibility and alcohol as contributors to twilight road fatalities. Hum Factors 199638680–689. [DOI] [PubMed] [Google Scholar]
- 8.Owens D, Sivak M. The role of visibility in nighttime traffic accidents. 2nd International Symposium on Visibility and Luminance in Roadway Lighting. Orlando,1993133–147.
- 9.Rice T M, Peek‐Asa C, Kraus J F. Nighttime driving, passenger transport, and injury crash rates of young drivers. Inj Prev 20039245–250. [DOI] [PMC free article] [PubMed] [Google Scholar]
- 10.Elvik R. A meta‐analysis of evaluation of public lighting as an accident countermeasure. Transportation Research Record 19951485112–113. [Google Scholar]
- 11.Sullivan J M, Flannagan M J. The role of ambient light level in fatal crashes: inferences from daylight saving time transitions. Accid Anal Prev 200234487–498. [DOI] [PubMed] [Google Scholar]
- 12.Ferguson S A, Preusser D F, Lund A K.et al Daylight saving time and motor vehicle crashes: the reduction in pedestrian and vehicle occupant fatalities. Am J Public Health 19958592–95. [DOI] [PMC free article] [PubMed] [Google Scholar]
- 13.Road Accidents Great Britain Road Accident Data: The Department for Transport. United Kingdom: Local Government and the Regions, 1996–2004
- 14.Taylor M, Lynam D, Baruya A. The effects of drivers' speed on the frequency of road accidents. Berkshire, UK: Transport Research Laboratory, 1999
- 15.Summala H, Mikkola T. Fatal accident among car and truck drivers: effects of fatigue, age, and alcohol consumption. Human Factors 199436315–326. [DOI] [PubMed] [Google Scholar]
- 16.Foster G R, Dunbar J A, Whittet D.et al Contribution of alcohol to deaths in road traffic accidents in Tayside 1982–6. BMJ (Clin Res Ed) 19882961430–1432. [DOI] [PMC free article] [PubMed] [Google Scholar]
- 17.Teran‐Santos J, Jimenez‐Gomez A, Cordero‐Guevara J. The association between sleep apnea and the risk of traffic accidents. Cooperative Group Burgos‐Santander. N Engl J Med 1999340847–851. [DOI] [PubMed] [Google Scholar]
- 18.General Secretariat of National Statistical Service of Greece Statistical data—Road traffic accidents 1996–2001
- 19.Shapley R, Hawken M. Parallel retino‐cortical channels and luminance. In: Gegenfurtner K, Sharpe L, eds. Color vision: from pigments to perception. Cambridge: Cambridge University Press, 1999221–234.
- 20.Gegenfurtner K R, Mayser H, Sharpe L T. Seeing movement in the dark. Nature 1999398475–476. [DOI] [PubMed] [Google Scholar]
- 21.Brenner E, Smeets J B. Perceptual requirements for fast manual responses. Exp Brain Res 2003153246–252. [DOI] [PubMed] [Google Scholar]
- 22.Murray I J, Plainis S. Contrast coding and magno/parvo segregation revealed in reaction time studies. Vision Res 2003432707–2719. [DOI] [PubMed] [Google Scholar]
- 23.Plainis S, Murray I J. Reaction times as an index of visual conspicuity when driving at night. Ophthalmic Physiol Opt 200222409–415. [DOI] [PubMed] [Google Scholar]
- 24.Leibowitz H W, Owens D A, Tyrrell R A. The assured clear distance ahead rule: implications for nighttime traffic safety and the law. Accid Anal Prev 19983093–99. [DOI] [PubMed] [Google Scholar]


