Abstract
We report here a microfabricated nanofilter array chip that can size-fractionate SDS-protein complexes and small DNA molecules based on the Ogston sieving mechanism. Nanofilter arrays with a gap size of 40-180nm were fabricated and characterized. Complete separation of SDS-protein complexes and small DNA molecules were achieved in several minutes with a separation length of 5mm. The fabrication strategy for the nanofilter array chip allows further increasing of the nanofilter density and decreasing of the nanofilter gap size, leading, in principle, to even faster separation.
Gel electrophoresis is a widely-used method for separating proteins and nucleic acids in laboratories. However, theoretical studies of the sieving mechanism in gel electrophoresis have been limited because little information on the structure and pore size of gels exist. In addition, most microchip-based separation systems rely on liquid or solid polymeric sieving media contained in microchannels. While providing fast separation, such foreign sieving matrices pose intrinsic difficulties for the integration of multiple analytic steps into an automatic bioanalysis microsystem. As an alternative to random nanoporous gels, micro/nanofluidic molecular sieving structures fabricated with semiconductor fabrication technology have been used to separate biomolecules with much greater speed than their conventional counterparts1-5. Such micro/nanofluidic devices have also been adopted as model systems to study molecular dynamics and stochastic motion in constrained spaces because of their regular sieving structures6-9. To date, microfabricated sieving systems have only been used for large biomolecules such as viral DNA, mainly because it is generally challenging to fabricate sieves with comparable molecular dimensions. In this Letter, we demonstrate the separation of small biomolecules such as proteins and small double-stranded DNA molecules (dsDNA) in a regular nanofilter array chip, based on the Ogston sieving mechanism10-12.
It is important to recognize that Ogston sieving is the sieving process in which the size of the molecule is smaller than the size of the nanopore. In this regime, the configurational freedom of the molecules inside the nanopore is limited due to steric repulsion from the wall, and this creates a size-dependent configurational entropic energy barrier for the molecule passage from open space to the confined space of the nanopore13. This entropic energy barrier is presumably also responsible for the sieving process of small and relative globular molecules in gel14. In this Letter, we will examine the interesting possibility of separating biomolecules with nanofilters larger than the molecular dimensions.
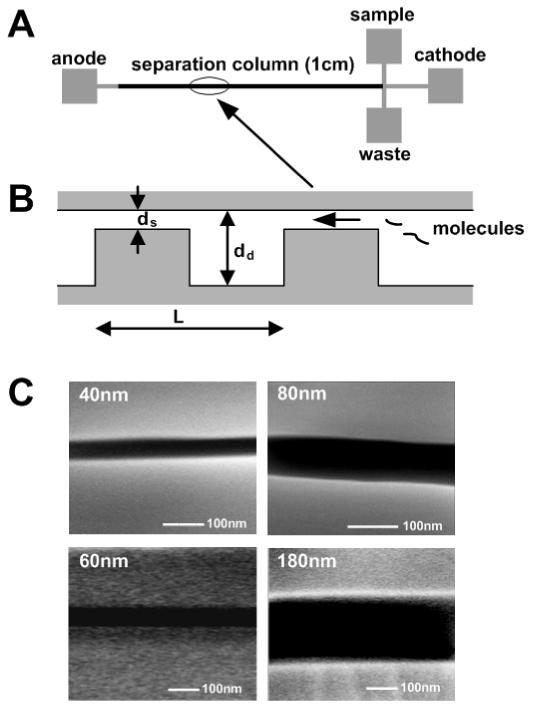
The nanofilter array chip was fabricated by conventional photolithography and reactive ion etching (RIE) techniques on a silicon wafer, as described previously15. The layout of the chip is presented in Fig. 1. Nanofilters with a thin region thickness (ds) of 40-180nm have been fabricated with this technique. At the very beginning of the nanofilter array, a T-shaped injector for electrokinetic sample injection was fabricated to define and launch an initial sample mixture plug. The nanofilter array was filled with Tris-Borate-EDTA (TBE) 5× buffer for DNA experiments. For protein experiments, an additional 0.1wt% sodium dodecyl sulfate (SDS, Sigma) was added. For fluorescence detection, dsDNA molecules were labeled with YOYO-1 dye (Molecular Probes) and protein samples were conjugated with fluorescein or Alexa Fluor 488 (Molecular Probes). The protein samples were added to SDS and dithiothreitol (DTT, Sigma) for denaturation and then the mixture was incubated in a 65°C water bath. An inverted epi-fluorescence microscope equipped with a CCD camera was used for fluorescence imaging. Sequences of CCD images were analyzed by image-processing software to produce electropherograms.
FIG. 1.

(a) Layout of the nanofilter array chip. The device includes four buffer access holes (anode, cathode, sample and waste), a 1cm separation column (a periodic array of nanofilters) and a T-Shaped injector. (b) Cross-sectional schematic diagram of the nanofilter array along the separation channel. The nanofilter consists of a thin region (ds) and a thick region (dd) of equal lengths. The period of one nanofilter is L. (c) SEM images of the cross-section of thin regions with different depths (40nm, 60nm, 80nm and 180nm).
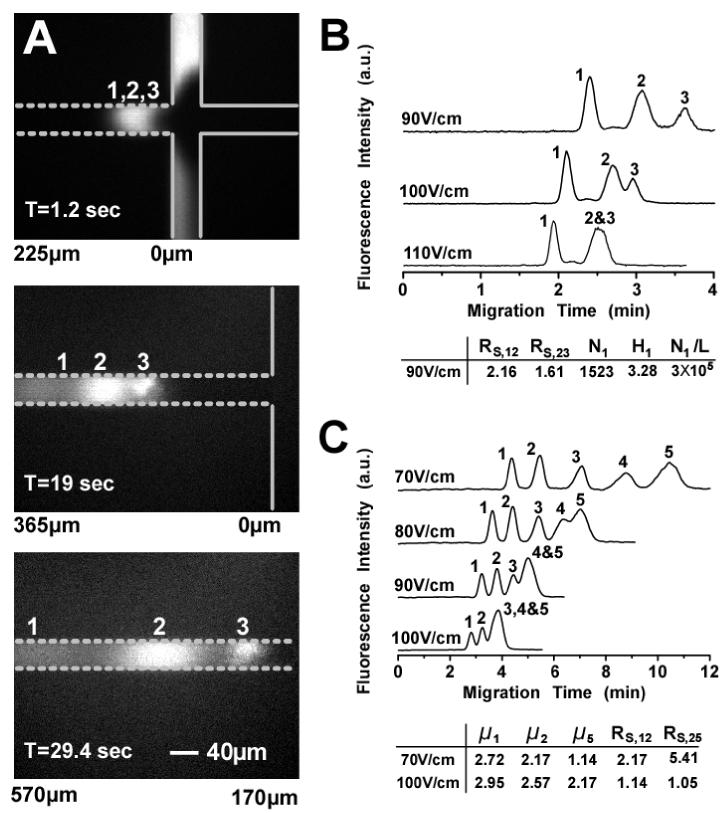
Figure 2 summarizes the separation results of SDS-protein complexes and dsDNA molecules in a nanofilter array chip (ds=60nm, dd=300nm, L=1μm). Figure 2(a) shows a sequence of fluorescence images taken near the T-shaped injector region, shortly after the launching of the SDS-protein mixture. The three SDS-protein fragments were quickly separated within 30sec and a 570μm separation length. Smaller protein complexes migrated faster than larger ones, which is different from the entropic trapping-based separation of long DNA molecules in similar nanofluidic devices15. The base-line separation of the SDS-protein complexes was achieved in 4min with a separation length of 5mm under an electric field of 90V/cm (Fig. 2(b)). The theoretical plate number for cholera toxin subunit B was about 1523 and the plate number per column length was about 3×10⁵ plates/m13. Separation results of small dsDNA molecules are shown in Fig. 2(c). A complete separation of the dsDNA molecules was achieved in about 10min with a separation length of 5mm under an electric field of 70V/cm.
FIG. 2.

Separation of SDS-protein complexes and dsDNA molecules in a nanofilter array device (ds: 60nm, dd: 300nm, L: 1μm). Band assignment for SDS-protein complexes: (1) cholera toxin subunit B (MW: 11.4kDa); (2) lectin phytohemagglutinin-L (MW: 120kDa); (3) low density human lipoprotein (MW: 179kDa). Band assignment for DNA (PCR marker sample): (1) 50bp; (2) 150bp; (3) 300bp; (4) 500bp; (5) 766bp. (a) Sequence of fluorescence images showing separation of the SDS-protein complexes under the electric field of 100V/cm. The solid lines indicate the T-shaped injector and the dashed lines indicate the nanofilter array. The values listed under the images indicate the distance from the injection point. (b & c) Separation of SDS-protein complexes and dsDNA molecules under different applied fields. Separation length: 5mm. RS, ij: separation resolution between peak i and j; Ni, Hi: theoretical plate number and plate height (in μ;m) for peak i; Ni/L: theoretical plate number per column length (in plates/m). μ;i: electrophoretic mobility of peak i (10-5cm2/(V·sec)).
One unique feature of the nanofilter array chip was that its molecular sieving power showed dependence on the field strength. When the field was increased, the size dependence of electrophoretic mobility (or size selectivity, which should be inversely proportional to the nanofilter thin region depth ds) disappeared. This dependence of mobility on field strength was more apparent for larger molecules. For instance, when the field was increased from 70V/cm to 100V/cm, the 50bp and 150bp DNA fragments achieved 8.4% and 18.2% mobility increases, respectively, while the 766bp DNA fragment achieved a 90.2% mobility increase. This suggests that there is a competition between the electrical potential energy (∼Eqds, E: field strength, q: effective charge of dsDNA molecule) and the Ogston sieving induced entropic energy barrier (∼kT)14. The Ogston sieving effect becomes less dominant as the electric field is increased, and this is especially true for larger molecules. Therefore, the separation resolution worsened as the field was increased. Since the SDS-protein complexes and the dsDNA molecules separated are smaller than the 60nm nanofilter gap size16-18, Figure 2 clearly demonstrates the effectiveness of Ogston sieving in the nanofilter array and further is a direct experimental confirmation of Ogston sieving in a well-defined, regular nanopore system.
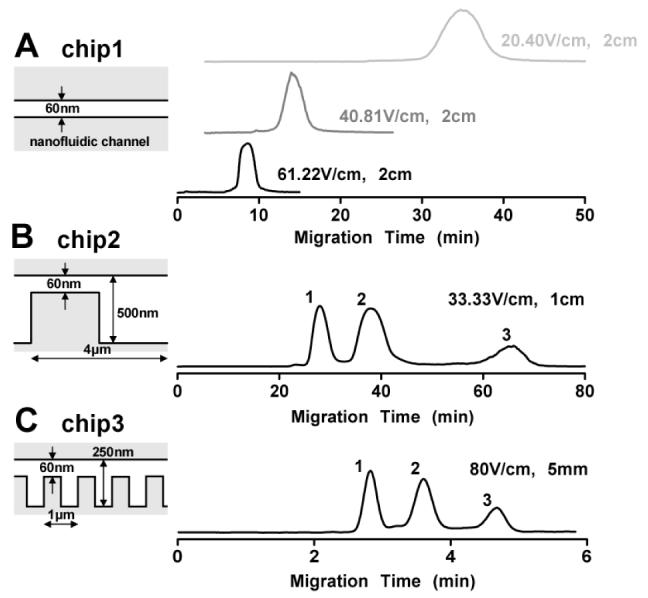
In Fig. 3, we compared three different nanofluidic chips with different structures but the same nanochannel depth (ds=60nm). In the flat nanofluidic channel chip (Chip1), no separation over a 2cm separation length was observed for the SDS-protein mixture under a broad range of fields applied (Fig. 3(a)). Experiments with dsDNA molecules were also conducted with Chip1, and no separation could be achieved either. This confirmed that separation in the nanofilter array chip was indeed due to the nanofilters, not due to chromatographic interaction between the nanofilter walls and the molecules. The Debye layer thickness under the ionic strength (∼0.5M) was expected to be less than 1nm. Therefore, the possibility of hydrodynamic chromatography caused by parabolic velocity profile in the large Debye length limit can be excluded19. The possibility of the dielectrophoretic trapping, induced by the field gradient at the boundaries between the nanofilter thick and thin regions, may cause separation of molecules with different sizes20, even at DC conditions21. However, if that were the case, the increased fields should have resulted in stronger trapping and therefore more resolved separation.
FIG. 3.

Comparison of separation performance in three different nanofluidic chips. Chip1 has only a 60nm thin, flat channel without any nanofilter. Chip2: ds=60nm, dd=560nm, L=4μm; Chip3: ds=60nm, dd=300nm, L=1μm. Band assignment is the same as in Fig. 2 for SDS-protein complexes. The separation lengths and the applied fields are indicated in the figures.
Chip2 and Chip3 had different periods (L) and different thick region depths (dd).It was possible to achieve separation with high fields (up to ∼100V/cm) in Chip3 but not in Chip2 due to the difference in their nanofilter periods (separation resolution would be lost with a field higher than ∼60V/cm in Chip2). A more than 10-fold increase of the separation speed was obtained in Chip3 than in Chip2 for comparable separation resolution. This can be attributed to three different separation relevant parameters of these two chips: the separation length, the electric field and the aspect ratio of the nanofilter (γ=dd/ds). It was demonstrated that the maximum (sieving-free) mobility μ;maxin the nanofilter array can be estimated by μmax/μ0=4γ/(1+γ)2(μ0: free solution mobility of molecules)22. So the decrease of γ with shallower depth of ddin (Chip3) increased the separation speed (μmax/μ0(Chip3)=0.55>μmax/μ0(Chip2)=0.34). Overall, the shorter separation length, the greater field and the reduced aspect ratio leaded to the more than 10-fold increase of the separation speed in Chip3. Similar improvement is expected when the nanofilter period is further decreased, possibly either by e-beam lithography23 or by nanoimprint lithography24. A nanofilter with a period of 100∼200nm is still much larger than the size of proteins and other small biomolecules, so similar sieving behavior is expected in such chips.
In conclusion, we have size-separated SDS-protein complexes and small dsDNA molecules in nanofilter array chips based on the Ogston sieving mechanism. This is a direct experimental observation of Ogston sieving by regular nanofluidic pores with precise pore size characterization. The speed and resolution obtained by the nanofilter array chip is comparable to current state of the art systems (i.e. capillary gel electrophoresis25) without using any sieving gel. This opens up possibilities for integrating many different biomolecule sensors, and separation and reaction chambers in a single chip, without the concern of sieving matrix crosstalk and contamination. The separation efficiency could be further improved by scaling down the nanofilter period by advanced sub-100nm resolution photolithography techniques. In addition to fast biomolecule separation, nanofilter array chips can be used to study many important phenomena of molecular stochastic motion, which has broad implications in biology.
Acknowledgments
The authors acknowledge support from NSF-CTS division (CTS-0347348, CTS-0304106), the FRP-1 of Computational Engineering (CE) program of Singapore-MIT Alliance (SMA-II) and NIH NIBIB program (R01-EB005743).
References
- 1.Volkmuth WD, Austin RH. Nature. 1992;358:600. doi: 10.1038/358600a0. [DOI] [PubMed] [Google Scholar]
- 2.Han J, Craighead HG. Science. 2000;288:1026. doi: 10.1126/science.288.5468.1026. [DOI] [PubMed] [Google Scholar]
- 3.Huang LR, Tegenfeldt JO, Kraeft JJ, Sturm JC, Austin RH, Cox EC. Nat. Biotechnol. 2002;20:1048. doi: 10.1038/nbt733. [DOI] [PubMed] [Google Scholar]
- 4.Kaji N, Tezuka Y, Takamura Y, Ueda M, Nishimoto T, Nakanishi H, Horiike Y, Baba Y. Anal. Chem. 2004;76:15. doi: 10.1021/ac030303m. [DOI] [PubMed] [Google Scholar]
- 5.Huang LR, Cox EC, Austin RH, Sturm JC. Science. 2004;304:987. doi: 10.1126/science.1094567. [DOI] [PubMed] [Google Scholar]
- 6.Bakajin OB, Duke TAJ, Chou CF, Chan SS, Austin RH, Cox EC. Phys. Rev. Lett. 1998;80:2737. [Google Scholar]
- 7.Tessier F, Labrie J, Slater GW. Macromolecules. 2002;35:4791. [Google Scholar]
- 8.Tegenfeldt JO, Prinz C, Cao H, Chou S, Reisner WW, Riehn R, Wang YM, Cox EC, Sturm JC, Silberzan P, Austin RH. Proc. Natl. Acad. Sci. U. S. A. 2004;101:10979. doi: 10.1073/pnas.0403849101. [DOI] [PMC free article] [PubMed] [Google Scholar]
- 9.Streek M, Schmid F, Duong TT, Anselmetti D, Ros A. Phys. Rev. E. 2005;71:11905. doi: 10.1103/PhysRevE.71.011905. [DOI] [PubMed] [Google Scholar]
- 10.Ogston AG. Trans. Faraday Soc. 1958;54:1754. [Google Scholar]
- 11.Giddings JC, Kucera E, Russell CP, Myers MN. J. Phys. Chem. 1968;72:4397. [Google Scholar]
- 12.Deen WM. AIChE J. 1987;33:1409. [Google Scholar]
- 13.Giddings JC. Unified Separation Science. John Wiley & Sons, Inc; New York: 1991. [Google Scholar]
- 14.Viovy JL. Rev. Mod. Phys. 2000;72:813. [Google Scholar]
- 15.Han J, Craighead HG. J. Vac. Sci. Technol., A. 1999;17:2142. [Google Scholar]
- 16.Hagerman PJ. Annu. Rev. Biophys. Chem. 1998;17:265. doi: 10.1146/annurev.bb.17.060188.001405. [DOI] [PubMed] [Google Scholar]
- 17.Baumann CG, Smith SB, Bloomfield VA, Bustamante C. Proc. Natl. Acad. Sci. USA. 1997;94:6185. doi: 10.1073/pnas.94.12.6185. [DOI] [PMC free article] [PubMed] [Google Scholar]
- 18.Korn JE, Millett IS, Jacob J, Zagrovic B, Dillon TM, Cingel N, Dothager RS, Seifert S, Thiyagarajan P, Sosnick TR, Hasan MZ, Pande VS, Ruczinski I, Doniach S, Plaxco KW. Proc. Natl. Acad. Sci. U. S. A. 2004;101:12491. doi: 10.1073/pnas.0403643101. [DOI] [PMC free article] [PubMed] [Google Scholar]
- 19.Blom MT, Chmela E, Oosterbroek RE, Tijssen R, van den Berg A. Anal. Chem. 2003;75:6761. doi: 10.1021/ac034663l. [DOI] [PubMed] [Google Scholar]
- 20.Chou CF, Tegenfeldt JO, Bakajin O, Chan SS, Cox EC, Darnton N, Duke T, Austin RH. Biophys. J. 2002;83:2170. doi: 10.1016/S0006-3495(02)73977-5. [DOI] [PMC free article] [PubMed] [Google Scholar]
- 21.Cummings EB, Singh AK. Anal. Chem. 2003;75:4724. doi: 10.1021/ac0340612. [DOI] [PubMed] [Google Scholar]
- 22.Streek M, Schmid F, Duong TT, Ros A. J. Biotechnol. 2004;112:79. doi: 10.1016/j.jbiotec.2004.04.021. [DOI] [PubMed] [Google Scholar]
- 23.Turner SW, Perez AM, Lopez A, Craighead HG. J. Vac. Sci. Technol. B. 1998;16:3835. [Google Scholar]
- 24.Cao H, Yu Z, Wang J, Tegenfeldt JO, Austin RH, Chen E, Wu W, Chou SY. Appl. Phys. Lett. 2002;81:174. [Google Scholar]
- 25.Yao S, Anex DS, Caldwell WB, Arnold DW, Smith KB, Schultz PG. Proc. Natl. Acad. Sci. U. S. A. 1999;96:5372. doi: 10.1073/pnas.96.10.5372. [DOI] [PMC free article] [PubMed] [Google Scholar]


