Abstract
In mammals, the transcription factor Nurr1 is expressed early in development and continues to be detectable throughout the organisms’ lifetime. Nurr1 is involved in the establishment and maintenance of the dopaminergic phenotype within specific central nervous system neuronal subpopulations including the nigrostriatal dopamine system. This protein is reduced over the course of normal aging, which is a major risk factor for Parkinson’s disease (PD). However, whether Nurr1 expression is affected by PD has not been documented. The present study examined the role of Nurr1 in the maintenance of the dopaminergic phenotype within neurons in substantia nigra in PD compared to patients with diagnoses of Progressive Supranuclear Palsy (PSP), Alzheimer’s disease (AD), or age-matched-matched controls. In PD, the optical density (OD) of Nurr1 immunofluorescence was significantly decreased in nigral neurons containing α-synuclein-immunoreactive inclusions. Similarly, the OD of Nurr1 immunofluorescence intensity in the nigra of AD cases was decreased in neurons with neurofibrillary tangles (NFTs). In contrast to PD and AD, the OD of Nurr1 immunofluorescence intensity was severely decreased in the neurons with or without NFTs in PSP cases. Decline of Nurr1-ir neuronal number and optical density (OD) was observed within substantia nigra (SN) neurons in PD, but not within hippocampal neurons. The decline in Nurr1-ir expression was correlated with loss of TH immunofluorescence across the four groups. These data demonstrate that Nurr1 deficiency in dopaminergic neurons is associated with the intracellular pathology in both synucleinopathies and tauopathies.
Keywords: transcription factor, dopaminergic neuron, α-synuclein, neurofilament, substantia nigra
Nurr1, an orphan member of the nuclear receptor superfamily, is highly expressed in the developing and adult ventral midbrain and is required for the acquisition and maintenance of the dopaminergic phenotype in nigrostriatal neurons (Zetterstrom et al., 1997; Saucedo-Cardenas et al., 1998; Sacchetti et al., 2001; Hermanson et al., 2003; Chu et al., 2002). In the absence of Nurr1, developing ventral midbrain neurons fail to express the dopaminergic (DA) neuronal markers, tyrosine hydroxylase (TH) and dopamine transporter (DAT), as well as the receptor tyrosine kinase signaling subunit Ret (Zetterstrom et al., 1997; Saucedo-Cardenas et al., 1998; Wallen et al., 2001; Sacchetti et al., 2001; Kim et al., 2003; Kim et al., 2002). Moreover, Nurr1 deficient embryonic ventral midbrain neurons are unable to innervate their striatal target area (Saucedo-Cardenas et al., 1998; Zetterstrom et al., 1997). Newborn heterozygous (Nurr1-/+) mice show significantly reduced levels of Nurr1 and dopamine protein (Eells et al., 2002). Adult heterozygous mice (Nurr1-/+), while otherwise apparently normal, are significantly more sensitive to the toxic effects of 1-methyl-4 phenyl-1, 2, 3, 6 tetrahydropyridine (MPTP) than their wild-type littermates (Le et al., 1999), indicating that Nurr1 influences the ability of DA neurons to resist MPTP toxicity. Conversely, a dopaminergic phenotype can be generated in embryonic stem cells following ex vivo transfection with the Nurr1 gene (Kim et al., 2002).
Recent studies indicate that Nurr1 expression is decreased during the course of normal human aging (Chu et al., 2002). Aging is the single most powerful risk factor for developing Parkinson’s disease (PD). Loss of striatal dopamine and degeneration of DA neurons in the substantia nigra (SN) are the neurochemical signatures of this disease and occur early in the disease process (Ross et al., 2004; Kastner et al., 1993). We hypothesize that decreased Nurr1 expression within individual nigral neuron is a critical molecular event underlying decreased production of dopamine and DA neuronal degeneration. While decreases in nigral neuronal number and dopamine have been established long ago in PD (Braak et al; 2003), it is essential to determine whether transcription factors such as Nurr1 contribute to these changes. In this regard, the purpose of this study was to determine (1) whether the Nurr1 immunoreactivity is altered in the remaining SN neuromelanin (NM)-containing neurons in PD; and (2) whether a decrease in Nurr1 is associated with α-synuclein inclusions. To accomplish these aims, the relative level of Nurr1 protein was analyzed using quantitative immunofluorescence intensity measurements within the SN of PD cases. These data were compared to findings seen in age-matched controls as well as the related disorders Progressive Supranuclear Palsy (PSP) and Alzheimer’s disease (AD). Since PD is a synucleopathy and PSP and AD are tauopathies, we also intended to compare Nurr1 changes in both categories of neuro-degenerative diseases. In our cohort we found that Nurr1 was altered in neurons undergoing disease-related pathology, as defined by the presence of α-synuclein inclusions or neurofibrillary tangles (NFT) in contrast to cells without inclusions.
MATERIALS AND METHODS
Subject
Tissue from 41 subjects with a clinical and neuropathological diagnosis of PD (n=15), PSP (n=8), AD (n=8), and age-matched controls (n=10) were analyzed. There were no differences in age at the time of death (P > 0.05) or postmortem interval (P > 0.20) between the four groups examined (see Table 1).
Table 1.
Summary of case demographics
| Age-matched control Cases |
Age (yr) |
Gender | PMI (hr) |
Braak score |
MMSE |
|---|---|---|---|---|---|
| 1 | 74 | M | 10.3 | n/a | 27 |
| 2 | 73 | M | 7.3 | I/II | 28 |
| 3 | 84 | M | 4.0 | I/II | 28 |
| 4 | 83 | M | 5.5 | V/IV | 26 |
| 5 | 72 | F | 7.0 | III/IV | 30 |
| 6 | 91 | F | 10.7 | III/IV | 27 |
| 7 | 86 | F | 5.0 | n/a | 30 |
| 8 | 88 | F | 7.0 | III/IV | 28 |
| 9 | 70 | M | 6.0 | II/III | 30 |
| 10 | 68 | M | 6.5 | III/IV | 28 |
| Mean±SE | 78.90±8.34 | 6.93±2.14 | 28.20±1.39 |
| Parkinson’s Disease |
Age (yr) |
Gender | PMI (hr) |
Disease Duration (yr) |
UPDRS III |
H&Y stage |
|---|---|---|---|---|---|---|
| 1 | 79 | M | 6.0 | 6 | 27 | 3 |
| 2 | 73 | M | 13.0 | 7 | n/a | n/a |
| 3 | 79 | M | 4.0 | 6 | 49 | 3 |
| 4 | 73 | F | 5.0 | 5 | 23 | 2 |
| 5 | 64 | F | 5.0 | 13 | 64 | 5 |
| 6 | 80 | F | 5.5 | 5 | 54 | 4 |
| 7 | 67 | M | 6.0 | 13 | 54 | 5 |
| 8 | 70 | F | 9.0 | 4 | 47 | 4 |
| 9 | 77 | M | 4.0 | 17 | 42 | 3 |
| 10 | 75 | F | 8.0 | 15 | 65 | 5 |
| 11 | 59 | F | 5.0 | 13 | n/a | n/a |
| 12 | 72 | M | 5.0 | 8 | 21 | 2 |
| 13 | 71 | M | 4.5 | 14 | 54 | 5 |
| 14 | 61 | M | 4.5 | 21 | n/a | n/a |
| 15 | 95 | F | 11.5 | 6 | 62 | 5 |
| Mean±SE | 72.40±10.08 | 6.40±2.76 | 10.20±1.35 | 46.83±15.57 | 3.83±1.18 |
| progressive supranuclear palsy |
Age (yr) |
Gender | PMI (hr) |
|---|---|---|---|
| 1 | 77 | M | 7.0 |
| 2 | 83 | M | 4.0 |
| 3 | 74 | M | 13.7 |
| 4 | 69 | F | 10.5 |
| 5 | 72 | F | 14.5 |
| 6 | 85 | F | 4.5 |
| 7 | 67 | F | 4.5 |
| 8 | 66 | F | 13.0 |
| Mean±SE | 74.12±7.10 | 8.96±4.48 |
| Alzheimer’s disease |
Age (yr) |
Gender | PMI ( hr) |
Braak score |
MMSE |
|---|---|---|---|---|---|
| 1 | 84 | M | 3.0 | I/II | 15 |
| 2 | 80 | M | 3.5 | III/IV | 3 |
| 3 | 79 | M | 5.4 | n/a | 9 |
| 4 | 86 | M | 15.7 | III/IV | 7 |
| 5 | 80 | M | 4.5 | III/IV | 17 |
| 6 | 92 | F | 3.1 | III/IV | 4 |
| 7 | 89 | F | 9.0 | III/IV | 6 |
| 8 | 88 | F | 2.6 | I/II | 14 |
| Mean±SE | 82.25±7.38 | 5.85±2.76 | 9.37±5.31 |
PMI, postmortem interval; n/a, not available; MMSE, mini-mental status examination; UPDRS, Unuted Parkinson’s Disease Rating Scale; H&Y, Hoehn and Yahr.
All patients with PD and PSP were diagnosed by neurologists in the Section of Movement Disorders in the Department of Neurological Sciences at Rush University Medical Center. Post-mortem, the clinical diagnosis was confirmed neuropathologically by neuropathologists at Rush University Medical Center. For PD, inclusion criteria included a history compatible with idiopathic PD and at least two of the four cardinal signs (rest tremor, rigidity, akinesia/bradykinesia, and gait disturbance/postural reflex impairment). The Unified Parkinson’s Disease Rating Scale (UPDRS “on”) and Hoehn and Yahr staging (H&Y “on”) were recorded. PD was classified clinically as early (H&Y stages 1-2), moderate (H&Y stage 3) or advanced (H&Y stage 4-5). The pathological diagnosis was based on finding Lewy bodies in catecholamine nuclei such as in the SN. Exclusion criteria included familial PD, dementia with Lewy Bodies, the Lewy body variant of AD, or the combination of PD and AD. PSP was characterized clinically by parkinsonism associated with supranuclear ophthalmoplegia and postural reflexes impairment and falls within one year of onset of the clinical syndrome. Neuropathological diagnosis was based on the characterizations of neuronal loss, gliosis and neurofibrillary tangles. AD and age-matched control subjects were all participants in the Religious Order Study, a longitudinal clinical-pathological study of aging and AD, which was composed of older Catholic nuns, priests, and brothers. Each participant received a clinical evaluation that included an assessment for movement disorders. Details of the clinical evaluation have been reported previously (Chu et al., 2001; Kordower et al., 2001). A team of investigators led by a neurologist performed a complete clinical evaluation annually. The pathological diagnosis in these cases was made by a neuropathologist at Rush University Medical Center. Subjects without neurological or psychiatric illnesses were included in the control group. AD was diagnosed clinically by the examining neurologist and by demonstration of impairment on neuropsychological testing by the neuropsychologist (Chu et al., 2001). The study was approved by the Human Investigation Committee at Rush University Medical Center.
Tissue preparation
At autopsy, the brains were removed from the calvarium and processed as described previously (Chu et al., 2001, 2002; Kordower et al., 2001). Briefly, each brain was cut into 1 cm thick coronal slabs, using a Plexiglas brain slice apparatus, and then hemisected. The left side brain slabs were frozen and stored at -80 °C. The right side brain slabs were fixed in 4% paraformaldehyde for 48 hours at 4°C and cryoprotected in 0.1 M phosphate buffer saline (PBS; pH 7.4) containing 2% dimethlsulfoxide (DMSO), 10% glycerol for 24 hours followed by 2% DMSO, 20% glycerol in PBS for at least 2 days prior to sectioning. The fixed slabs containing the SN and hippocampus were cut into 18 adjacent series of 40 μm thick sections on a freezing sliding microtome for this study. All sections were collected and stored in a cryoprotectant solution prior to processing.
Immunohistochemical procedures
An immunoperoxidase labeling method was used to visualize the Nurr1, TH, α-synuclein, and paired helical filament-1 (PHF-1) in neurons. Nurr1 (E-20, Santa Cruz, CA) is an affinity purified rabbit polyclonal antibody raised against amino acids 579-598 (P03354). This antibody recognizes a 66 kDa band of Nurr1 protein in human tissue using immunoblot (Luo et al., 2003). The α-synuclein (LB 509, Zymed, CA), a monoclonal antibody, directly recognizes amino acids 115-122 of human α-synuclein (P37840, Jakes et al., 1999), which does not react β-synuclein (Spillantini et al., 1997). Reactivity has not been observed with γ-synuclein. On Western blots, it has been detected as an ∼18 kDa band corresponding to human α-synuclein (Deepak et al., 2003). The TH (ImmunoStar Inc, WI) is a mouse monoclonal antibody generated against TH that has been isolated and purified from rat PC12 cells. This antibody recognizes an epitope on the outside of the regulatory N-terminus, a protein of 60 kDa by western blot. PHF-1 (Ser396/404, gift from Dr. Peter Davies; Albert Einstein School of Medicine) is monoclonal antibody which recognizes the 58 kDa, 55 kDa and 53 kDa phosphorylated epitopes of tau proteins (Chiang et al., 1993). Endogenous peroxidase-containing elements were eliminated by a 20 minute incubation in 0.1M sodium peroxidate and background staining was blocked by a 1 hour incubation in a solution containing 2% bovine serum albumin and either 5% normal goat serum (for Nurr1) or 5% normal horse serum (for TH, α-synuclein, and PHF-1). Four series of sections through the rostrocaudal SN were immunostained for Nurr1 (1:1,000), TH (1:10,000), α-synuclein (1:5,000), and PHF-1 (1: 5,000). As a positive control, an additional series of sections through the hippocampus from Parkinson’s disease and age-matched controls were immunostained for Nurr1 and processed as above. All immunohistochemical reactions were completed with 0.05% 3′3-diaminobenzidine (DAB) and 0.005% H2O2. Sections were mounted on gelatin-coated slides, dehydrated through graded alcohol, cleared in xylene, and cover slipped with Cytoseal.
Double label immunofluorscence
A double-label immunofluorescence procedure was employed to determine whether Nurr1 expression within nigral neurons in PD was altered in neurons that coexpressed TH, α-synuclein, or PHF-1. To assess the intensity of Nurr1 and TH within SN neurons, the immunofluorescence was performed with Cy5, a fluorophore in the infrared range. The auto-fluorescence from lipofuscin is minimized within this range of the visual spectrum. Sections through the SN from each brain were incubated in the first primary antibody Nurr1 (1:500) or TH (1:500; polyclonal antibody; Chemicon) overnight at room temperature. This rabbit polyclonal TH antibody recognizes a 59 kDa band of tyrosine hyroxylase protein in human tissue under SDS reducing conditions, using immunoblot (Per et al., 1996). Following six washes in TBS, the sections were sequentially incubated with the goat anti-rabbit antibody coupled to Cy5 (1:200; Jackson ImmunoResearch) for 1 hour. After six washes in TBS, the sections were blocked again for 1 hour in a solution containing 5% goat serum, 2% bovine serum albumin and 0.3 % Triton ×-100 in TBS. Sections were then incubated in the second primary α-synuclein (1:2,500) or PHF-1 (1:2,500) monoclonal antibody overnight, separately, at room temperature. After six washes, the sections were incubated sequentially in the goat anti-mouse antibody coupled to cy2 (1:200; Jackson ImmunoResearch) for 1 hour. The sections were mounted on gelatin-coated slides, dehydrated through graded alcohol, cleared in xylene, and cover slipped with DPX. The double labeling of Nurr1 and NeuN (1:1,000 monoclonal antibody; Chemicon) in the hippocampal neurons or TH (1:5,000; monoclonal antibody) in the SN neurons was performed separately using the same method.
Stereology
The number of Nurr1 immunoreactive (Nurr1-ir) and TH immunoreactive (TH-ir) positive or Nurr1-ir and TH-ir negative NM neurons within the substantia nigra was estimated stereologically using an optical fractionator unbiased sampling design (Chu et al., 2002; Kordower et al., 2001; West et al., 1991). An investigator blinded to the clinical and pathological data performed all analyses. In each case, we evaluated major portion of the SN that extended from the caudal level of the mammillary bodies to the decussation of the superior cerebellar peduncle. The rostral portion of the SN was not included in the stereological analysis, because it was detached from the brainstem block. The sections containing SN were carefully defined with the red nucleus and the fibers originating from the ocular motor nucleus. The Approximately seven equispaced sections for each stain or marker along the SN were sampled from each brain. The section sampling fraction (ssf) was 1/0.055. The distance between sections was approximately 0.72 mm. In cross section, the SN is located in the ventral midbrain. It has an ellipsoid shape oriented diagonally from ventromedial to lateral and defined ventrally by the cerebral peduncle, and medially by the third cranial nerve rootlets. The SN was outlined using a 1.25X objective. A systematic sample of the area occupied by the SN was made from a random starting point (StereoInvestigator 2000 software; Micro-BrightField, Colchester, VT). Counts were made at regular predetermined intervals (x = 313μm, y = 313μm) and a counting frame (70 × 70 μm =4,900 μm2) was superimposed on the image of the tissue sections. The area sampling fraction (asf) was 1/0.05. These sections were then analyzed using a 100x Planapo oil immersion objective with a 1.4 numerical aperture. The section thickness was empirically determined. Briefly, as the top of the section was first brought into focus, the stage was zeroed at the z-axis by software. The stage then stepped through the z-axis until the bottom of the section was in focus. Section thickness averaged 20.21±2.3 μm in the midbrain. The disector height (counting frame thickness) was 11 μm. This method allowed for a 3 μm top guard zones and at least a 3 μm bottom guard zones. The thickness sampling fraction (tsf) was 1/0.54 in the SN. Care was taken to ensure that the top and bottom forbidden planes were never included in the cell counting. The Nurr1-ir, TH-ir, or NM-containing nigral neurons were only counted if the first recognizable labeled profiles came into focus within the counting box. Using stereological principles, Nurr1-ir, TH-ir, or NM neurons in each case were sampled by a uniform, systematic, and random design procedure. The total number of Nurr1-ir, TH-ir or NM neurons within the SN was calculated using the following formula: N= ΣQ- ·1/ssf ·1/asf · 1/tsf. ΣQ was the total number of raw counts. The coefficients of error (CE) were calculated according to the procedure of Schmitz C and Hof PR as estimates of precision (Schmitz C and Hof PR, 2000). The values of CE were about 0.05 to 0.07 in age-matched controls and AD groups and 0.07 to 0.13 in PD and PSP groups. The volume of the SN was estimated according to Cavalieri’s principle (Cavalieri, 1966; Gundersen HJ and Jensen EB, 1987).
Fluorescence intensity measurements
All immunofluorescence double-labeled images were scanned with the Olympus Confocal Fluoroview microscope equipped with argon and krypton lasers (Olympus America, Inc.). To maintain consistency of the scanned image for each slide, the laser intensity, confocal aperture, PMT voltage, offset, electronic gain, scan speed, image size, filter, and zoom were set for the background level with a control section and maintained throughout the entire experiment (Chu et al., 2002). Imaging was performed with a 20X objective and a 488-nm or 647-nm excitation source. All optical density (OD) measurements were performed using stereological principles of random and systematic sampling. The intensity mapping sliders ranged from 0 to 4095, 0 represented a maximum black image, and 4095 represented a maximum bright image. The Nurr1-ir positive neurons with or without α-synuclein immunoreactive (α-synuclein-ir) inclusions or PHF-1 immunoreactive (PHF-1-ir) tangles were identified and outlined separately by an investigator blinded to the clinical and pathological data. Quantitative OD of immunofluorescence intensity was performed on individual Nurr1-ir nuclei with or without α-synuclein-ir inclusions or PHF-1-ir tangles using FLUOVIEW software. The same methods described above were employed for the quantitative OD of TH-ir fluorescence intensity measurements. For each marker, five equi-spaced sections across the entire length of the SN were sampled and evaluated. To account for differences in background staining intensity, five background intensity measurements lacking immunofluorescent profiles were taken from each section. The mean of these five measurements constituted the background intensity. The background intensity was then subtracted from the measured immunofluorescence intensity of each individual neuron to provide a final immunofluorescence intensity value.
To confirm co-localization of Nurr1 and TH, α-synuclein or PHF-1 immunofluorescence, optical scanning through the neuron’s Z axis was performed at 1μm thicknesses and neurons suspected of being double label neurons were rotated to ensure the accuracy of this observation.
Immunohistochemical controls
Immunohistochemical control experiments included omitting the primary antibodies (which controls for the specificity of the staining procedure and the secondary antibody), replacing the primary antibodies with irrelevant IgG matched for protein concentration. The control sections were processed in a manner identical to that described above. The adsorption control experiment for Nurr1 antibody was reported previously (Chu et al., 2002). Briefly, the Nurr1 antibody was combined with a 5-fold volume (by weight) of blocking peptide (sc-990P, Santa Cruz) in TBS and incubated overnight at 4 °C. The immune complexes with the antibody and blocking peptide were centrifuged at 10,000rpm for 20 min. The adsorbed protein/antibody complex was then used in lieu of the primary antibody. This resulted in a total absence of staining. Additionally, the staining patterns for TH (Kitahama et al., 1990), and α-synuclein (Spillantini et al., 1997) were similar to what has been reported. All control experiments resulted in the absence of specific staining.
Data analysis
The neuronal counts and OD measurements were analyzed using a factorial analysis of variance model (ANOVA). Where appropriate, post hoc comparisons between groups were performed using the method of Scheffé. The correlations between measures or morphological data (Nurr1-ir and TH-ir neuronal number or OD) were performed using Spearman’s rank correlation. All significance tests used alpha level was set at 0.05 (two-tailed).
Digital illustrations
Confocal images were exported from the Olympus Laser Scanning Microscopy Fluoview, and stored as TIFF files. Conventional light microscopic images were acquired using a Nikon Microphoto-FXA Microscopy attached Nikon digital camera DXM1200 and stored as TIFF files. All figures were prepared using Photoshop 7.0 graphics software. Only minor adjustments of brightness were employed.
RESULTS
Morphological features of Nurr1-ir neurons
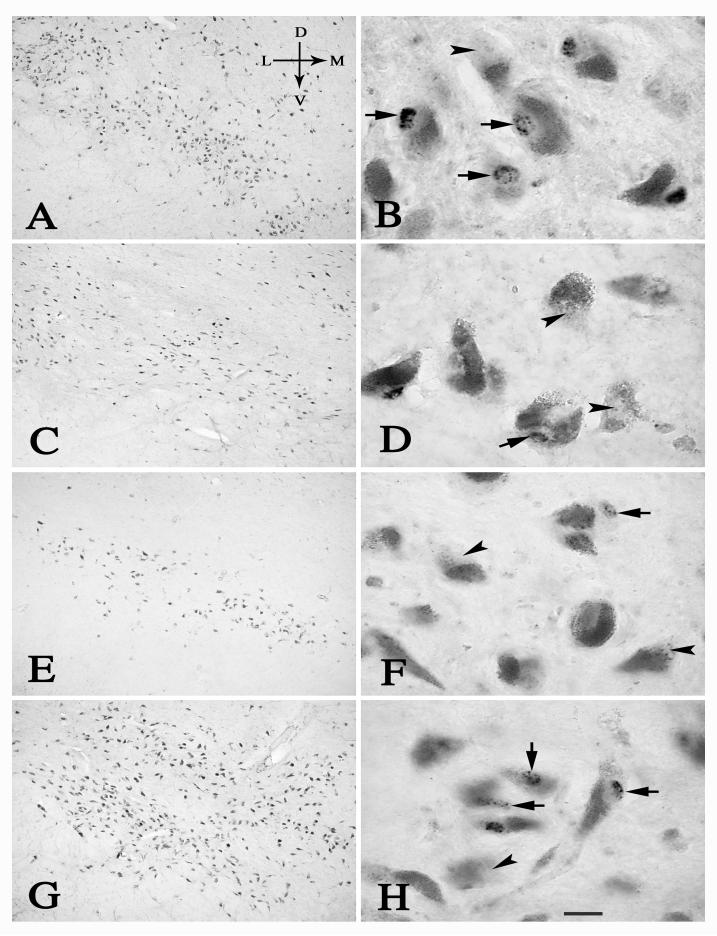
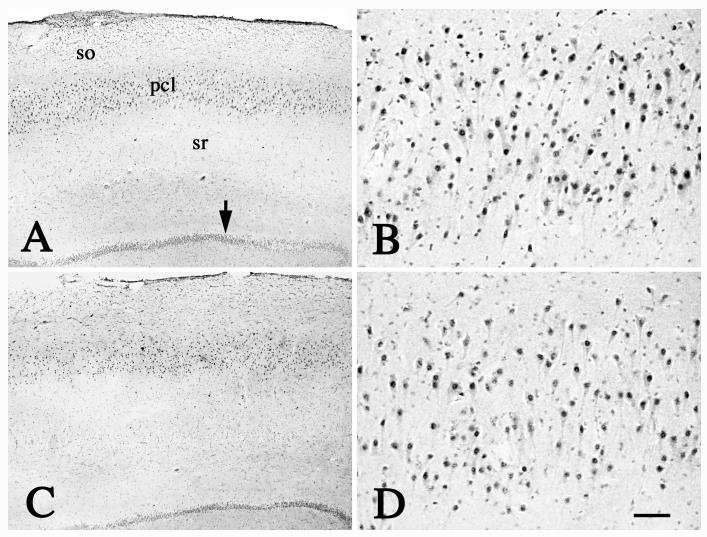
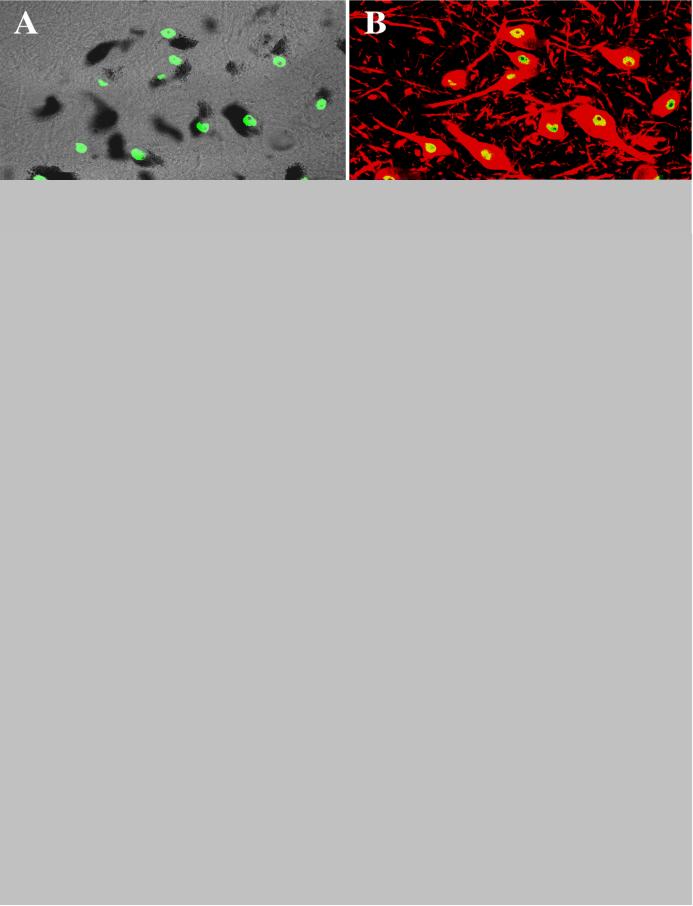
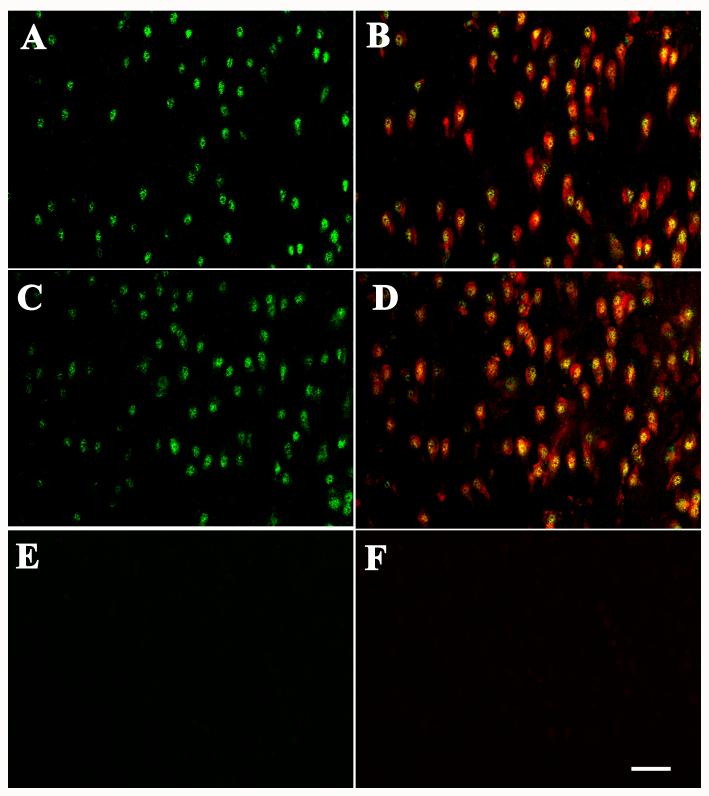
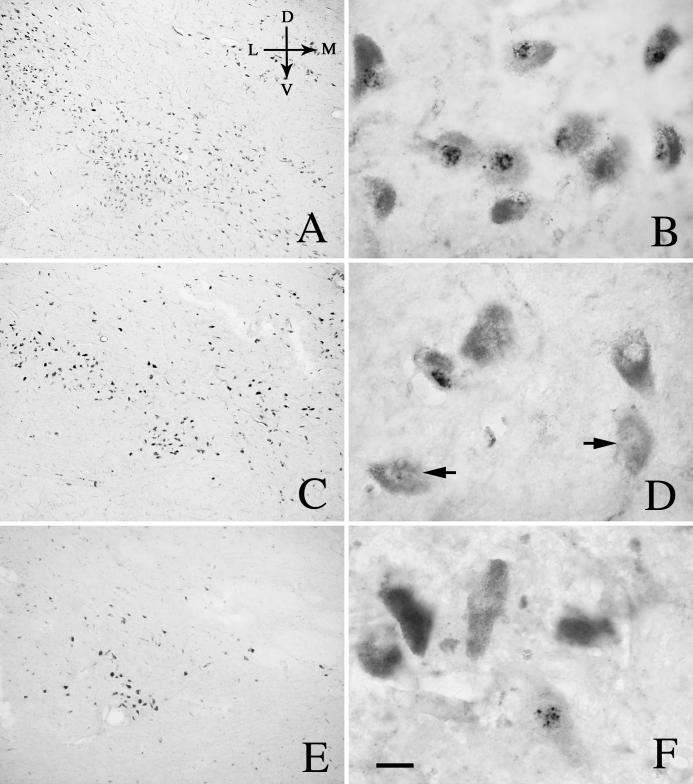
Nurr1-ir profiles were observed within the nuclei of neurons in the SN (region of interest; Fig 1B, D, F, H) and the hippocampus (positive control; Fig. 2B, D) in all cases. Within the human midbrain DA neurons contain NM. NM provides an easily discernible endogenous marker for DA neurons, allowing for an easy assessment of co-localization for Nurr1 in DA neurons. In the present study, we found that Nurr1 immunoreactivity extensively co-localized with NM-containing neurons in the SN (Fig. 1). There were only rare Nurr1-ir nuclei seen in non-NM-containing nigral cells. Confocal microscopic analysis confirmed that Nurr1-ir nuclei co-localized with TH immunoreactivity in the SN (Fig.3) and NeuN immunoreactivity in the hippocampus (Fig. 4).
Fig.1.
Low- (left) and high-power (right) photomicrographs of sections through the mid-SN from age-matched control (A, B), PD (C, D), PSP (E, F) and AD (G, H) cases, illustrating the distribution of Nurr1 immunoreactivity in the SN. In age-matched control (B) and AD cases (H), most of NM neurons were Nurr1-ir positive (arrows), although a few of them were Nurr1-ir negative (arrowheads). In contrast, majority of NM neurons were Nurr1-ir negative (arrowheads) and only a few of them were Nurr1-ir positive (arrows) in the PD (D) and PSP cases (F). Scale bar in H= 300μm (applies to A, C, E, G), 20μm in B, D, F, H. Arrows in A indicate dorsal (D), ventral (V), median (M), and lateral (L) orientation.
Fig. 2.
Low- (A, C) and high-power (B, D) photomicrographs of hippocampal formation from age-matched control (A, B) and PD (C, D) case, illustrating that the Nurr1-ir neurons were mainly distributed in the pyramidal cellular layer of CA1 (pcl) and granular cellular layer (arrow). No differences were seen in the hippocampal formation between age-matched controls and PD cases. so: stratum oriens; sr: stratum radiatum. Scale bar in D= 300μm (applies to A, C), 60μm in B, D.
Fig.3.
Laser confocal microscopic images of SN from age-matched control (A, B), PD (C, D), PSP (E, F), and AD (G, H) cases, illustrating that Nurr1 co-localizes with NM (Nurr1: green; NM: black transparent optics; A, C, E, G) and TH (TH: red; B, D, F, H). Note that both Nurr1 and TH immunofluorescence intensity in SN neurons were diminished in PD and PSP cases. Scale bar in D= 40μm (applies to all of them).
Fig. 4.
Laser confocal microscopic images of hippocampus from age-matched control (A, B) and PD (C, D) case, illustrating the Nurr1 (green; A, C) distribution and colocalization with NeuN (NeuN: red; Nurr1: yellow; B, D). Note that virtually all of the NeuN immunoreactive neurons displayed Nurr1 immunoreactivity within the nucleus and no differences in the Nurr1 immunofluorescence intensity and labeling cell density were seen in the hippocampal formation between age-matched controls and PD cases. The background intensity was set at a level without autofluorescence with Nurr1 (E) and NeuN /Nurr1 (F) primary antibodies deleted. Scale bar in D= 80μm (applies to A-F).
Alteration of Nurr1-ir neurons in the SN: qualitative observations
In age-matched control cases, Nurr1-ir neurons were seen in both the dorsal and ventral tiers of the SN (Fig. 1A). The majority of NM neurons were Nurr1-ir, although a few were Nurr1-ir negative (Fig.1B). Intense Nurr1-ir granules labeled the entire nucleus but not in the cytoplasm.
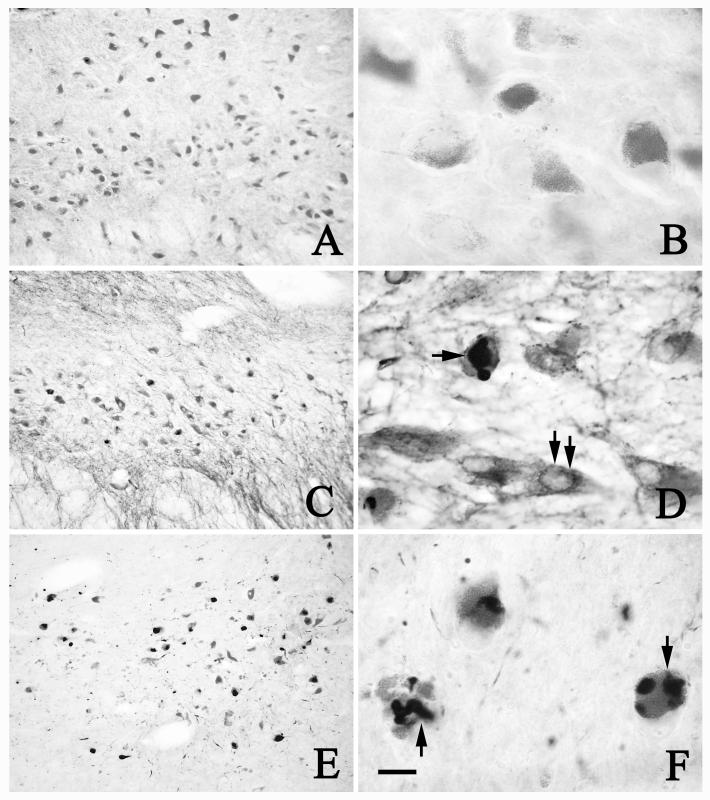
A decrease in the number of Nurr1-ir neurons was observed in all PD cases, a fact that is not surprising since Nurr1 extensively co-localizes within nigral neurons. The extent of Nurr1-ir neuronal loss was dependent on the clinical stage of PD. Qualitative observations indicated that the loss of Nurr1-ir/NM positive neurons was preferentially seen within the ventral tier of the SN (Fig. 1C, 5C, E). Additionally there was an obvious diminution in the intensity of Nurr1 immunoreactivity in moderate stage PD (H and Y stage 3 “on” Fig. 1D, 5D). Nurr1 immunoreactivity was undetectable in many NM-containing cells in PD indicating a loss of Nurr1 expression in previously immunopositive cells (Fig.1D, 5D). In advanced PD, numerous NM neurons were lost, as expected, regardless whether they expressed Nurr1 or not (Fig. 5E, F).
Fig. 5.
Low- (A, C, E) and high-power (B, D, F) photomicrographs of sections through the mid-SN from age-matched control (A, B), H&Y stage3 PD (C, D), and H&Y stage5 PD (E, F), illustrating the decline of Nurr1-ir intensity (arrows) in H&Y stage3 PD (C, D) and the severe decrease of Nurr1-ir neuronal number in H&Y stage5 PD (E, F). Scale bar in D= 300μm (applies to A, C, E), 20μm in B, D, F. Arrows in A indicate dorsal (D), ventral (V), median (M), and lateral (L) orientation.
In PSP, qualitative observations indicate an extensive loss of NM-containing cells and there was extensive loss of Nurr1 immunoreactivity within NM containing nigral neurons (Fig. 1E, F). In contrast to PD and PSP, most of NM neurons were Nurr1 positive in AD (Fig. 1G, H).
Alteration of Nurr1-ir neurons in the SN: quantitative observations
Stereologic estimates of Nurr1-ir/NM positive neurons in the SN revealed a significant loss of cells in the PD and PSP groups but not in the AD group as compared to age-matched controls (Table 2). A factorial ANOVA revealed a statistically significant difference in the number of Nurr1-ir/NM positive neurons within the SN across the four groups (F [3, 37] =8.89; P<0.001). Post hoc analyses revealed a significant difference in the number of Nurr1-ir/NM positive neurons between the PD and age-matched controls (P<0.001), PD and AD (P<0.01), PSP and age-matched controls (P<0.001), and PSP and AD (P<0.001). There were no differences between PD and PSP (P>0.05) and AD and age-matched controls (P>0.05). Although the number of Nurr1-ir/NM positive neurons was significantly decreased, the percentage of Nurr1-ir/NM negative neurons was increased in PD (56.05%), PSP (57.38%) but not in AD (34.79%) relative to age-matched controls (35.94%), indicating a loss of Nurr1 expression in previously immunopositive neurons.
Table 2.
Cellular count analysis of melanized, nurr1-ir, and TH-ir neurons in substantia nigra
| Group | Case | SN | NM | Nurr1-ir/NM |
TH-ir /NM |
||
|---|---|---|---|---|---|---|---|
| Volume (mm3) |
neuronal number |
positive neuron number |
negative neuron % |
positive neuron number |
negative neuron % |
||
| Aged | 10 | 39.80±11.61 | 188530±18183 | 120761±10660 | 35.94 | 168384± 9864 | 10.68 |
| PD | 15 | 32.38±14.77 | 93792±126481 | 41217± 695812 | 56.05 | 52677± 689112 | 43.83 |
| PSP | 8 | 44.83±12.01 | 79543±3421812 | 33899±1183413 | 57.38 | 32018±1259213 | 59.74 |
| AD | 8 | 37.94±15.08 | 148223±17305 | 96652±16122 | 34.79 | 131511±38177 | 11.27 |
Data presented as mean with standard deviation
p<0.001 compared with age-matched controls
p<0.01 compared with Alzheimer’s disease (AD)
p<0.001 compared with Alzheimer’s disease (AD), PD: Parkinson’s disease
PSP: progressive supranuclear palsy
α-synuclein inclusions and neurofibrillary tangles in SN
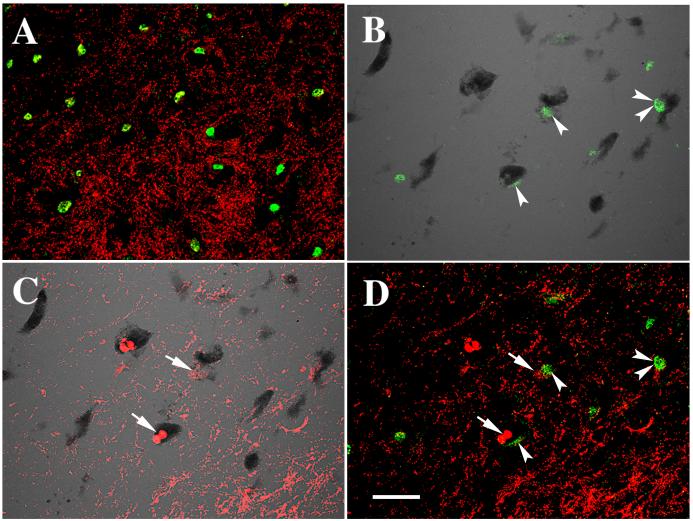
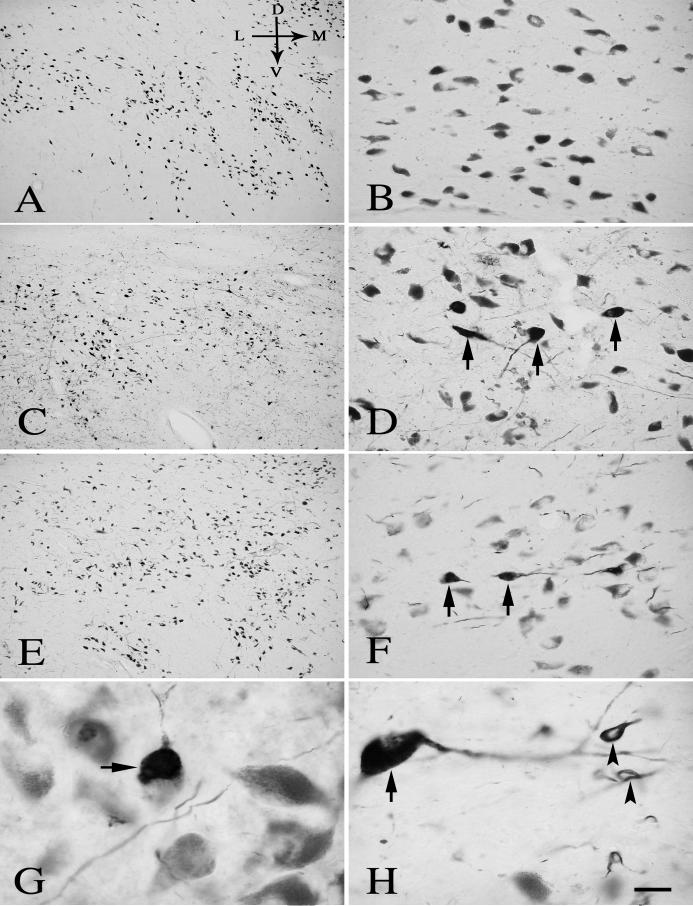
α-synuclein-ir inclusions and swollen neurites were seen in all PD cases (Fig.6D,F). The α-synuclein-ir inclusions co-localized with NM-containing nigral perikarya (Fig.6D, F). There were two distinct morphological types of α-synuclein-ir inclusions: Type I was characterized by round dark deposits in the cytoplasm (Fig. 6D, F); Type II was characterized by lightly-stained diffuse α-synuclein-ir deposits distributed around nigral nuclei (Fig. 6D). Confocal microscopic analysis revealed that Nurr1-ir nuclei were barely detected in NM neurons with Type I α-synuclein-ir inclusions (Fig. 7D). NM-containing neurons with Type II α-synuclein-ir inclusions had minimal levels of Nurr1 immunoreactivity within the nucleus (Fig. 7D). In contrast to PD, there were no α-synuclein-ir inclusions within the NM-containing perikarya in age-matched control cases (Fig. 7A), PSP, and AD. While not having α-synuclein inclusions, PSP and AD cases did display PHF-1-ir neurofibrillary tangles in the SN (Fig. 8C-H; 9B, C; 10B, C). There were no PHF-1-ir NM neurons detected in the SN of age-matched controls (Fig.8A, B; 9A, 10A) and PD cases.
Fig. 6.
Low- (A, C, E) and high-power (B, D, F) photomicrographs of sections of SN from age-matched control (A, B), H&Y stage3 PD (C, D), and H&Y stage5 PD (E, F) cases, illustrating the α-synuclein immunoreactivity. There was little α-synuclein staining with no inclusions within NM neurons in the age-matched control (A, B). α-synuclein-ir defined aggregations type I (arrows; D) and diffuse inclusions type II (double arrows; D) were seen within NM neurons in H&Y stage3 PD cases. The defined α-synuclein-ir type I inclusions (arrows; F) were only observed within the NM neurons in H&Y stage5 PD. Scale bar in D =120μm (applies to A, C, E), 20μm in B, D, F.
Fig. 7.
Laser confocal microscopic images of SN from an age-matched control (A) and PD (B, C, D), illustrating that Nurr1 (green) colocalized with α-synuclein (red; A, D) and NM (black; transparent optics; B), α-synuclein (red) colocalized with NM (C). Note that the Nurr1 (arrowheads) immunofluorescence intensity was severely diminished in the neurons with α-synuclein-ir inclusions (arrows) but not in the neurons without α-synuclein-ir inclusions (double arrowhrads) PD case (D). In contrast, the intense Nurr1-ir nuclei and α-synuclein-ir terminals but no α-synuclein-ir inclusions were observed in age-matched control (A). Scale bar in D= 40μm (applies to A-D).
Fig. 8.
Low- (A, C, E) and high-power (B, D, F, G, H) photomicrographs of sections of SN from age-matched control (A, B), PSP (C, D, G), and AD (E, F, H) cases, illustrating the PHF-1 immunoreactivity. There was no PHF-1-ir NFT within NM neurons in the age-matched control case (A, B). PHF-1-ir NFTs were seen within NM neurons (arrows; D, G) in AD. PHF-1-ir NFTs were not only observed in NM neurons (arrows; F, H) but also in glial cells (arrowheads; H) in PSP cases. Scale bar in H = 300μm (applies to A, C, E), 60μm in B, D, F, and 20μm in G, H. Arrows in A indicate dorsal (D), ventral (V), median (M), and lateral (L) orientation.
Fig. 9.
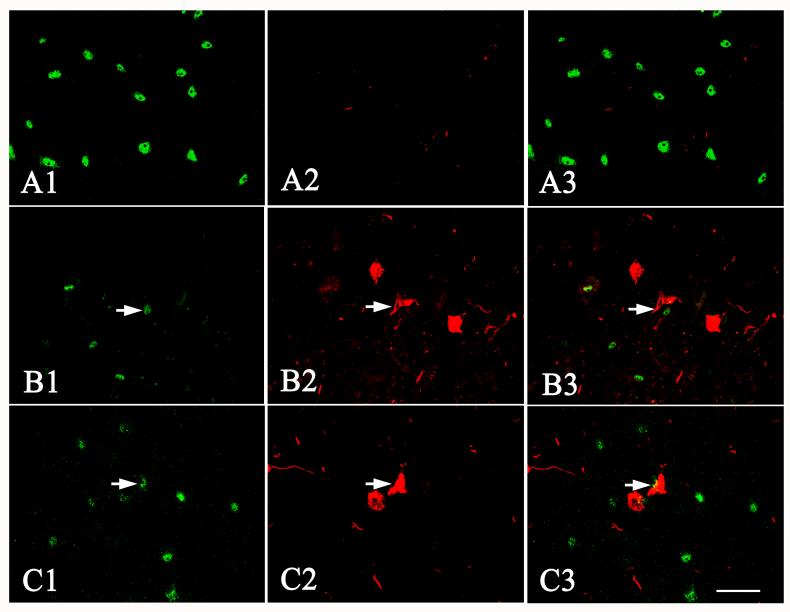
Laser confocal microscopic images of SN from age-matched control (A1-A3), progressive supranuclear palsy (B1-B3), and Alzheimer’s disease (C1-C3) cases, illustrating the intensity of Nurr1 (A1, B1, C1) and PHF-1 (A2, B2, C2) immunofluorescence and the colocalization of Nurr1 and PHF-1 (merged pictures; A3, B3, C3). Note that the Nurr1 immunofluorescence intensity (arrows) was severely diminished by PHF-1 NFT in progressive supranuclear palsy and Alzheimer’s disease cases. In contrast, the PHF-1-ir NFTs in SN were not observed in age-matched control case (A2). Scale bar in C3= 40μm (applies to all of them).
Fig. 10.
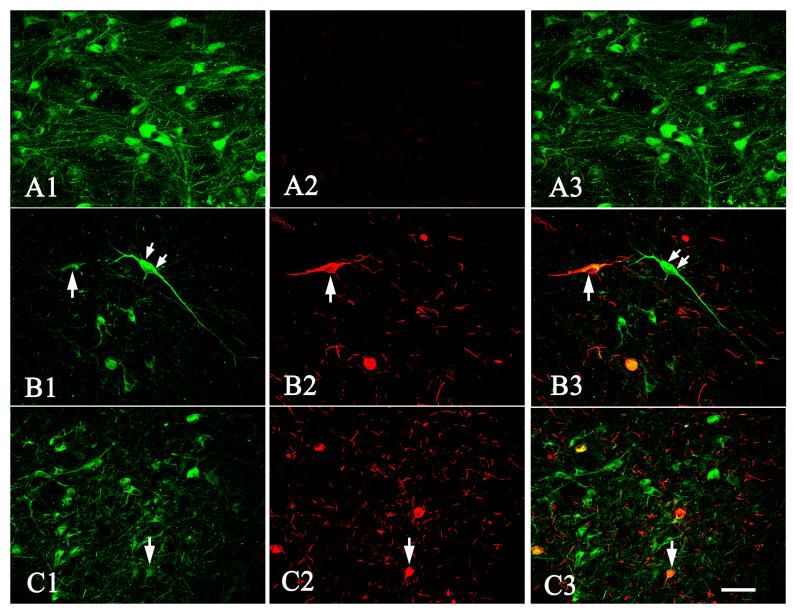
Laser confocal microscopic images of SN from age-matched control (A1-A3), progressive supranuclear palsy (B1-B3), and Alzheimer’s disease (C1-C3) cases illustrating the intensity of TH (A1, B1, C1) and PHF-1 (A2, B2, C2) immunofluorescence and the colocalization of TH and PHF-1 (merged pictures; A3, B3, C3). Note that the TH immunofluorescence intensity was severely diminished in the neurons with PHF-1-ir NFT (arrows) but not in the neurons without PHF-1-ir NFT (double arrows) in progressive supranuclear palsy and Alzheimer’s disease cases. In contrast, the PHF-1 NFT in SN was not observed in age-matched control cases. Scale bar in C3= 80μm (applies to all of them).
Decreased Nurr1 immunofluorescence in nigral neurons in PD, PSP, and AD
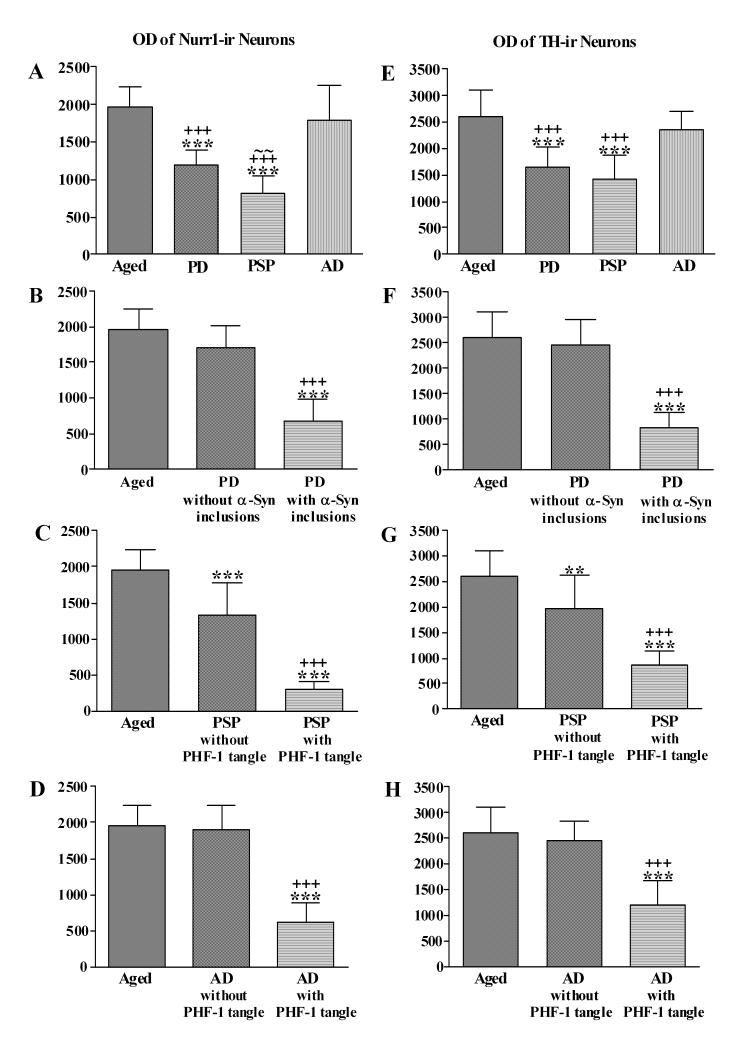
Quantitative fluorescence intensity measurements, performed on individual Nurr1-ir neurons from all cases demonstrated that the OD of Nurr1 immunofluorescence was significantly decreased in PD and PSP but not in AD relative to age-matched controls (F[3,36]=41.64; p<0.001; Fig. 11A). Post hoc analyses revealed a significant difference in the OD of Nurr1-ir neurons between the PD and age-matched controls (P<0.001), PD and AD (P<0.001), PD and PSP (P<0.05), PSP and age-matched controls (P<0.001), PSP and AD (P<0.001), but not between AD and age-matched controls (P>0.05).
Fig. 11.
Histograms showing the optical density (OD) of Nurr1 (A-D) and TH (E-H) immunoflurescence intensity within SN neurons. The OD of Nurr1 (A) and TH (E) was significantly decreased in the Parkinson’s disease (PD) and progressive supranuclear palsy (PSP) groups (*** p<0.001 compared to age-matched controls; +++ p< 0.001 compared to Alzheimer’s disease (AD); ∼∼ p<0.05 compared to Parkinson’s disease). Further analyses, the OD of Nurr1 and TH immunofluorescence intensity was significantly reduced in the neurons with α-synuclein-ir (α-Syn) inclusions or PHF-1-ir NFTs but not in the neurons without α-synuclein-ir inclusions or PHF-1-ir NFTs in Parkinson’s disease (B, F) and Alzheimer’s disease (D, H) respectively. In contrast to Parkinson’s disease and Alzheimer’s disease, the OD of Nurr1 and TH immunofluorescence intensity in progressive supranuclear palsy (C, G) was significantly decreased in the neurons with or without PHF-1-ir NFTs (**p<0.05, ***p<0.001 compared to age-matched controls; +++ p<0.001 compared to the neurons without α-Synir inclusions or PHF-1-ir NFTs).
We examined the hippocampus as a positive control for Nurr1 expression. The Nurr1-ir neurons were homogeneously distributed in the pyramidal cell layer of the hippocampus proper and granular cell layer of the dentate gyrus in PD and age-matched controls (Fig. 2, 4). Qualitative observations indicated that there were no differences in the Nurr1-ir neuronal number in the hippocampus between age-matched controls and PD cases. Quantitative fluorescence intensity measurement, performed on individual Nurr1-ir pyramidal neurons, revealed that there was no difference in OD of Nurr1 immunofluorescence intensity between PD (1255.47±34.71) and age-matched controls (1169.33±164.15; P>0.05,), illustrating the specificity of the effects of Nurr1 seen within the SN of PD cases.
Decreased Nurr1 immunofluorescence in PD, PSP, and AD is associated with α-synuclein inclusions or neurofibrillary tangles
We then wanted to test the hypothesis that alterations in Nurr1-immunofluorescence were related to the pathological expression of α-synuclein in the PD substantia nigra. Thus we analyzed Nurr1-immunofluorescence intensity separately in nigral neurons that did or did not contain α-synuclein-ir inclusions. Nurr1 OD was significantly decreased in neurons with α-synuclein-ir inclusions (678.48±309.51, P<0.001; Fig. 11B). However, nigral neurons that lacked α-synuclein-ir inclusions displayed Nurr1-immunofluorescence OD measurements (1707.64±310.11, P>0.05) similar to age-matched controls (1956.97±283.81).
PSP and AD cases do not contain α-synuclein-ir inclusions within the nigra but rather display PHF-1-ir neurofibrillary tangles. We wanted to determine whether the decrease in Nurr1-immunofluorescence intensity seen in PD was specific for cells undergoing α-synuclein mediated degeneration or whether a similar decrease would be seen in nigral neurons in other diseases with different intracellular pathologies. In this regard, quantitative fluorescence intensity measurements, performed on Nurr1-ir neurons in PSP cases indicated that Nurr1 OD was significantly decreased in neurons both with (298.81±101.50, P<0.001;) and without PHF-1-ir NFTs (1331.31±445.93, P<0.01) relative to age-matched controls (Fig. 9A, C; 11C). In AD, Nurr1 OD was significantly decreased only in the neurons with PHF-1-ir NFTs (617.17±271.57, P<0.001) as compared to age-matched controls (Fig. 11D, 9A, 11D).
Alteration of TH immunofluorescence intensity within neurons containing α-synuclein inclusions and neurofibrillary tangles in the SN
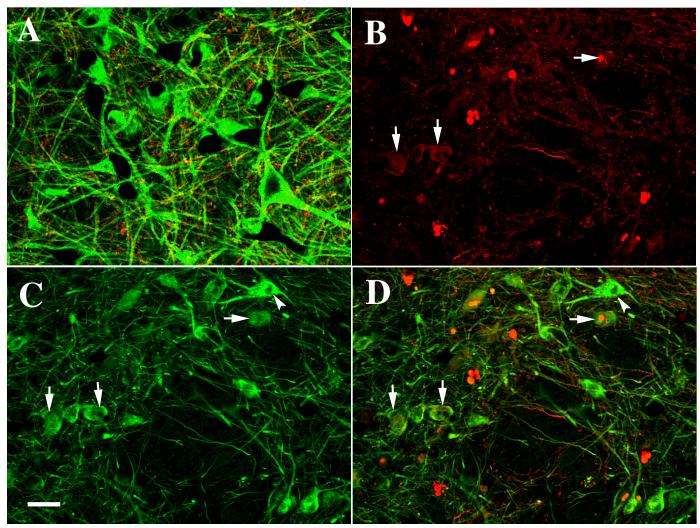
Since Nurr1 was decreased exclusively within nigral neurons that displayed α-synuclein inclusions or neurofibrillary tangles, we then wanted to test the hypothesis that these neurons display a preferential loss of TH. In this regard, we examined the OD of TH-immunofluorescence in PD nigral neurons with or without α-synuclein inclusions or PSP or AD nigral neurons with or without neurofibrillary tangles. When all cells we analyzed together, the OD of TH immunofluorescence intensity, performed on a per neuron basis, was significantly reduced in PD and PSP but not in AD cases compared to age-matched matched controls (F [3, 36]=18.02; P<0.001; Fig.11E). Post hoc analyses revealed a significant difference in the OD of TH-ir neurons between PD and age-matched controls (P<0.001), PD and AD (P<0.001), PSP and age-matched controls (P< 0.001), PSP and AD (P<0.001), but not between AD and age-matched controls (P>0.05) and PD and PSP (P>0.05). When the analysis was extended to compare TH OD in cells with or without intracellular pathology (Fig. 11F, G, H), the findings were similar to those seen with Nurr1. For the most part NM-containing neurons with defined α-synuclein-ir inclusions were TH-ir negative and the NM neurons with diffuse α-synuclein-ir inclusions had a low intensity of TH immunofluorescence staining (Fig. 12B, C, D). NM neurons without α-synuclein inclusions displayed normal levels of TH (Fig.12C, D). In PSP and AD, NM neurons with PHF-1-ir NFT also had a low intensity of TH immunofluorescence (Fig. 10 B, C).
Fig. 12.
Laser confocal microscopic images of SN from an age-matched control (A) and Parkinson’s disease (B, C, D), illustrating the colocalization (merged pictures; A, D) of TH (green) and α-synuclein (red) and the immunofluorescence staining of α-synuclein (B), and TH (C). Note that the TH immunofluorescence intensity was severely diminished (arrows) in the neurons with α-synuclein-ir inclusions (arrows) but not in neurons without α-synuclein-ir inclusions (arrowheads) in Parkinson’s disease cases. In contrast, no α-synuclein-ir inclusions were observed in age-matched controls (A). Scale bar in C= 40μm (applies to A-D).
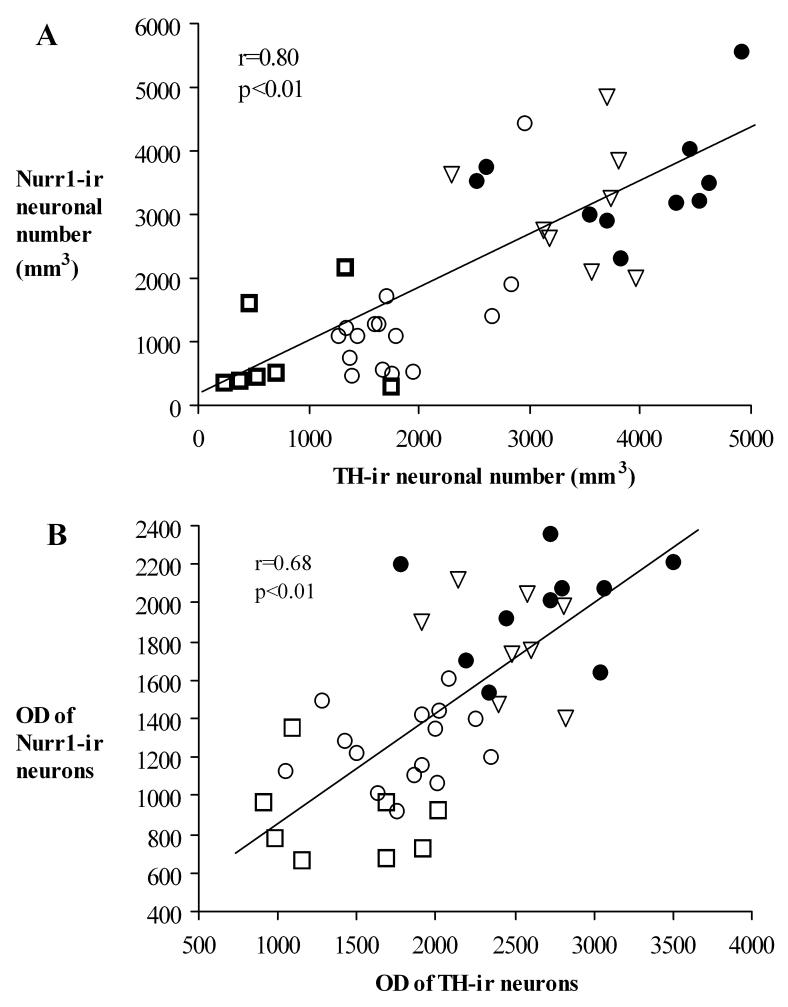
A regression analysis demonstrated that there was a positive correlation between Nurr1-ir and TH-ir neuronal number (r=0.8; P<0.01; Fig. 13A) and OD (r=0.67; P<0.01; Fig. 13B) across groups. There was no correlation of Nurr1-ir decline with either age (r=0.138, p>0.7 for cell number and r=0.25, p>0.5 for OD) or disease duration (r=0.337, p=0.16 for cell number and r=0.312, p=0.17 for OD) in the Parkinson’s disease cases. Finally, there was no correlation of TH-ir decline with either age (r=0.228, p>0.52 for cell number and r=0.157, p>0.23 for OD) or disease duration (r=0.092, p=0.74 for cell number and r=0.345, p>0.21 for OD) in the Parkinson’s disease cases.
Fig. 13.
Scatterplots showing the correlation between the number of Nurr1-ir /NM and TH-ir/NM positive neurons (A) and the OD of Nurr1 and TH immuno-fluorescence intensity (B). ●: Aged, ○: PD, □: PSP, and ▿: AD.
DISCUSSION
Our study is the first to examine alterations of Nurr1 in PD and related disorders like PSP, and AD. The major findings of this study are: (i) Nurr1 immunofluorescence intensity was only decreased in nigral neurons with α-synuclein-ir inclusions and was normal in nigral neurons without inclusions in PD; (ii) down-regulation of Nurr1 expression was observed in SN neurons but not in the hippocampal neurons in patients with PD, illustrating a regional specificity for this change; (iii) Decrease in nigral Nurr1 immunofluorescence was not specific for PD but was observed in other neurodegenerative diseases such as PSP and AD; (iv) decrease in Nurr1 in PSP was observed in nigral neurons independent of whether they expressed NFT; (v) Nurr1 was decreased in AD only in nigral neurons expressing NFT; and (vi) reduction in Nurr1 was associated with reduction in TH.
This dramatic loss of Nurr1 immunoreactivity within the remaining NM neurons in PD is specific for the SN. No difference in Nurr1-ir neuronal number or Nurr1 immunofluorescence intensity was seen within the hippocampus of PD cases and age-matched controls. It is unclear whether the decreased Nurr1 expression is merely a consequence of losing DA neuronal phenotype or is involved in the pathogenesis of the disease. To further investigate this question, we examined the brains of clinically and pathologically diagnosed PSP cases to determine whether reduction in Nurr1 also occurs in this related-disease. There was a severe reduction of the Nurr1-ir neuronal number and the OD of Nurr1 immunofluorescence intensity in the NM neurons in PSP. Therefore, the decline of Nurr1 expression is not specific for PD but is associated with the loss of DA neuronal phenotype and is present in other neurodegenerative diseases involving the nigrostriatal dopaminergic system. The role of Nurr1 deficiency in the loss of the dopaminergic neuronal phenotype is supported by the finding that NM neurons, which still present in the SN of brains of patients with PD and PSP, have lost their DA phenotype and have become Nurr1-ir negative. Additional evidence supporting the role of Nurr1 deficiency in DA neuronal degeneration is that Nurr1 immunofluorescence intensity is remarkably decreased in the neurons with α-synuclein-ir inclusions or PHF-1-ir NFTs but not in the neurons lacking these lesions. These findings suggest that the loss of Nurr1 expression is not only related to the loss of the DA phenotype but also to disease-related cellular attack during the evolutions of the disease process, as defined by the presence of α-synuclein-ir inclusions or NFTs. Reduced Nurr1 expression may predispose DA neurons towards a cascade of events ultimately leading to their demise.
Multiple lines of evidence indicate that several genes involved in the synthesis, axonal transport, storage, release, or reuptake of DA, are regulated by Nurr1. These genes include TH, vesicle membrane-associated transport 2 (VMAT2), DAT, and Ret (Zetterstrom et al., 1997; Saucedo-Cardenas et al., 1998; Castillo et al., 1998). Neonatal Nurr1 knockout mice lack expression of neuronal DAT, VMAT2, TH and Ret (Sacchetti et al., 2001; Wallen et al., 2001; Kim et al., 2003; Castillo et al., 1998; Simon et al., 2003; Eells et al., 2003). These data have confirmed the hypothesis that Nurr1 expression is very important in maintaining the DA phenotype in the fetus and support the concept that age-related decreases of Nurr1 in humans is accompanied by a decline in TH (Chu et al., 2002). Moreover, newborn Nurr1 deficient (-/+) mice show a significant reduction in TH activity and expression relative to the normal (+/+) mice (Eells et al., 2002). Nurr1 deficient (-/+) adult animals treated with MPTP are more susceptible to the effects of the neurotoxin than normal (+/+) mice (Le et al., 1999). The present data demonstrated that OD of Nurr1 immunofluorescence was significantly decreased in nigral neurons that contained α-Synuclein inclusions in PD and NFTs in PSP and AD. The identification of Nurr1 as a developmentally important trophic protein, that acts from early fetal life, raises the possibility that differences in the amount of Nurr1 expression may be important in predisposing these neurons to an earlier than normal death during aging and disease.
A growing body of evidence has implicated α-synuclein in the pathogenesis of PD (Eells, 2003; Dawson and Dawson 2003; Goldberg and Lansbury, 2000). Major support for this hypothesis was derived from the discovery that α-synuclein is identified as a major component of Lewy bodies and dystrophic neurites, i.e., the pathological hallmarks of both sporadic and familial PD (Masliah et al., 2000; Michotte, 2003; Constantino and Honig, 2001). The present study revealed that the NM neurons with α-synuclein-ir inclusions have reduced Nurr1 expression in PD. This finding suggests a possible interaction between Nurr1 and α-synuclein. Although there is no direct evidence linking Nurr1 and α-synuclein genes, Baptista and coworkers (Baptista et al., 2003), demonstrated that α-synuclein coordinates the transcriptional regulation of dopamine synthesis genes, including the gene for Nurr1, in a human neuroblastoma cell line. These data support the hypothesis that such gene-gene interaction may exist between α-synuclein and Nurr1 in the mammalian brain. Our data illustrating that Nurr1 immunoreactivity downregulation is more pronounced in PD compared to age-matched controls and further more pronounced within nigral neurons containing α-synuclein inclusions, while having normal levels in neurons lacking this pathology, further supports this view.
It has been reported that down-regulation of Nurr1 affects the synthesis of VMAT2 and DAT (Hemanson et al., 2003). VMAT2 and DAT deficiency may affect the equilibrium of biochemichal molecule within DA neurons so that α-synuclein could tend to form protofibrils and accumulate in the cell body (Vernier et al., 2004). Ret is the target gene of Nurr1 and is one of the important receptors for the glial cell line-derived neurotrophic factor (GDNF). GDNF, which signals via Ret and an associated co-receptor, has recently been implicated in maintaining the continuing health and viability of DA neurons (Kordower et al., 2000). An intriguing explanation for DA degeneration might be that down-regulation of Nurr1 expression affects neuroprotective regulatory mechanisms, possibly influenced by GDNF or other factors stimulating Ret signal transduction. Another possibility is that down-regulation of Nurr1 expression induces up-regulation of other genes, such as Engrailed-1 and Engrailed-2, which mediate α-synuclein expression (Simon et al., 2003). Additional studies are needed to confirm these hypotheses.
In conclusion, the present study indicates that decrease in Nurr1 immunoreactivity is one of the significant events in the loss of the dopaminergic neuronal phenotype. Nurr1 expression is compromised the most in the cells containing α-synuclein inclusions and NFTs in the SN of patients with synucleopathies and tauopathies respectively. The decline in Nurr1-ir expression is highly correlated with loss of TH immunofluorescence. We have to acknowledge that, due to limitations in neuropathological studies per se, it is impossible to definitely determine whether the correlation we observe is the cause or the effect of the neuronal degeneration. Future studies should focus on the correlation of Nurr1 deficiency with DAT, VMAT2 and Ret deficiencies, to further elucidate the sequence of events leading to the loss of phenotype and eventual death of DA neurons in humans with PD. Identification of factors up-regulating Nurr1 activity may provide a novel therapeutic strategy for the DA deficiency associated with a variety of disorders.
Acknowledgments
Grant sponsor: Parkinson’s Disease Foundation, Rush Neurological Sciences internal grant, and NINDS (NS40370 and NSNS043567).
LITERATURE CITED
- Baptista MJ, O’Farrell C, Daya S, Ahmad R, Miller DW, Hardy J, Farrer MJ, Cookson MR. Co-ordinate transcriptional regulation of dopamine synthesis genes by alpha-synuclein in human neuroblastoma cell lines. J Neurochem. 2003;85:957–968. doi: 10.1046/j.1471-4159.2003.01742.x. [DOI] [PubMed] [Google Scholar]
- Braak H, Del Tredici K, Rub U, de Vos RA, Steur EN Jansen, Braak E. Staging of brain pathology related to sporadic Parkinson’s disease. Neurobiol Aging. 2003;24(2):197–211. doi: 10.1016/s0197-4580(02)00065-9. [DOI] [PubMed] [Google Scholar]
- Castillo SO, Baffi JS, Palkovits M, Goldstein DS, Kopin IJ, Witta J, Magnuson MA, Nikodem VM. Dopamine biosynthesis is selectively abolished in SN/ventral tegmental area but not in hypothalamic neurons in mice with targeted disruption of the Nurr1 gene. Mol Cell Neurosci. 1998;1:36–46. doi: 10.1006/mcne.1998.0673. [DOI] [PubMed] [Google Scholar]
- Cavalieri B. Geometri degli indivisibli Tornio, Unione Tipografico, Editrice. 1966. pp. 1–543.
- Chiang MF, Liu WK, Yen SH. Reversible heat stress-related loss of phosphorylated Alzheimer-type epitopes in Tau proteins of human neuroblastoma cells. J Neurosci. 1993;11:4854–4860. doi: 10.1523/JNEUROSCI.13-11-04854.1993. [DOI] [PMC free article] [PubMed] [Google Scholar]
- Chu Y, Cochran EJ, Bennett DA, Mufson EJ, Kordower JH. Down-regulation of trkA mRNA within nucleus basalis neurons in individuals with mild cognitive impairment and Alzheimer’s disease. J Comp Neurol. 2001;437:296–307. doi: 10.1002/cne.1284. [DOI] [PubMed] [Google Scholar]
- Chu Y, Kompoliti K, Cochran EJ, Mufson EJ, Kordower JH. Age-related decreases in Nurr1 immunoreactivity in the human SN. J Comp Neurol. 2002;450:203–214. doi: 10.1002/cne.10261. [DOI] [PubMed] [Google Scholar]
- Constantino AE, Honig LS. Parkinson’s disease. Sci Aging Knowledge Environ. 2001;(7):dn4. doi: 10.1126/sageke.2001.7.dn4. [DOI] [PubMed] [Google Scholar]
- Dawson TM, Dawson VL. Molecular pathways of neurodegeneration in Parkinson’s disease.[Review] Science. 2003;302:819–822. doi: 10.1126/science.1087753. [DOI] [PubMed] [Google Scholar]
- Sampathu Deepak M., Giasson Benoit I., Pawlyk Aaron C., Trojanowski John Q., Lee Virginia M.-Y. Ubiquitination of α-synuclein is not required for formation of pathological inclusions in α-synucleinopathies. American Journal of Pathology. 2003;163:91–100. doi: 10.1016/s0002-9440(10)63633-4. [DOI] [PMC free article] [PubMed] [Google Scholar]
- Eells JB, Lipska BK, Yeung SK, Misler JA, Nikodem VM. Nurr1-null heterozygous mice have reduced mesolimbic and mesocortical dopamine levels and increased stress-induced locomotor activity. Behav Brain Res. 2002;136:267–275. doi: 10.1016/s0166-4328(02)00185-7. [DOI] [PubMed] [Google Scholar]
- Eells JB. The control of dopamine neuron development, function and survival: insights from transgenic mice and the relevance to human disease. [Review] Curr Med Chem. 2003;10:857–870. doi: 10.2174/0929867033457700. [DOI] [PubMed] [Google Scholar]
- Goldberg MS, Lansbury PT., Jr A cause-and-effect relationship between alpha-synuclein fibrillization and Parkinson’s disease? Nat Cell Biol. 2000;2:E115–119. doi: 10.1038/35017124. [DOI] [PubMed] [Google Scholar]
- Gundersen HJ, Jensen EB. The efficiency of systematic sampling in stereology and its prediction. J Microsc. 1987;147:229–263. doi: 10.1111/j.1365-2818.1987.tb02837.x. [DOI] [PubMed] [Google Scholar]
- Hermanson E, Joseph B, Castro D, Lindqvist E, Aarnisalo P, Wallen A, Benoit G, Hengerer B, Olson L, Perlmann T. Nurr1 regulates dopamine synthesis and storage in MN9D dopamine cells. Exp Cell Res. 2003;288:324–334. doi: 10.1016/s0014-4827(03)00216-7. [DOI] [PubMed] [Google Scholar]
- Jakes R, Crowther RA, Lee VM, Trojanowski JQ, Iwatsubo T, Goedert M. Epitope mapping of LB509, a monoclonal antibody directed against human alpha-synuclein. Neurosci Lett. 1999;269:13–16. doi: 10.1016/s0304-3940(99)00411-5. [DOI] [PubMed] [Google Scholar]
- Kastner A, Hirsch EC, Herrero MT, Javoy-Agid F, Agid Y. Immunocytochemical quantification of tyrosine hydroxylase at a cellular level in the mesencephalon of control subjects and patients with Parkinson’s and Alzheimer’s disease. J Neurochem. 1993;61(3):1024–1034. doi: 10.1111/j.1471-4159.1993.tb03616.x. [DOI] [PubMed] [Google Scholar]
- Kim JH, Auerbach JM, Rodriguez-Gomez JA, Velasco I, Gavin D, Lumelsky N, Lee SH, Nguyen J, Sanchez-Pernaute R, Bankiewicz K, McKay R. Dopamine neurons derived from embryonic stem cells function in an animal model of Parkinson’s disease. Nature. 2002;418:50–456. doi: 10.1038/nature00900. [DOI] [PubMed] [Google Scholar]
- Kim KS, Kim CH, Hwang DY, Seo H, Chung S, Hong SJ, Lim JK, Anderson T, Isacson O. Orphan nuclear receptor Nurr1 directly transactivates the promoter activity of the tyrosine hydroxylase gene in a cell-specific manner. J Neurochem. 2003;85:622–634. doi: 10.1046/j.1471-4159.2003.01671.x. [DOI] [PubMed] [Google Scholar]
- Kitahama K, Geffard M, Okamura H, Nagatsu I, Mons N, Jouvet M. Dopamineand dopa-immunoreactive neurons in the cat forebrain with reference to tyrosine hydroxylase-immunohistochemistry. Brain Res. 1990;518:83–94. doi: 10.1016/0006-8993(90)90957-d. [DOI] [PubMed] [Google Scholar]
- Kordower JH, Emborg ME, Bloch J, Ma SY, Chu Y, Leventhal L, McBride J, Chen EY, Palfi S, Roitberg BZ, Brown WD, Holden JE, Pyzalski R, Taylor MD, Carvey P, Ling Z, Trono D, Hantraye P, Deglon N, Aebischer P. Neurodegeneration prevented by lentiviral vector delivery of GDNF in primate models of Parkinson’s disease. Science. 2000;290:767–773. doi: 10.1126/science.290.5492.767. [DOI] [PubMed] [Google Scholar]
- Kordower JH, Chu Y, Stebbins GT, DeKosky ST, Cochran EJ, Bennett D, Mufson EJ. Loss and atrophy of layer II entorhinal cortex neurons in elderly people with mild cognitive impairment. Ann Neurol. 2001;49:202–213. [PubMed] [Google Scholar]
- Le W, Conneely OM, He Y, Jankovic J, Appel SH. Reduced Nurr1 expression increases the vulnerability of mesencephalic dopamine neurons to MPTP-induced injury. J Neurochem. 1999;73:2218–2221. [PubMed] [Google Scholar]
- Luo Y, Henricksen LA, Maguire-zeiss KA, Federoff HJ. Development of Nurr1 Stable Cell Lines for the Identification of Downstream Targets. Ann. N.Y. Acad. Sci. 2003;991:354–358. [Google Scholar]
- Masliah E, Rockenstein E, Veinbergs I, Mallory M, Hashimoto M, Takeda A, Sagara Y, Sisk A, Mucke L. Dopaminergic loss and inclusion body formation in alpha-synuclein mice: implications for neurodegenerative disorders. Science. 2000;287:1265–1269. doi: 10.1126/science.287.5456.1265. [DOI] [PubMed] [Google Scholar]
- Michotte A. Recent developments in the neuropathological diagnosis of Parkinson’s disease and parkinsonism. [Review] Acta Neurol Belg. 2003;103:155–158. [PubMed] [Google Scholar]
- Ross GW, Petrovitch H, Abbott RD, Nelson J, Markesbery W, Davis D, Hardman J, Launer L, Masaki K, Tanner CM, White LR. Parkinsonian signs and substantia nigra neuron density in decendents elders without PD. Ann Neurol. 2004;56:532–539. doi: 10.1002/ana.20226. [DOI] [PubMed] [Google Scholar]
- Sacchetti P, Mitchell TR, Granneman JG, Bannon MJ. Nurr1 enhances transcription of the human dopamine transporter gene through a novel mechanism. J Neurochem. 2001;76:1565–1572. doi: 10.1046/j.1471-4159.2001.00181.x. [DOI] [PubMed] [Google Scholar]
- Saucedo-Cardenas O, Quintana-Hau JD, Le WD, Smidt MP, Cox JJ, De Mayo F, Burbach JP, Conneely OM. Nurr1 is essential for the induction of the dopaminergic phenotype and the survival of ventral mesencephalic late dopaminergic precursor neurons. Proc Natl Acad Sci USA. 1998;95:4013–4018. doi: 10.1073/pnas.95.7.4013. [DOI] [PMC free article] [PubMed] [Google Scholar]
- Schmitz C, Hof PR. Recommendations for straightforward and rigorous methods of counting neurons based on a computer simulation approach. J Chem Neuroanat. 2000;20:93–114. doi: 10.1016/s0891-0618(00)00066-1. [DOI] [PubMed] [Google Scholar]
- Simon HH, Bhatt L, Gherbassi D, Sgado P, Alberi L. Midbrain dopaminergic neurons: determination of their developmental fate by transcription factors. Ann NY Acad Sci. 2003;991:36–47. [PubMed] [Google Scholar]
- Spillantini MG, Schmidt ML, Lee VM, Trojanowski JQ, Jakes R, Goedert M. Alpha-synuclein in Lewy bodies. Nature. 1997;388:839–840. doi: 10.1038/42166. [DOI] [PubMed] [Google Scholar]
- Vernier P, Moret F, Callier S, Snapyan M, Wersinger C, Sidhu A. The degeneration of dopamine neurons in Parkinson’s disease: insights from embryology and evolution of the mesostriatocortical system. Ann N Y Acad Sci. 2004;1035:231–249. doi: 10.1196/annals.1332.015. [DOI] [PubMed] [Google Scholar]
- Wallen AA, Castro DS, Zetterstrom RH, Karlen M, Olson L, Ericson J, Perlmann T. Orphan nuclear receptor Nurr1 is essential for Ret expression in midbrain dopamine neurons and in the brain stem. Mol Cell Neurosci. 2001;18:649–663. doi: 10.1006/mcne.2001.1057. [DOI] [PubMed] [Google Scholar]
- West MJ, Slomianka L, Gundersen HJ. Unbiased stereological estimation of the total number of neurons in thesubdivisions of the rat hippocampus using the optical fractionator. Anat Rec. 1991;231(4):482–497. doi: 10.1002/ar.1092310411. [DOI] [PubMed] [Google Scholar]
- Zetterstrom RH, Solomin L, Jansson L, Hoffer BJ, Olson L, Perlmann T. Dopamine neuron agenesis in Nurr1-deficient mice. Science. 1997;276:248–250. doi: 10.1126/science.276.5310.248. [DOI] [PubMed] [Google Scholar]


