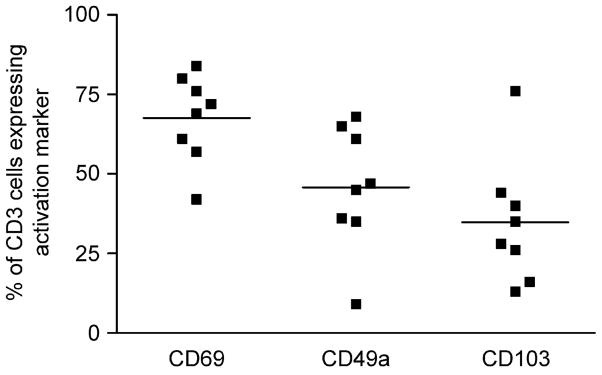
Fig. 1.
Flow cytometry data showing the percentage of CD3+ cells expressing each of the receptors CD69, CD49a and CD103 in lung filtrate samples. Cells were indirectly labelled with the activation markers and directly labelled with CD3PerCP and CD8PE as indicated in the methods section (n = 8). Subject numbers 1–8 were used for these experiments.

