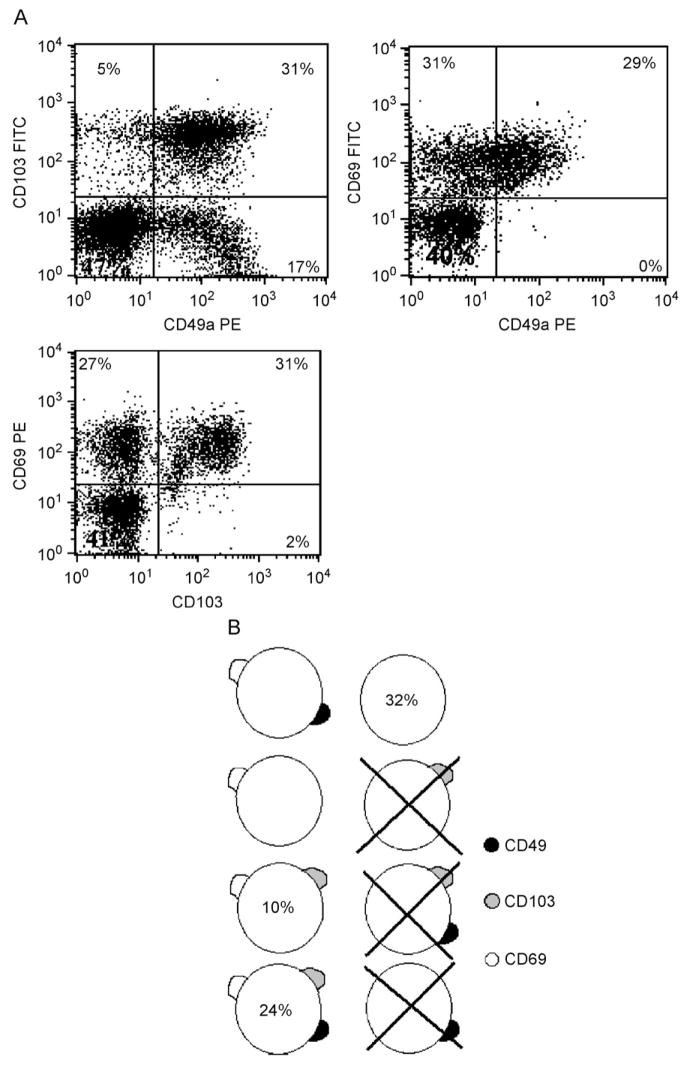
Fig. 2.
(A) Example of three colour flow cytometry dot plots from two separate experiments showing the typical co-expression patterns of the three activation markers studied. All plots are gated on live lymphocytes by forward/side scatter and then on CD3+ cells. (B) Schematic diagram showing the potential combinations of activation marker expression on individual T cells according to the results of three colour flow cytometry experiments. Phenotypes which appear not to exist are crossed out, for other phenotypes where possible, an estimate as to the percent of cells falling into this phenotypic group are denoted by the figure inside the cell.

