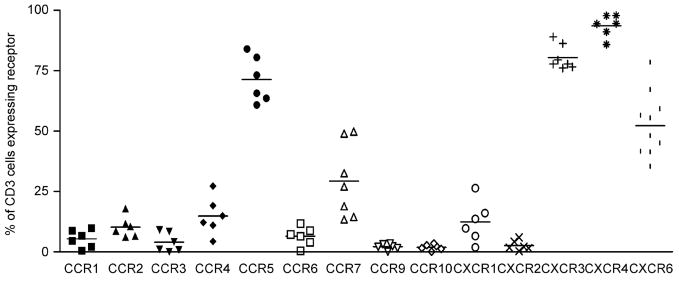
Fig. 4.
Flow cytometry data showing the expression of each CR studied on T cells from lung filtrate. Mean values are represented by a bar. Cells were stained indirectly with the chemokine receptor antibody followed by staining with directly conjugated CD3 PerCP and either CD69 PE or CD103 PE. The percent expression was subtracted from the isotype control (n = 6). Subjects numbers 15–24 were used for these experiments. Subjects 15–20 were used for the majority of the data and subjects 21–24 were used for the additional data on CXCR6.

