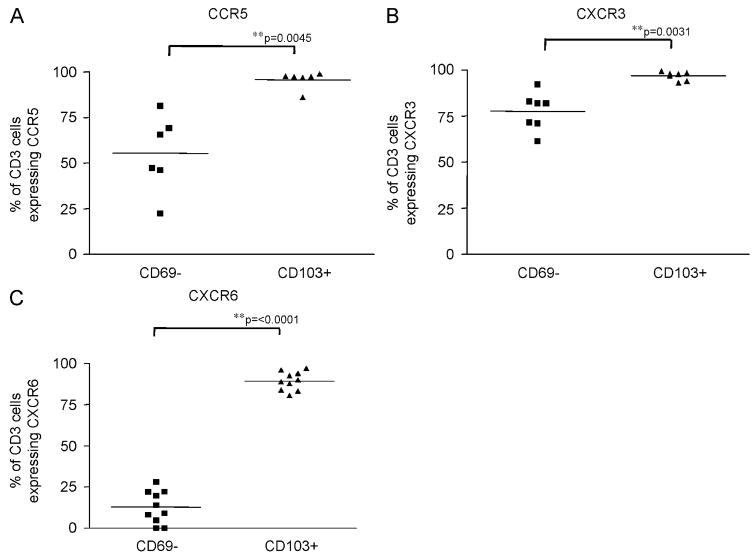
Fig. 5.
Flow cytometry data showing the expression of CCR5 (A) (subjects 15, 16, 17, 19, 20, 21), CXCR3 (B) (subjects 15–21) and CXCR6 (C) (subjects 15–24) in CD69– cells (‘unactivated’) and CD103+ cells (‘activated’). Cells were stained as in Fig. 4. Mean values are represented by a bar.

