Abstract
The two dimensional (2D) photon echo spectrum of the amide ultraviolet (UV) bands of proteins are simulated. Two effective exciton Hamiltonian parameter sets developed by Woody and Hirst, which predict similar CD spectra, may be distinguished by their very different 2DUV spectra. These differences are enhanced in specific configurations of pulse polarizations which provide chirality-induced signals.
I. INTRODUCTION
Ultraviolet (UV) circular dichroism (CD)1,2 and resonance Raman spectroscopy3–7 are widely used for probing the secondary structure and folding dynamics of proteins. Two-dimensional (2D) coherent third-order optical techniques can reveal fine details, unavailable from linear spectroscopy.8 Significant progress has been made over the past decade in developing 2D infrared spectroscopy (2DIR) based on the heterodyne detection of three-pulse photon echoes9,10 towards the study of amide vibrations.11–15 2DUV techniques can complement 2DIR by probing the electronic transitions. In this paper, we focus on the theoretical modeling of 2D photon echo in UV region of protein backbone electronic excitations primarily nπ* (220 nm) and ππ* (190 nm), with two additional shorter-wavelength excitations, πbπ* and n′π* transitions.
Much theoretical effort has been devoted to the modeling of CD spectra of proteins.16–29 Applequist et al.19,20,22 have developed a dipole-interaction model, which yields almost quantitative agreement with experiment for the ππ* transition. This model excludes the nπ* excitation, whose transition dipole vanishes by symmetry. Woody and coworkers have reported a set of parameters for both the nπ* and ππ* CD obtained by semiempirical electronic structure calculations combined with fitting to experiments.17,21,24 Hirst et al.26,27,29 have recently reported an ab initio model for protein CD. This model is based on a high level CASPT2/RF quantum chemistry calculation on excited states of a small prototype molecule N-methylacetamide (NMA). Solvent effects were included by a implicit continuum model approximation.
Fluctuations are not explicitly included in these models. Instead, the one-exciton energies and corresponding rotational strengths are calculated by diagonalizing the exciton Hamiltonian. A Gaussian broadening of all optical transitions is then added. Recently, by combining time-dependent density-functional theory (TDDFT) and molecular dynamics (MD), Frelek et al.30 have simulated the CD spectra of β-lactam with inhomogeneous averaging over conformational fluctuations of molecule geometries.
In this paper, we show how the Woody and Hirst model hamiltonians for protein backbone electronic excitations, which provide an equally good fit for the CD spectra, may be distinguished by 2DUV. Gaussian fluctuations are added to site energies, and the spectra are averaged over the ensemble of these fluctuations. The 2DUV spectrum provides a sensitive probe for protein structure. All theoretical modelings discussed in this paper have been carried out using the spectroscopy simulation package SPECTRON.43 We present the fluctuating exciton Hamiltonian model in section II, and some test calculations of NMA and myoglobin in section III. UV specta of a 17 residue helix are then predicted with this fluctuating model in section IV. Finally, we conclude in section V.
II. THE FLUCTUATING EXCITON HAMILTONIAN
To study electronic transitions in large proteins, we use a Frenkel-exciton Hamiltonian constructed from the peptide chromophore units.
| (1) |
where and B̂iμ are the exciton creation and annihilation operators for the excited state μ of peptide i, with excited energy εiμ. Jiμ,jν is the coupling between state μ of unit i and state ν of unit j. NMA is often used to compute the hamiltonian parameters for a peptide unit, and has been widely studied both experimentally and theoretically.31–38 We have used two sets of parameters for εiμ and Jiμ,jν. One from Woody and Sreerama (WS) which includes three excited states per amide (nπ*, ππ*, and πbπ*),24 and the other from Besley and Hirst (BH) with four excited states (nπ*, ππ*, πbπ* and n′π*).26 We have used an improved parametrization of the WS and BH hamiltonian kindly provided by both authors. In our simulations, we have additionally added fluctuations to these two model hamiltonians.
We first consider fluctuations of coupling Jiμ,jν (off-diagonal fluctuations). In both WS and BH hamiltonians, the couplings are obtained by assuming electrostatic interactions between transition charge densities (TCD).
| (2) |
where ρi0μ is TCD of peptide i between ground state and excited state μ. The integral can be eliminated by representing the TCD as a sum of point charges (the monopole approximation).17,23,24,26 A set of monopoles are assigned to each chromophore, and an MD trajectory in water was generated. Geometry fluctuations along the MD trajectory change the positions of the monopoles, and hence the couplings. Other contributions to off-diagonal fluctuations, such as electrostatic interaction between solvent and solute, are neglected.
To compute the of site energy εiμ (diagonal) fluctuations, we should recalculate the transition energy by performing the electronic structure calculation for each MD trajectory snapshot, as was done in ref30 for small system. But this is not computationally feasible for large polypeptides. We thus added Gaussian random fluctuations to the site energies. We denote these fluctuating hamiltonians as WS and BH respectively (note that in the original WS and BH models a Gaussian lineshape is convoluted with the stick spectrum).
The total hamiltonian will be written as
| (3) |
where H1 is the interaction between the protein and the classical optical field. Using the minimal-coupling Hamiltonian, we have49
| (4) |
where 𝔸 is the vector potential and 𝕁 is the induced current
| (5) |
j̄iμ is the transition current density from ground state to exited state μ of peptide i. The transition current density is related to electric transition dipole μ̄, magnetic transition dipole m̄, and electric transition quadrupole Q̄.
| (6) |
where j̄iμ(k) is the Fourier transformation of j̄iμ(r). The Dipole and magnetic dipole are available in the WS and BH hamiltonians. The linear absorption and CD are independent on the transition quadrupoles. Our test calculation with TDDFT transition quadrupoles indicated that they give only minor change to the 2DUV spectra. The transition quadrupole was thus neglected in this study.
III. TEST CALCULATIONS ON NMA AND MYOGLOBIN
To test our fluctuating exciton Hamiltonian, we have first calculated the UV absorption spectrum of NMA. NMA with its geometry optimized in gas phase at B3LYP/aug-cc-pVDZ level45 is embedded in a cubic TIP3 water box with a size of 36 × 36 × 36 Å3. The CHARMM22 force field46 is used to perform an MD simulation with the NAMD package.47 To release the internal tension, 5000 minimization steps were first performed, followed by a 200 ps heat-up at 1 fs time step from zero to 300 K. The system is then equilibrated under NPT ensemble with 1 fs timestep for 1 ns to obtain the right system density and box size. The final box size 34.88 Å is obtained by averaging the last 1000 steps of the NPT trajectory. A 4 ns NVE equilibration is then run. At this stage, the water molecules are held rigid using the SHAKE algorithm,48 and a 2 fs time step is thus used. Finally, a 1 ns trajectory is recorded by applying the NVE ensemble with a 1 fs time step. The structure is saved in 50 fs increments.
15000 snapshots of the classical MD trajectory were used to sample the distribution of couplings. The variance of Gaussian fluctuation (σ) is chosen using the bandwidth (Γ) reported in the original WS and BH Hamiltonians to fit the CD ( ). In WS, Γ = 2174.4, 3143.3, and 3743.6 cm−1 for nπ*, ππ*, and πbπ* respectively. For BH, Γ = 3137.3, 3391.8, 7582.7, and 8345.2 cm−1 for nπ*, ππ*, πbπ* and n′π* respectively. An additional homogeneous dephasing γ = 150 cm−1 is used in both models. This small value did not affect the spectra notably, but reduce the number of snapshots needed for inhomogeneous averaging. The calculated spectra are shown in Fig. 1. The broadening parameters chosen in the WS and BH Hamiltonians to fit protein CD slightly overestimate the absorption linewidth. For comparison, we also considered a model where diagonal fluctuations are neglected, but a large homogeneous dephasing with a Lorentzian lineshape is added with linewidth γ equal to Γ (the linewidth parameters in the original WS and BH models). We call the two simulations WS′ and BH′. As shown in Fig. 1, the Gaussian profile provides a better fit to experiment.
FIG. 1.
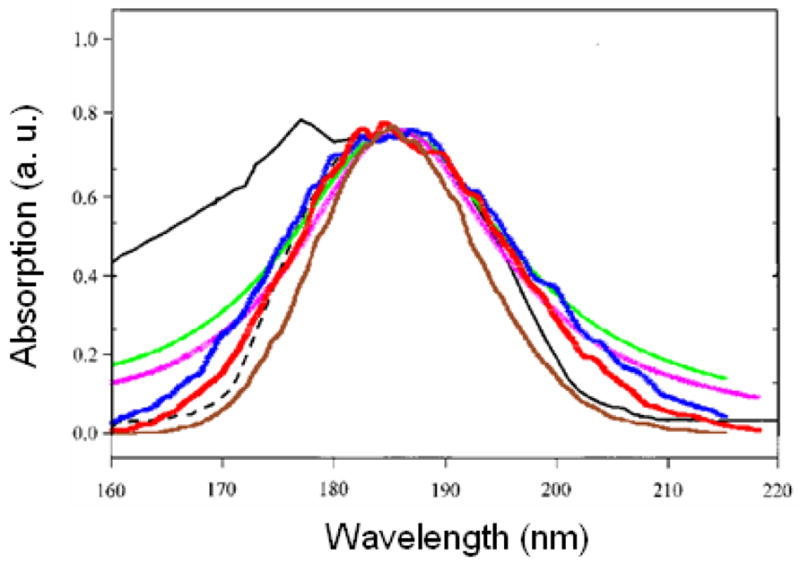
Experimental (black) UV absorption of NMA in water, and simulated spectra WS (red), BH (blue), WS′ (pink), BH′ (green), and BHM (brown). For better comparison with experiment, the WS and WS′ spectra are blueshifted by 4 nm, and the BH, BH′, and BHM spectra are blueshifted by 7 nm. The spectra are scaled to have the same peak height.
We had further tested our protocol by a CD simulation on myoglobin. The initial crystal structure was downloaded from PDB database (code: 1MBN). The MD trajectory was generated using a similar protocol used for NMA in water. 1000 snapshots were used to generate the CD spectra, shown in Fig. 2. The spectra are scaled to have the same positive peak height. Myoglobin is mainly a α-helix, and its most characteristic CD feature is the negative peak at ~220 nm. Generally, both the WS and BH hamiltonians reproduce the experimental CD. It is interesting to note that the WS hamiltonian gives a redshifted absorption but a blueshifted CD compared to experiment. The difference between WS and WS′ is very small. However, BH CD is in somewhat better than BH′.
FIG. 2.
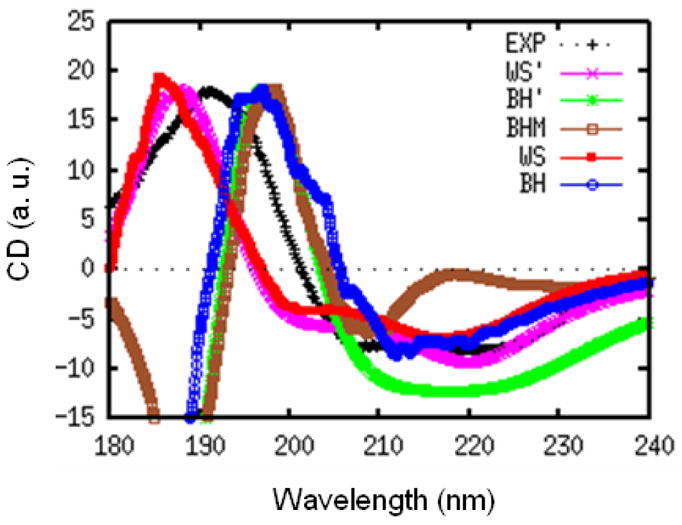
Experimental (black) and simulated CD spectra of myoglobin from WS (red), BH (blue), WS′ (pink), BH′ (green), and BHM (brown) models. All spectra are scaled to have the same positive peak height.
The positive and negative peaks in the CD spectrum can interfere, making them very sensitive to the bandwidth parameter. This is illustrated in the following simulations using the WS′ model. In Fig. 3, we plot the CD spectra of myoglobin calculated for different values of γ. Here, we set a same γ for all the three transitions in the WS hamiltonian. The characteristic 220 nm negative peak of α-helix is much weaker than experiment for γ smaller than 1000 cm−1.
FIG. 3.
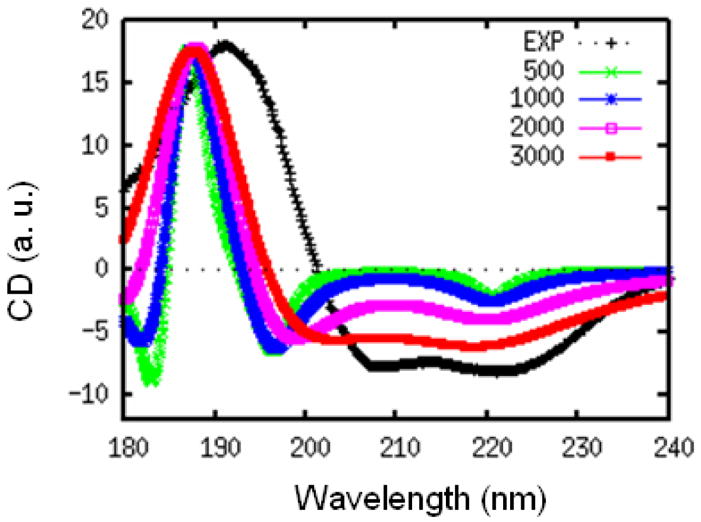
Experimental (black) and simulated WS′ CD spectra of myoglobin, with different homogeneous dephasing rates γ = 500 (green), 1000 (blue), 2000 (pink), and 3000 (red) cm−1. All spectra are scaled to have the same positive peak height.
We had also attempted to obtain diagonal fluctuations directly from the MD trajectory. In infrared spectra, electrostatic maps have been successfully used to avoid the repeated electronic structure calculations.39–44 Since in electronic transitions, the site energy strongly depends on the geometric parameters,38 we constructed a TDDFT map which depends on the external electric field as well as the geometry of NMA.
| (7) |
where EX is the electric field at atom X, ξn are geometric parameters (C-O and C-N bond length, C-O-N angle, or O-C-N-H dihedral angle), and ξ̄n is the corresponding mean value in the MD trajectory. Fluctuations calculated from this map along the trajectory were then added to the BH hamiltonian, we call this model BH-Map (BHM). This map gives slightly narrower linewith compared to experiment (Fig. 1). BHM CD is almost identical to BH for the positive ππ* peak, but its nπ* negative peak is too small comparing to experiment (Fig. 2). An additional effort will be required to improve the map.
IV. UV SPECTRA OF A 17-RESIDUE POLYPEPTIDE
A. Linear spectra: absorption and CD
UV spectra were simulated for a 17-residue α-helix polypeptide Ac-YA2KA4KA4KA2H-NH2 (YKKKH17) in water. A similar MD simulation strategy as described for NMA in water was used, and the initial geometry is taken from a previous study.43 In Fig. 4, we plot the resulting distributions of intra-chromophore and inter-chromophore couplings. The WS and BH hamiltonians yield different distributions for couplings between nπ* and ππ* transitions on the same peptide. Both can be fitted to a Gaussian, with mean values of 231 (34.6) cm−1 and variance σ = 143.5 (77.0) cm−1 for WS (BH). The WS hamiltonian predictes a much larger intra-chromophore nπ*-ππ* couplings compared to BH. The nearest neighbor inter-chromophore ππ* couplings for the two hamiltonians are very similar, but have a non-Gaussian distribution. Both show a long tail at the lower couplings. The variance of nearest neighbor inter-chromophore ππ* coupling is 160 cm−1.
FIG. 4.
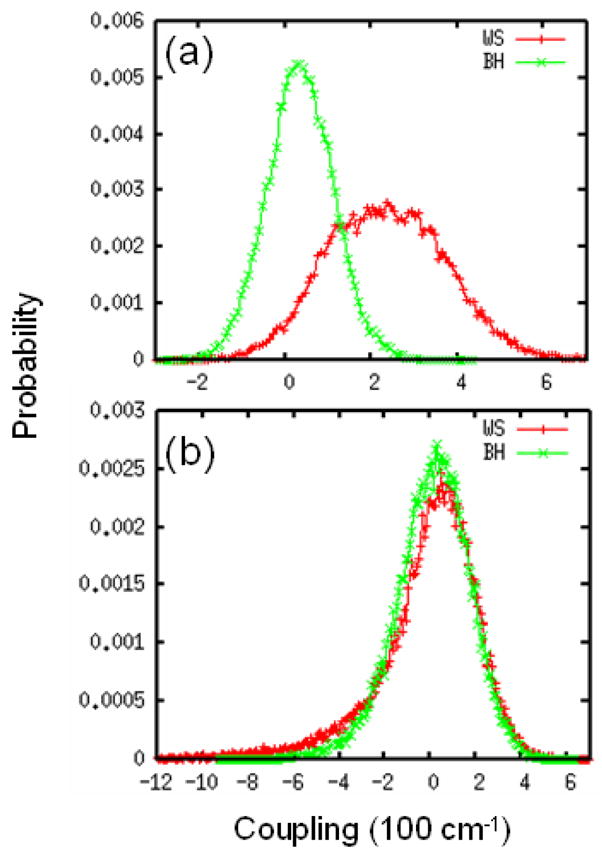
Distributions of coupling for WS (red) and BH (green) hamiltonians. (a) coupling between the nπ* and ππ* transitions on the same peptide. (b) coupling between ππ* transitions of nearest-neighbor peptides.
The calculated linear absorption and CD are displayed in Fig. 5. 2000 snapshots are used in inhomogeneous averaging. As in NMA, the absorption shows a single broad peak. The CD spectra of YKKKH17 are very similar to myoglobin, with a strong positive peak at about 190–200 nm, and a weaker negative peak at 220 nm. Exciton decomposition was calculated by adding the squares of the eigenstate coefficients for different transitions. This is shown the top panel of Fig. 5. It indicates that the positive CD peak mainly comes from the ππ* transitions, and the negative one comes from the nπ* transitions and tail of the ππ* transitions. We notice a contribution from πbπ* transition at the blue end of the spectra for the BH hamiltonian, but not for WS, where the intra-chromophore ππ*-πbπ* coupling is neglected.
FIG. 5.
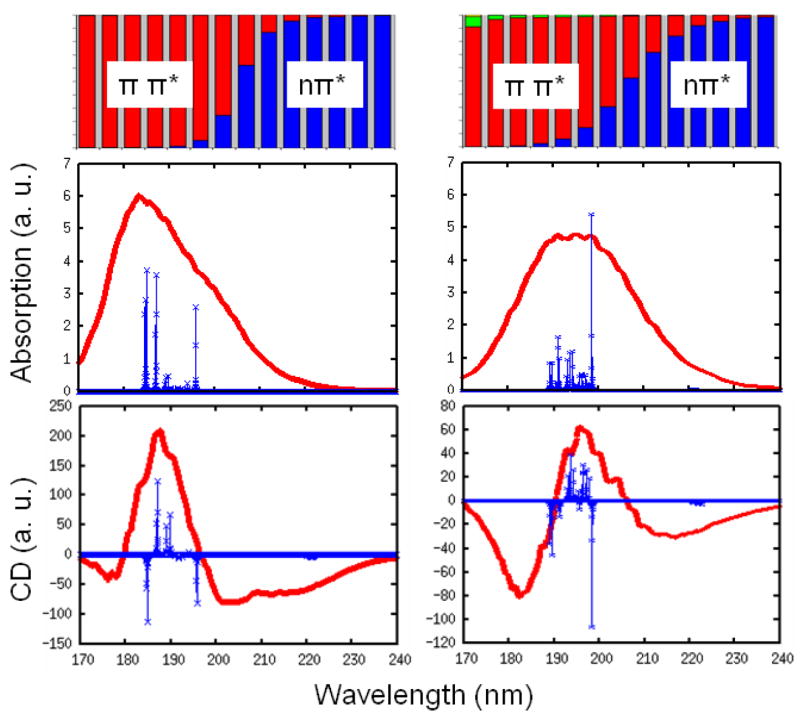
Top: wavelength-dependent exciton decomposition for YKKKH17 to different transitions nπ* blue), ππ* (red), πbπ* (green), and n′π* (yellow). Linear absorption (middle) and CD (bottom) from WS (left) and BH (right) models. Stick spectra (green) is obtained from a single snapshot with γ = 5 cm−1.
We also show the stick spectra for absorption and CD in Fig. 5, obtained using γ = 5 cm−1 in the WS and BH hamiltonians without fluctuations for the snapshot at the middle of the trajectory. The nπ* and ππ* transitions are now well separated, and the ππ* is much stronger than the nπ* band. The WS and BH hamiltonians show different patterns for the ππ* transition band. For the WS hamiltonian, the states at both the red and the blue band edge are much stronger than mid-band states. However, BH shows no strong blue edge states in the ππ* transition band. The difference between the two hamiltonians as seen in the stick spectra is mashed in the absorption and CD by the large broadening. By checking the eigenvectors, we find that the strong red edge state for both WS and BH hamiltonians is an in-phase linear combination of the ππ* transitions of all peptides, implying that this state is delocalized over the entire polypeptide.
To explore the degree of exciton localization, we have examined the corresponding participation ratios (PR).52 Considering an eigenstate e, whose wavefunction is a superposition of localized states on the i’th peptide unit with coefficients ψei, its PR is defined as We = (Σ|ψei|4)−1. For a localized states, We = 1, whereas when the state e is completely delocalized, and ψem has equal contributions from all the n local models, We = n. Here, the localized basis set runs over all excited states μ on the same peptide, i. e. . The PR of the strong red-edge ππ* state in WS and BH stick spectra is 12.4 and 9.9 respectively.
Fig. 6 shows the PR distribution (PRD) of eigenstates in a given frequency range (± 500 cm−1 binning was used) for the WS and BH models. As expected, the states become more localized with disorder. The largest average PR is about 3.0 at 53000 cm−1, which should be mainly due to the ππ* transition. The ππ* states also have a larger standard deviation of PR. Although the PRD suggest that ππ* states are more delocalized than nπ*, a more rigorous measure is provided by sensitivity analysis (SA).15 The basic idea is to introduce a small perturbation to the energies of a specific transition, e.g. nπ*, in Hamiltonian. The sensitivity signal (SAS) is then given by the absolute value of the difference between the PRD of the perturbed and unperturbed systems. nπ* SAS is mainly distributed in the low-frequency regime, which have low PR in PRD. The high-frequency part with higher PR is mainly from ππ*. This can also be illustrated by PR-dependent exciton decomposition, which clearly shows that in high PR range, the ππ* dominates. Combining the PRD, SAS, and exciton decomposition, we conclude that the main reason for the difference of the exciton coherence length between WS and BH hamiltonians is that nπ* is more delocalized in the latter.
FIG. 6.
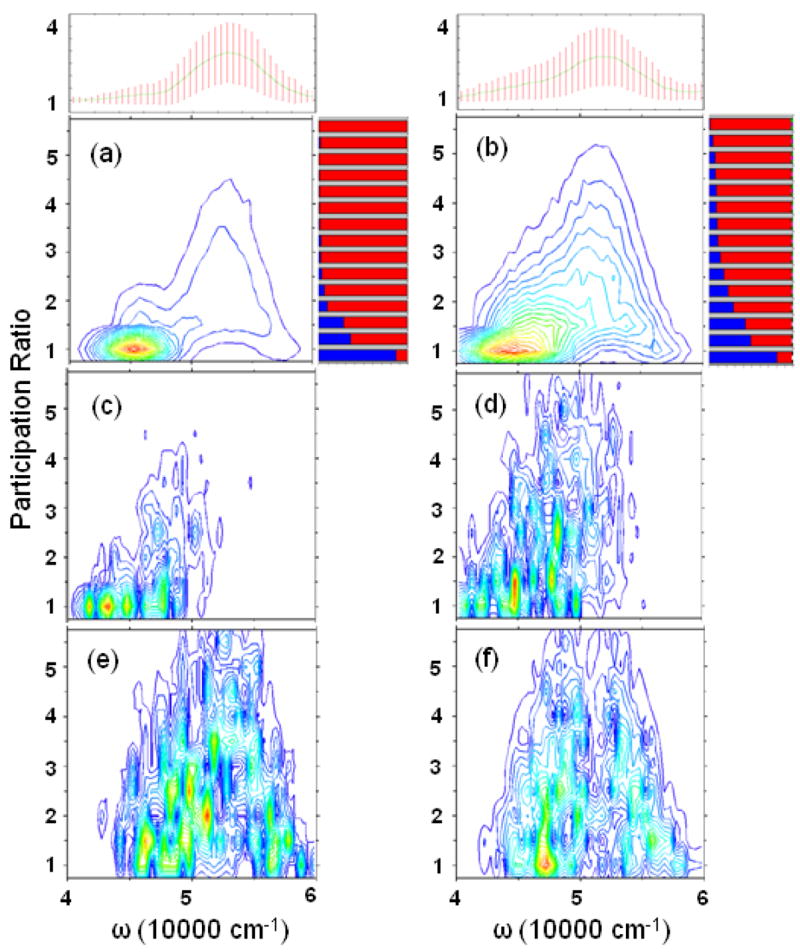
The exciton Participation Ratio distribution (PRD) binned over frequency for (a) WS and (b) BH hamiltonians. Top marginal: the mean PR (line) and standard deviation (bars). Right marginal: the PR-dependent exciton decomposition to different transitions, with the same color scheme as in Fig. 5. Sensitivity analysis for nπ* transitions for (c) WS and (d) BH hamiltonians. (e) and (f) are for ππ*.
B. 2DUV spectra
A 2D experiment uses three pulses with wavevectors k1, k2, and k3, which interact with the protein to generate a coherent signal in one of the direction ks = ±k1 ± k2 ± k3. There are three time delays (t1, t2, and t3) between the three incoming pulses and the signal pulse. We will focus on the photon echo (PE) signal generated in the phase matching direction (kI = −k1 + k2 + k3), and set t2 = 0. 2D correlation plots of the signals are plotted as Fourier transforms with respect to t1 and t3. (Eq. 17 of Ref.49) Different polarization and wavevector configurations are denoted by μ4μ3μ2μ1(α4α3α2α1), where μi is the polarization direction of field i and αi is its wavevector direction. ᾱ means minus α direction.
Simulations were performed with the NEE method50 as implemented in the SPECTRON code. To speed up the calculation, a truncation has been applied to the NEE scattering matrix,43 with cutoff parameter η = 0.54, which does not distort the spectrum. The simulated xxxy(zzzz) component of 2DPE spectra from 8000 snapshots are depicted in Fig. 7.
FIG. 7.
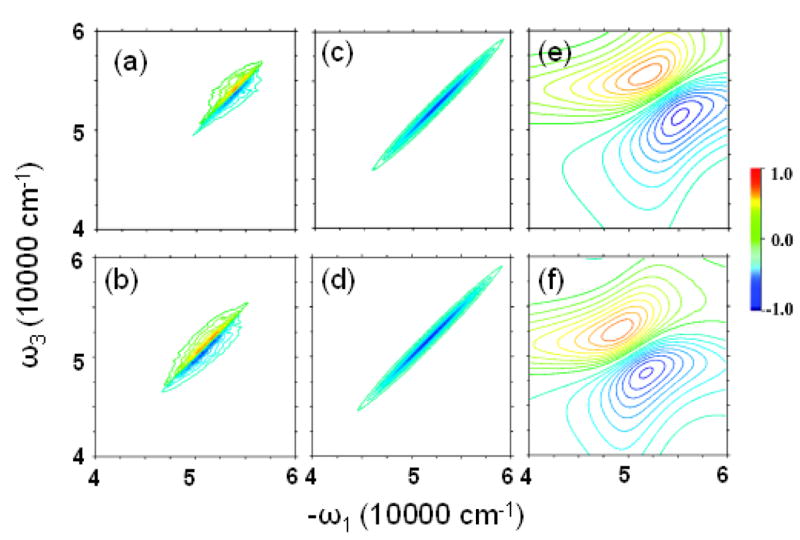
Imaginary part of xxxx(zzzz) 2DPE spectrum from (a) WS and (b) BH, from (c) WS and (d) BH models with the couplings turned off, and from (e) WS′ and (f) BH′.
As shown in the previous section, the couplings (a few hundred cm−1) are relatively small compared to the site energy fluctuations (more than 2000 cm−1). To see the signatures of couplings in the 2DUV spectra, in the middle panels of Fig. 7, we display the spectra with coupling turned off. The very different spectra indicate that the 2DUV spectra are very sensitive to the coupling. Cross peaks do exist, although they are very close to the diagonal line since couplings are weak. The homogeneous WS′ and BH′ models (right column) also give very different 2DUV.
In the nonchiral xxxy(zzzz) 2DPE, we get similar spectra for WS and BH hamiltonians. Upon closer examination, we can see some differences. In Fig. 8, we cut the strongest peak magnitude at 20%. We see that in the BH model, we have an additional cross peak at the right-bottom corner.
FIG. 8.
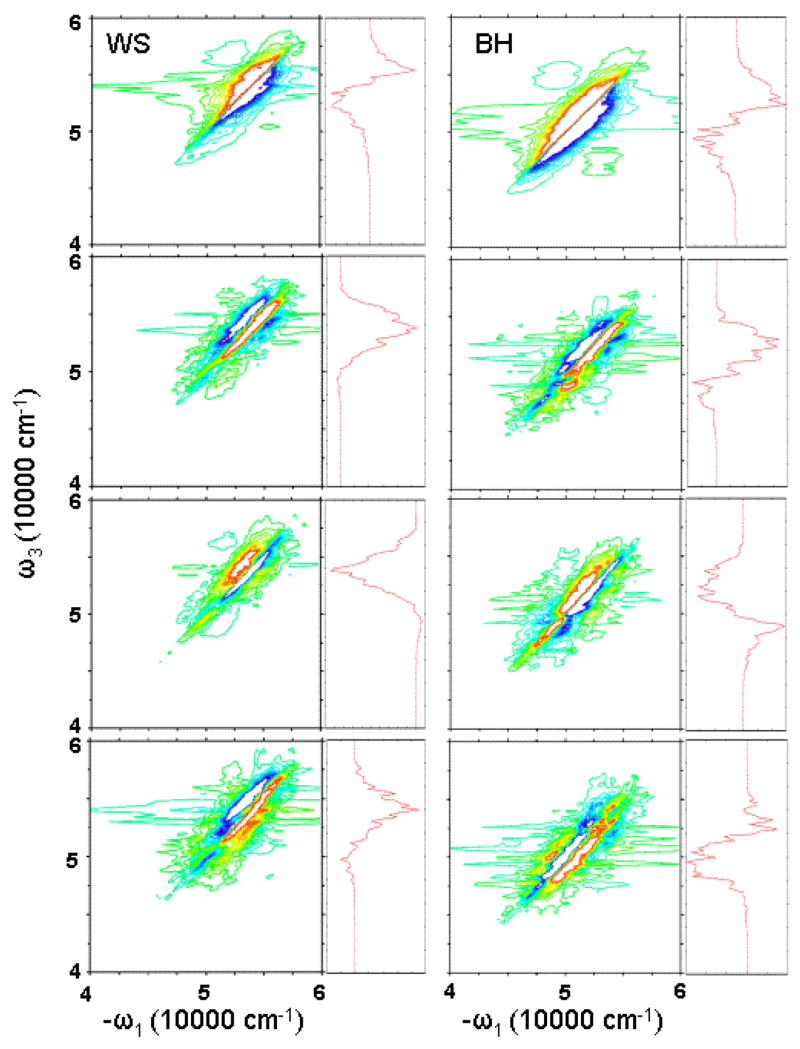
Simulated 2D photon echo signals. Left column: WS model; right column: BH model. From top to bottom, imaginay part of xxxx(zzzz), and real part of xxxy(zzzz), xxxy(zyy¯z¯), and xxyz(zzxx). Maximum peak is truncated at 20% to better show the weaker feartures. Right marginals: diagonal cut of the 2D spectra. The same color scale is used as in Fig. 7.
Chirality induced (CI) components of 2DPE show larger differences between WS and BH hamiltonians. For the xxxy(zzzz) component, BH gives additional feature around 48000 cm−1. This can be clearly seen from the diagonal spectra. The WS diagonal spectrum gives only a very weak negative peak, but the BH diagonal spectrum shows a notable negative feature. For xxxy(zyy¯z¯) component, BH model gives some additional positive features. For xxyz(zzxx), the difference between WS and BH models is even larger. Both WS and BH models give a three-strip pattern, but the WS pattern is negative-positive-positive, while the BH pattern is positive-negative-positive. Therefore, the diagonal cut of WS spectrum is primarily positive, and the BH diagonal spectrum is negative.
In the visible and IR region, γ and σ are of the same order. However, in the UV region, inhomogeneous disorder is much larger than the homogeneous dephasing rate (σ ≫ γ), which makes the 2DPE spectra narrow along the diagonal line. This is different from our previous calculation,49 which used a much larger dephasing γ. At the same time, in both WS and BH hamiltonians, the disorder is also much larger than coupling. Therefore, all crosspeaks are closely packed near the diagonal peak. We notice that, in the current two model hamiltonians, the coupling between the nearest peptides is also considered by electrostatic interaction. A more realistic nearest-neighbor coupling model may predict a larger nearest-neighbor coupling, and the cross peaks may be shifted from the diagonal peaks, and better resolved.
V. CONCLUSIONS
2D spectra of two effective electronic model Hamiltonians for protein backbone nπ* and ππ* electronic excitation were compared. Off-diagonal fluctuations are introduced by an MD trajectory, supplemented with diagonal fluctuations by Gaussian random distribution. The signatures of fluctuations in two dimensional techniques are studied. Stick spectra show that the two hamiltonians have different exciton structures, but this difference is obscured by the broad linewidth. Our results demonstrate that 2DUV, especially CI 2DPE, gives additional information, and may test the quality of different Hamiltonians. Different model hamiltonians, which agree for linear UV techniques (absorption and CD), may be distinguished by the 2D spectra.
Acknowledgments
This work was supported by the National Institutes of Health Grant 2RO1-GM59230-05 and the National Science Foundation Grant CHE-0446555. We thank Professor Robert W. Woody and Professor Jonathan D. Hirst for providing us the latest version of their Hamiltonian parameters, and Professor Woody for the helpful discussions. This paper is dedicated to Douwe Wiersma for his pioneering work on developing coherent nonlinear spectroscopy in the condensed phase.
Footnotes
Publisher's Disclaimer: This is a PDF file of an unedited manuscript that has been accepted for publication. As a service to our customers we are providing this early version of the manuscript. The manuscript will undergo copyediting, typesetting, and review of the resulting proof before it is published in its final citable form. Please note that during the production process errors may be discovered which could affect the content, and all legal disclaimers that apply to the journal pertain.
References
- 1.Nakanishi K, Berova N, Woody RW. Circular Dichroism Principles and Applications. VCH; New York: 1994. [Google Scholar]
- 2.Fasman GD. Circular Dichroism and the Conformational Analysis of Biomolecules. Plenum; New York: 1996. [Google Scholar]
- 3.Lednev IK, Karnoup AS, Sparrow MC, Asher SA. J Am Chem Soc. 1999;121:8074. doi: 10.1021/ja003381p. [DOI] [PubMed] [Google Scholar]
- 4.Lednev IK, Karnoup AS, Sparrow MC, Asher SA. J Am Chem Soc. 1001;123:2388. doi: 10.1021/ja003381p. [DOI] [PubMed] [Google Scholar]
- 5.Asher SA, Mikhonin A, Bykov S. J Am Chem Soc. 2004;126:8433. doi: 10.1021/ja049518j. [DOI] [PubMed] [Google Scholar]
- 6.Ahmed Z, Beta IA, Mikhonin AV, Asher SA. J Am Chem Soc. 2004;127:10943. doi: 10.1021/ja050664e. [DOI] [PubMed] [Google Scholar]
- 7.Mikhonin AV, Asher SA. J Am Chem Soc. 2006;128:13879. doi: 10.1021/ja062269+. [DOI] [PubMed] [Google Scholar]
- 8.Mukamel S. Principles of Nonlinear Optical Spectroscopy. Oxford University Press; New York: 1995. [Google Scholar]
- 9.Hesselink WH, Wiersma DA. Chem Phys Lett. 1978;56:227. [Google Scholar]
- 10.Nibbering ETJ, Wiersma DA, Duppen K. Chem Phys. 1994;183:167. [Google Scholar]
- 11.Tanimura Y, Mukamel S. J Chem Phys. 1993;99:9496. [Google Scholar]
- 12.Asplund MC, Zanni MT, Hochstrasser RM. Proc Natl Acad Sci USA. 2000;97:8219. doi: 10.1073/pnas.140227997. [DOI] [PMC free article] [PubMed] [Google Scholar]
- 13.Mukamel S. Ann Rev Phys Chem. 2000;51:691. doi: 10.1146/annurev.physchem.51.1.691. [DOI] [PubMed] [Google Scholar]
- 14.Asbury JB, Steinel T, Stromberg C, Gaffney KJ, Piletic IR, Goun A, Fayer MD. Phys Rev Lett. 2003;91:237402. doi: 10.1103/PhysRevLett.91.237402. [DOI] [PubMed] [Google Scholar]
- 15.Zhuang W, Abramavicius D, Mukamel S. Proc Natl Acad Sci USA. 2005;102:7443. doi: 10.1073/pnas.0408781102. [DOI] [PMC free article] [PubMed] [Google Scholar]
- 16.Moffitt W. J Chem Phys. 1956;120:10938. [Google Scholar]
- 17.Woody RW. J Chem Phys. 1968;49:4797. doi: 10.1063/1.1669962. [DOI] [PubMed] [Google Scholar]
- 18.Bayley PM, Nielsen EB, Schellman JA. J Phys Chem. 1969;73:228. doi: 10.1021/j100721a038. [DOI] [PubMed] [Google Scholar]
- 19.Applequist J, Sundberg KR, Olson ML, Weiss LC. J Chem Phys. 1979;70:1240. [Google Scholar]
- 20.Bode KA, Applequist J. J Phys Chem. 1996;100:17825. [Google Scholar]
- 21.Kurapkat G, Kruger P, Wollmer A, Fleischhauer J, Kramer B, Zobel E, Koslowski A, Botterweck H, Woody RW. Biopolymers. 1997;41:267. doi: 10.1002/(SICI)1097-0282(199703)41:3<267::AID-BIP3>3.0.CO;2-Q. [DOI] [PubMed] [Google Scholar]
- 22.Bode KA, Applequist J. J Am Chem Soc. 1998;120:10938. [Google Scholar]
- 23.Hirst JD. J Chem Phys. 1998;109:782. [Google Scholar]
- 24.Woody RW, Sreerama N. J Chem Phys. 1999;111:2844. [Google Scholar]
- 25.Hirst JD, Besley NA. J Chem Phys. 1999;111:2846. [Google Scholar]
- 26.Besley NA, Hirst JD. J Am Chem Soc. 1999;121:9636. [Google Scholar]
- 27.Rogers DM, Hirst JD. J Phys Chem A. 2003;107:11191. [Google Scholar]
- 28.Oakley MT, Bulheller BM, Hirst JD. Chirality. 2006;18:340. doi: 10.1002/chir.20264. [DOI] [PubMed] [Google Scholar]
- 29.Oakley MT, Hirst JD. J Am Chem Soc. 2006;128:12414. doi: 10.1021/ja0644125. [DOI] [PubMed] [Google Scholar]
- 30.Frelek J, Kowalska P, Masnyk M, Kazimierski A, Korda A, Woznica M, Chmielewski M, Furche F. 2007 doi: 10.1002/chem.200700127. private communication. [DOI] [PubMed] [Google Scholar]
- 31.Kaya K, Nakagura S. Theor Chim Acta. 1967;7:117. [Google Scholar]
- 32.Clark LB. J Am Chem Soc. 1995;117:7974. [Google Scholar]
- 33.Nielsen EB, Schellman JA. J Phys Chem. 1967;71:2297. doi: 10.1021/j100866a051. [DOI] [PubMed] [Google Scholar]
- 34.Nitzsche LE, Davidson ER. J Am Chem Soc. 1978;100:7201. [Google Scholar]
- 35.Serrano-Andres L, Fulscher MP. J Am Chem Soc. 1996;118:12190. [Google Scholar]
- 36.Hirst JD, Hirst DM, Brooks CL. J Phys Chem A. 1997;101:4821. [Google Scholar]
- 37.Besley NA, Hirst JD. J Phys Chem A. 1998;102:10791. [Google Scholar]
- 38.Besley NA, Oakley MT, Cowan AJ, Hirst JD. J Am Chem Soc. 2004;126:13502. doi: 10.1021/ja047603l. [DOI] [PubMed] [Google Scholar]
- 39.Ham S, Kim JH, Lee H, Cho MH. J Chem Phys. 2003;118:3491. [Google Scholar]
- 40.Schmidt JR, Corcelli SA, Skinner JL. J Chem Phys. 2004;121:8887. doi: 10.1063/1.1791632. [DOI] [PubMed] [Google Scholar]
- 41.Hayashi T, Zhuang W, Mukamel S. J Phys Chem A. 2005;109:9747. doi: 10.1021/jp052324l. [DOI] [PubMed] [Google Scholar]
- 42.Jansen TlC, Dijkstra AG, Watson TM, Hirst JD, Knoester J. J Chem Phys. 2006;125:44312. doi: 10.1063/1.2218516. [DOI] [PubMed] [Google Scholar]
- 43.Zhuang W, Abramavicius D, Hayashi T, Mukamel S. J Phys Chem B. 2006;110:3362. doi: 10.1021/jp055813u. [DOI] [PMC free article] [PubMed] [Google Scholar]
- 44.Jansen TlC, Knoester J. J Chem Phys. 2006;124:44502. doi: 10.1063/1.2148409. [DOI] [PubMed] [Google Scholar]
- 45.Frisch MJ, et al. Gaussian 03, Rev C.02. Gaussian, Inc; Wallingford CT: 2004. [Google Scholar]
- 46.MacKerell AD, et al. J Phys Chem B. 1998;102:3586. doi: 10.1021/jp973084f. [DOI] [PubMed] [Google Scholar]
- 47.Phillips JC, Braun R, Wang W, Gumbart J, Tajkhorshid E, Villa E, Chipot C, Skeel RD, Kale L, Schulten K. J Comput Chem. 2005;26:1781. doi: 10.1002/jcc.20289. [DOI] [PMC free article] [PubMed] [Google Scholar]
- 48.Vangunsteren WF, Berendsen HJC. Mol Phys. 1977;34:1311. [Google Scholar]
- 49.Abramavicius D, Zhuang W, Mukamel S. J Phys B: At Mol Opt Phys. 2006;39:5051. [Google Scholar]
- 50.Mukamel S, Abramavicius D. Chem Rev. 2004;104:2073. doi: 10.1021/cr020681b. [DOI] [PubMed] [Google Scholar]
- 51.Pajcini V, Asher SA. J Am Chem Soc. 1999;121:10942. [Google Scholar]
- 52.Thouless D. Phys Rep. 1974;13:93. [Google Scholar]


