Abstract
Total knee replacement effectively relieves arthritis pain but improvement in physical function varies. A clearer understanding of the patient attributes associated with differing levels of functional gain after TKR is critical to surgical decision making. We reviewed 8050 primary, unilateral TKR patients enrolled in a prospective registry between 2000 and 2005 who had complete data. We evaluated associations between 12-month function (SF12/PCS) and preoperative gender, age, BMI, emotional health (MCS), knee diagnosis, quadriceps strength, and physical function (PCS). More than 98% of patients reported pain relief (KS pain score). At 12 months, mean PCS gain was 13.6 points, but the distribution was bimodal. The mean gain in PCS in the 63% of patients with greater improvement was 21 (SD = 7), and 4.1 (SD = 7) in the remaining 37%. Increased likelihood of poor functional gain was associated with older age, body mass index (BMI) over 40, lower MCS, and poor quadriceps strength. While two-thirds of patients reported functional gain well above national average at 12 months post-TKR, 37% reported limited functional improvement. Further understanding of the patient attributes associated with limited improvement will guide the design of innovative strategies to improve functional outcomes.
Level of Evidence: Level II, prognostic study. See the Guidelines for Authors for a complete description of levels of evidence.
Introduction
As the U.S. population ages and grows increasingly overweight, more men and women will suffer from advanced knee osteoarthritis (OA) and its associated pain and disability. The risk of disability due to knee OA is greater than any other medical condition among elderly people and Healthy People 2010 estimates 27% of adults with chronic joint symptoms limit their activities due to their arthritis [4, 5, 15]. Increasing numbers of adults with knee arthritis choose total knee replacement (TKR) to relieve pain and improve function. In the past decade, TKR utilization has increased annually so that in 2003 almost $10 billion was spent on more than 360,000 primary TKR procedures. Based on current practices, TKR utilization is projected to increase an additional 673% by 2030 due to the increasing prevalence of knee arthritis among an aging population and the procedure’s proven effectiveness [16].
TKR provides pain relief and, on average, improves function at 6 and 12 months postsurgery for patients with advanced knee OA [13]. In a community-based study across hundreds of surgeons’ practices, the Patient Outcomes Research Team (PORT) on TKR suggested patients reported overall improvement in pain and physical function and high satisfaction with surgical outcome 2 to 7 years post-TKR [11].
However, substantial variability in functional gain after TKR persists. Despite excellence in surgical technique and consistent pain relief, variation exists in the degree of functional improvement at 6 and 12 months. An estimated 15% to 30% of patients report minimal functional improvement at 12 months, while another 10% report functional gains up to three times the national average [1, 2, 13]. This post-TKR functional variation is not explained by persistent knee pain or poor preoperative function [8].
The 2003 NIH Consensus Panel called for research to evaluate “patient-level factors affecting outcomes after surgery, including medical and sociodemographic characteristics,” such as age, gender, BMI, and emotional health at time of TKR and the contribution of these attributes to the variation in functional improvement 12 months after surgery. To assure optimal patient referral and patient preparation, it is important to understand which pre-TKR patient attributes are associated with large and small post-TKR functional improvements [19].
The variation in function at 1 year after TKR prompted the question: are patient attributes prior to surgery associated with varied functional outcomes? In particular, do TKR patient age, gender, body mass index, and emotional health predict the level of 12-month functional outcome?
Materials and Methods
A national registry of TKR patients collected demographic and preoperative clinical characteristics, surgeon assessment, surgical technique, and patient-reported outcomes at 12 months after TKR, including pain (Knee Society score) and physical function (PCS, SF-12). The data were collected using standardized, structured data collection forms. All orthopaedic surgeons who use Zimmer (Warsaw, IN) NexGen knee components were invited to participate in the registry. A de-identified copy of registry data was provided to this research team.
All U.S. patients entered into the registry between 2000 and 2005 were considered for inclusion in this analysis. Registry patients were excluded from the study if any of the following conditions existed: operative knee diagnosis included fracture, malignancy, infection, or failure of a previous TKR; operative code for revision or bilateral TKR; emergently scheduled surgery; or any known postoperative complications including infection and deep venous thrombosis. The large number of patients (17,270) and orthopaedists (171) participating in this registry is unprecedented. Our analysis included the subset of patients that had complete 1-year outcome data. Thus, we compared the demographic and clinical attributes of the analytic subset to the total registry cohort and normative patient populations prior to analysis.
Of the 8050 patients included in this analysis, 66% were female. The average age was 68 years (SD = 10) and mean BMI was 32 (SD = 7.1). Patients were divided into three BMI groups: less than 30, 30 to 40, and over 40, and three age groups: 65 years or younger, 66 to 80 years, and older than 80 years of age. More than 70% of patients reported Caucasian race, while 353 (4%) were African American and 271 (3%) were Hispanic patients. Ninety-five percent had a primary knee diagnosis of osteoarthritis. The mean KSS pre-TKR pain score was 37 (SD = 16) and post-TKR KSS was 80 (SD = 15). Prior to TKR, 54% reported moderate or severe pain at rest and 92% reported moderate/severe pain when walking. Seventy-seven percent could walk less than five blocks prior to TKR. Thirty percent of surgeons submitted more than 20 cases per year and 78% of all cases were treated by these high-volume surgeons. The surgeons represented 31 states and 224 hospitals with 59% of hospitals reporting more than 50 TKR cases per year (Appendix 1).
To assess the external generalizability of the data from the subset of patients with complete information included in this report, the demographic characteristics and preoperative clinical and functional measures of patients with complete 12-month data (n = 8050) were compared to: (1) all patients in the registry; (2) participants in the AHRQ-funded TKR Patient Outcome Research Team (PORT) study; and (3) a comprehensive single-site registry where 100% of patients were included (Appendix 1). The analyses support that the participants and outcomes are similar across the samples, suggesting the study cohort is representative of current TKR patients in the United States. Descriptive statistics for all relevant outcomes included means, standard derivations, minimum, median, maximum, and quartiles for continuous or count variables, frequencies, rates or proportions for categorical (binomial, multinomial, and ordinal). We then examined the variation in outcomes of interest using distributions and scatter plots. Prior to TKR, the function score distributions were consistently unimodal with no suggestion that two distinct subgroups—patients with low and high functional gain—would emerge at 12 months post-TKR. However, the 12 month function (PCS) score distribution was bimodal. We used multivariate mixture models to determine if we could predict which subgroup of patients would have low or high functional gain 12 months after surgery. We modeled these patient groups as two latent classes by fitting a mixture model of two normal distributions (Appendix 2). The model included patient baseline predictors of post-TKR functional gain as covariates, including gender, age at surgery, BMI, MCS and PCS, osteoarthritis diagnosis, and poor quadriceps strength prior to TKR.
Results
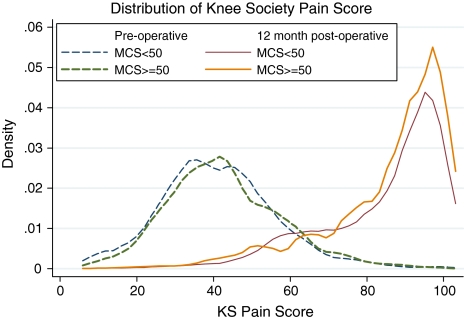
The mean post-TKR KSS pain score improved to 80 (SD = 15) from a preoperative mean of 37 (SD = 16), and the KSS pain score improved from pre- to 12 months post-TKR for 98% of all patients. Among these, 80% of patients reported pain relief greater than 32 points on the KSS pain score (or 2 SD of baseline score), and 92% reported a greater than 16-point improvement in KS pain score (1 SD of baseline score). Slightly over 2% of patients reported increased pain. Both preoperatively and at 1 year postoperatively, pain scores were normally distributed and demonstrated mean improvement (Fig. 1).
Fig. 1.
Pain distributions before TKR and at 12-months post-TKR are similar in patients with high and low emotional health.
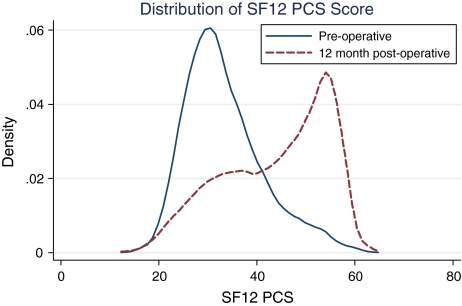
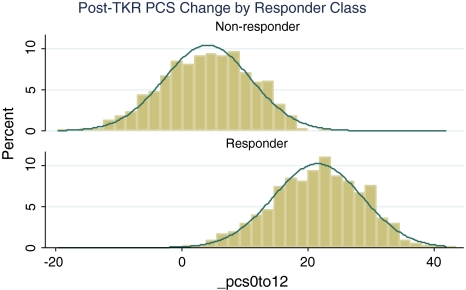
In contrast, improvement in functional status (SF12, PCS) was more variable. Prior to surgery, PCS was normally distributed with a mean of 30 (SD = 7.8; range, 11–60). The 12-month post-TKR PCS distribution illustrated an overall average improvement of 13.6 points. However, the 12-month post-TKR PCS distribution was bimodal with mean improvement of 22 points in the largest group (63% of patients) (SD = 7; range, 0.5–41.8) and 4.1 points in the remaining 37% (SD = 6.8; range, −19.7 to 22.5). This bimodal distribution can be overlooked by simply reporting the mean improvement in function (Fig. 2).
Fig. 2.
Pre-TKR physical function (SF12/PCS) distribution is unimodal while the 12-month post-TKR physical function distribution is bimodal.
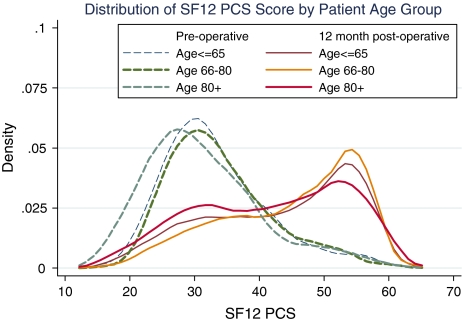
Prior to surgery, the function scores for the three age groups had a unimodal distribution with the over-80-year-olds reporting lower modal function than the younger groups. At 12 months postsurgery, the mode function score exceeded 50 for all age groups (Fig. 3). However, the proportion of patients reaching this level of function declined as the age group increased. In addition, the post-TKR distributions were bimodal across the age groups.
Fig. 3.
Twelve-month post-TKR function distributions vary by age group and the oldest age group is associated with greatest functional variation.
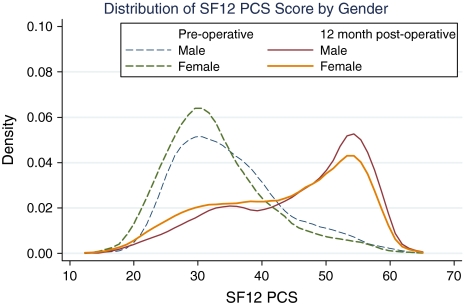
We observed no notable gender difference in the shape of the pre- and postoperative functional outcome distributions. However, the female pre- and post-TKR function distributions are to the left (lower function) of the male distributions (Fig. 4).
Fig. 4.
Pre-TKR and12-month post-TKR function distributions do not vary by gender.
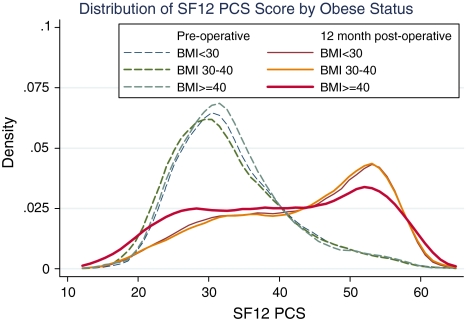
The post-TKR function score (SF12/PCS) distributions for all BMI groups were bimodal with flat distributions. Patients with a BMI less than 30 and those between 30 and 40 had identical post-TKR distributions and reported improvement in PCS (SF12) at 12 months. However, more patients with BMI over 40 reported 1-year PCS scores (SF36 function) less than 30 (Fig. 5).
Fig. 5.
Twelve-month post-TKR function distributions vary by body mass index (BMI) and the highest BMI values are associated with greatest functional variation.
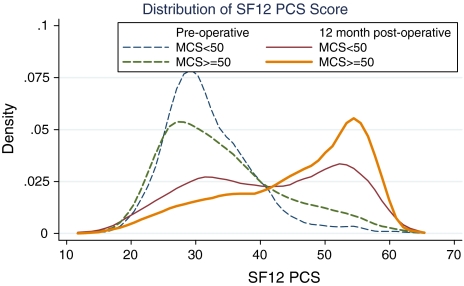
Preoperative function distributions for both lower and higher emotional health patients were unimodal. However, 12 months after TKR, patients with poorer emotional health before TKR (SF12/MCS < 50) had a wide, flat bimodal distribution and the majority of patients had a 12-month PCS under 40. In contrast, the PCS mode for patients with higher pre-TKR emotional health (MCS ≥ 50) was greater than 50 (Fig. 6).
Fig. 6.
Twelve-month post-TKR function distributions vary by emotional health (SF12 MCS) and lower emotional health is associated with greatest functional variation.
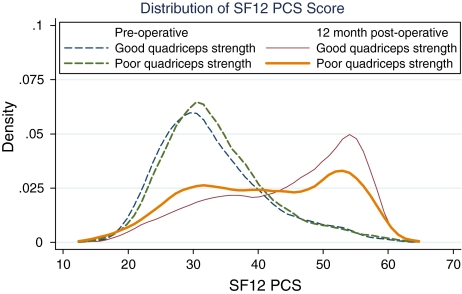
While preoperative function was similar for patients with both good and poor quadriceps strength, the 12-month function distributions differed. More patients with poor quadriceps strength had 12-month PCS scores less than 30 than patients with good pre-TKR strength (Fig. 7).
Fig. 7.
Twelve-month post-TKR function distributions—poor quadriceps strength is associated with low functional outcome.
Age, BMI, baseline MCS and PCS, and poor or fair quadriceps strength predicted the low function responder group (Table 1). We plotted the 12-month PCS change distributions of the two groups of patients (Fig. 8). Thus, using mixture models, we distinguished the “predicted high functional gain” (mean PCS improvement at 12 months post-TKR = 21 points; SD = 7) from the “predicted low functional gain” (mean pre-post PCS gain = 4 points; SD = 7). Higher odds of less functional gain were associated with BMI over 40, lower preoperative MCS, each 5-year increase in age, poor or fair quadriceps strength, and non-OA diagnosis. Patients with BMI over 50 and poor quadriceps strength had more than 2:1 odds of poor functional gain after TKR.
Table 1.
Latent class multivariate mixture model for 12-month post-TKR change in physical function (SF12/PCS)
Predictors 
|
 |
95% Conf. Interval | P > z | |
|---|---|---|---|---|
| Lower | Upper | |||
| Male | 0.638 | 0.050 | 1.225 | 0.033 |
| Age (+1 year) | −0.031 | −0.065 | 0.003 | 0.073 |
| BMI < 30 | Ref. | |||
| BMI 30–39 | −1.068 | −1.689 | −0.447 | 0.001 |
| BMI 40–49 | −1.632 | −2.576 | −0.689 | 0.001 |
| BMI ≥ 50 | −1.857 | −4.310 | 0.597 | 0.138 |
| Baseline MCS | 0.038 | 0.009 | 0.066 | 0.010 |
| Baseline PCS | −0.844 | −0.903 | −0.784 | 0.000 |
| Osteoarthritis | 2.610 | 1.222 | 3.998 | 0.000 |
| Poor quadriceps strength | −1.763 | −4.729 | 1.204 | 0.244 |
| Constant | 25.6 | 22.5 | 28.8 | 0.000 |
| Probability estimates: low functional responders | ||||
Predictors 
|
Odds ratio 
|
95% Conf. Interval | ||
| Lower | Upper | |||
| Age (+1 year) | 1.01 | 1.00 | 1.02 | |
| BMI ≥ 50 kg/m2 | 2.33 | 1.09 | 4.99 | |
| Baseline MCS | 0.95 | 0.94 | 0.96 | |
| Baseline PCS | 0.91 | 0.89 | 0.92 | |
| Fair quadriceps strength | 1.34 | 1.02 | 1.75 | |
| Poor quadriceps strength | 2.28 | 0.79 | 6.61 | |
Fig. 8.
Model predicts two patient groups, those with high and low 12-month functional outcome (SF12/PCS).
Discussion
Total knee replacement effectively relieves arthritis pain but improvement in physical function varies after the procedure. Of note, the mean SF12/PCS gain in two-thirds of patients is significantly greater than the previously published average gains (21 points versus 11 points). These data emphasize the effectiveness of TKR surgery. However, a clearer understanding of the patient attributes associated with lower levels of functional gain after TKR is critical to surgical decision making.
While this study has some limitations, we believe none are likely to alter the conclusions. The primary limitation of this analysis is that only ½ of the total patients in the registry had complete outcome data. It is possible patients with 12-month data represent those with best outcomes (ie, poor outcomes excluded). If this is true, the wide variation in function is even more important. If we assume all patients with incomplete data (ie, excluded from this analysis) had a mean functional improvement equal to the PORT mean improvement (10 points), it would still be true that over 31% of patients reported little or no improvement in function (change in PCS < 5). In addition, one can hypothesize three possible sources of variation in postoperative functional gain: (1) perioperative surgical care; (2) patient attributes prior to surgery; and (3) post-TKR rehabilitation regimens. In this analysis, we used complication reports and surgical data to identify and include only patients with technically successful TKR surgery. Because rehabilitation regimens are not recorded in the registry and vary widely, we were unable to isolate the potential contribution of rehabilitation to the degree of functional improvement after TKR. Future research should attempt to control for the influence of post-TKR rehabilitation.
Our analyses document differences in patient attributes prior to surgery, including age, body mass index, emotional health, and quadriceps strength, are associated with variation in functional gain after TKR. Others have documented that despite excellent surgical technique, refined prosthetics, and consistent post-TKR pain relief, substantial variation in post-TKR functional improvement exists [21]. For example, the TKR Patient Outcomes Research Team (PORT) multisite, prospective study reported 12-month post-TKR function actually declined in 19% of participants while other patients reported functional gains more than three times the average [12]. Previous TKR outcomes research and recent reviews have identified consistent predictors of post-TKR function yet concluded no one patient attribute or surgical factor offered a satisfactory explanation for this outcome variation [11, 13, 14].
While advanced age is not a surgical contraindication for TKR, it may be associated with less functional improvement after surgery. In this cohort, patients over 80 years of age were more likely to have a 1-year function score below 30 than patients in younger groups. A 2004 retrospective study of 130 frail elders (age > 80) who had knee or hip replacement surgery reported 95% satisfaction with outcomes and 90% of patients were categorized as community walkers without assistance [20]. Future research should correlate function scores with community walking to clarify the level of functional gain that is likely for patients older than 80 years.
We found pre- and post-TKR function distributions for women were shifted toward lower function when compared to men. This is consistent with two reports suggesting women have more advanced symptoms and greater disability at time of TKR and women’s post-TKR function lags behind that of men [7, 12]. In addition, fewer women than men reported post-TKR function scores of 50 or more.
Our data suggest BMI over 40 is associated with a higher likelihood of poor functional improvement. This is consistent with research reporting that higher BMI is associated with lower activity among TKR patients [9, 17]. Prior research reports no detectable difference in surgical outcome (Knee Society score; 76 months) between patients with a BMI greater than or less than 40 kg/m2 [22]. However, obese patients have a higher revision rate than non-obese patients (5% versus 3%) but no difference in 10-year prosthetic survival has been noted [21]. While the vast majority of patients with a BMI less than 30 demonstrated improvement in PCS (SF-36), patients with a BMI 30 or above showed varying functional gains.
While it is accepted that emotional health influences functional gain after TKR, the relationship is not clearly understood. The knee replacement PORT study stated: “Those patients who had lower Mental Component scores before surgery were less likely to improve physically [13].” Consistent with the PORT results, the current analysis demonstrates two post-TKR distributions: one for high pre-TKR emotional health (MCS ≥ 50) and one for low pre-TKR emotional health (MCS < 50). The majority of post-TKR patients with stronger emotional health reported improvement in function. However, the low emotional health group (MCS < 50) distribution was almost flat with large numbers of patients reporting no improvement in PCS at 12 months. One recent analysis of international TKR patients reports pre-TKR emotional health (MH subscore/SF36) was a predictor of post-TKR physical function as measured by both WOMAC and SF36 [6]. Our previous work established low MCS patients undergoing TKR exhibit higher trait anxiety, subclinical depression, poor coping skills and less social support [2]. The current analysis of a national cohort supports the importance of addressing emotional health issues in the perioperative TKR process.
Finally, patients in this database with poor quadriceps strength on pre-TKR physical exam were more likely to report low function at 1 year following surgery. It is well recognized quadriceps strength is important to knee function. Mizner et al. [17] reported poor pre-TKR quadriceps strength is associated with poorer knee function as measured by both the stair-climbing and timed up-and-go tests at 6 months post-TKR. However, muscle strength did not predict SF36 self-reported function [18]. A small series reported the isometric maximal voluntary quadriceps contraction was lower on the operated leg both before TKR and at 6 months following but reported improvement in explosive force at 6 months post-TKR [10]. The origin of quadriceps weakness in knee osteoarthritis may be related to both the progression of the underlying pathology and disuse atrophy. However, the sequence of events has not been definitively identified [3]. Additional research is needed to better understand the association between pre- and post-TKR quadriceps strength and functional gain following surgery.
The unprecedented number of cases (8050 patients with complete baseline and 1-year followup data) and surgeons (135 orthopaedists in 31 states) included in this sample strengthen the results. The baseline patient attributes and 12-month functional returns in our research cohort approximated the prospective cohorts described in the literature. Minor differences exist between our population and that of the PORT study (ie, younger mean age, higher mean BMI), but it is likely these differences reflect change in the patients who choose TKR today versus patients in 1992–93.
While TKR surgery consistently relieves pain due to arthritis, one-third of patients reported limited functional gain 1 year after surgery. These analyses suggest functional gain following TKR varies by demographic and clinical variables, including pre-TKR age at surgery, gender, BMI, emotional and physical function, and quadriceps strength. Age, BMI, baseline MCS and PCS, and poor or fair quadriceps strength predicted the low function responder group. In theory, some of these variables, such as BMI, emotional health, and quadriceps strength, are modifiable. However, in clinical practice, preoperative change in these variables may be unrealistic. Knee pain associated with advanced arthritis limits the patient’s ability to lose weight or participate in a muscle strengthening program. Thus, future research may examine strategies to tailor postoperative rehabilitation programs to the particular needs of these patients. Similarly, patients with poorer emotional health (low MCS) achieve poorer functional gain after TKR. We are currently developing and testing a behavioral support program for patients with low MCS with the goal of enhancing active participation in rehabilitation after surgery to improve functional gain in these patients. A better understanding of the patient attributes associated with limited improvement in post-TKR function will allow surgeons to discuss the likely functional outcome in individual situations in order to assure patients’ expectations are satisfied.
Acknowledgments
We thank Jake Drew, MD, and Janel Milner for their contributions and assistance with the manuscript.
Appendix 1
Comparison of patient attributes in PORT study, Zimmer total, Zimmer subset with complete data, and single site registry
| Pre-TKR Patient attributes | Zimmer subset (Research Cohort)* | Zimmer total | PORT study† | Central NY: Single site |
|---|---|---|---|---|
| Years of enrollment | 2000–2004 | 2000–2004 | 1992–1993 | 1998–2000 |
| # Surgeons | 135 | 171 | 48 | 2 |
| # Patients eligible for inclusion | unknown | unknown | 563 | 172 |
| # Patients included | 8050 | 17,270 | 291 | 172 |
| % Patients included | unknown | unknown | 52 | 100 |
| % Patients with followup data* | 100 (1 year) | 51 (1 year) | 92 (2 years) | 100 (1 year) |
| Patients Included | ||||
| Osteoarthritis diagnosis (%) | 95 | 94 | 100 | 100 |
| Knee pain past 6 M (%) | 100 | 100 | 100 | 100 |
| Primary TKR (%) | 100 | 100 | 100 | 100 |
| Potential Prognostic Variables | ||||
| Age (mean years) | 67.8 | 67.6 | 70.2 | 67.3 |
| Male % | 34 | 35 | 37 | 34 |
| Female % | 66 | 65 | 63 | 66 |
| Region of US (# states) | 31 | 36 | Indiana | Central NY |
| BMI (mean) | 32 | 32 | 30 | — |
| SF12 PCS preoperative | 30.3 | 30.2 | 27.4 | 30.4 |
| SF12 MCS preoperative | 52.6 | 53.6 | 52.5 | 52.5 |
| KSS- Pain preoperative | 37.0 | 35.6 | 34.7 | — |
| KSS- Function preoperative | 47.0 | 47.7 | 41.2 | — |
| Outcome Variables | ||||
| SF12 PCS 12 month | 43.8 | 42.6 | 38.1 | 40.8 |
| Mean PCS change (pre to 12 mo) | 13.6 | 14.1 | 10.5 | 10.4 |
| KSS- Pain 6 month | 80.0 | 76.8 | 62.8 | — |
| KSS- Function 6 month | 67.3 | 66.1 | 62.5 | — |
| Surgeon and hospital factors | ||||
| % patients treated by surgeons with annual volume > 20/year | 78% | 73% | 77% | 100% |
| Surgeon volume > 20/year in database (%) | 30.4% | 22.5% | — | 100% |
| % patients treated in hospitals with annual volume < 50 | 40% | 39% | — | 0 |
| Hospital < 50 TKR/year (%) | 41% (n = 92) | 45% (n = 144) | 20% (n = 5) | 0 |
Appendix 2
Mixture Model Detail
The mixture model can be written as:  , where
  is 12-month PCS change of subject
  ,
,  `is the vector of baseline characteristics of the subject,
  are the coefficients,
  ;
;  and
and  are the mixing probabilities for latent low- and higher-responder groups,
  is the vector of the
  -th subject’s characteristics that predict his/her probability of belonging to the low responder group, and
  and
and  are the two discrete random variables corresponding to the low- and high-responder groups. As part of the model, we used a logit function to model the probability of a patient outcome falling in the low functional improvement group (versus high functional gain). A patient was classified into the low functional response group if
  .
.
Footnotes
One or more of the authors (DA) has received funding from Zimmer, Inc.
Each author certifies that his or her institution has approved the human protocol for this investigation and that all investigations were conducted in conformity with ethical principles of research, and that informed consent for participation in the study was obtained.
References
- 1.Ayers DC, Franklin PD, Ploutz-Snyder R, Boisvert CB. Total knee replacement outcome and coexisting physical and emotional illness. Clin Orthop Relat Res. 2005;440:157–161. [DOI] [PubMed]
- 2.Ayers DC, Franklin PD, Trief PM, Ploutz-Snyder R, Freund DA. Psychological attributes of preoperative total joint replacement patients: implications for optimal physical outcome. J Arthroplasty. 2004;19:125–130. [DOI] [PubMed]
- 3.Brandt KD, Radin EL, Dieppe PA, van de Putte L. Yet more evidence that osteoarthritis is not a cartilage disease. Ann Rheum Dis. 2006;65:1261–1264. [DOI] [PMC free article] [PubMed]
- 4.Centers for Disease Control and Prevention (CDC). Physical activity among adults with a disability–United States, 2005. MMWR Morb Mortal Wkly Rep. 2007;56:1021–1024. [PubMed]
- 5.Doherty M. Risk factors for progression of knee osteoarthritis. Lancet. 2001;358:775–776. [DOI] [PubMed]
- 6.Escobar A, Quintana JM, Bilbao A, Arostequi I, Laguente I, Vidaurreta I. Responsiveness and clinically important differences for the WOMAC and SF-36 after total knee replacement. Osteoarthritis Cartilage. 2007;15:273–280. [DOI] [PubMed]
- 7.Ethgen O, Bruyere O, Richy F, Dardennes C, Reginster JY. Health-related quality of life in total hip and total knee arthroplasty. J Bone Joint Surg Am. 2004;86:963–974. [DOI] [PubMed]
- 8.Franklin PD, McLaughlin J, Boisvert CB, Li W, Ayers DC. Pilot study of methods to document quantity and variation of independent patient exercise and activity after total knee arthroplasty. J Arthroplasty. 2006;21:157–163. [DOI] [PubMed]
- 9.Gapeyeva H, Buht N, Peterson K, Ereline J, Haviko T, Paasuke M. Quadriceps femoris muscle voluntary isometric force production and relaxation characteristics before and 6 months after unilateral total knee arthroplasty in women. Knee Surg Sports Traumatol Arthrosc. 2007;15:202–211. [DOI] [PubMed]
- 10.Hawker G, Wright J, Coyte P, Paul J, Dittus R, Croxford R, Katz B, Bombardier C, Heck D, Freund D. Health-related quality of life after knee replacement: results of the Knee Replacement Patient Outcomes Research Team Study. J Bone Joint Surg Am. 1998; 80:163–173. [DOI] [PubMed]
- 11.Hawker GA, Wright JG, Coyte PC, Williams JI, Harvey B, Glazier R, Badley EM, Differences between men and women in the rate of use of hip and knee arthroplasty. N Engl J Med. 2000; 342:1016–1022. [DOI] [PubMed]
- 12.Heck DA, Robinson RL, Partridge CM, Lubitz RM, Freund DA. Patient outcomes after knee replacement. Clin Orthop Relat Res. 1998;356:1–18. [DOI] [PubMed]
- 13.Jones CA, Beaupre LA, Johnston DW, Suarez-Almazor ME. Total joint arthroplasties: current concepts of patient outcomes after surgery. Clin Geriatr Med. 2005;21:527–541. [DOI] [PubMed]
- 14.Jordan JM, Linder GF, Renner JB, Fryer JG. The impact of arthritis in rural populations. Arthritis Care Res. 1995;4:242–250. [DOI] [PubMed]
- 15.Kurtz S, Ong K, Lau E, Mowat F, Halpern M. Projections of primary and revision hip and knee arthroplasty in the United States from 2005 to 2030. J Bone Joint Surg Am. 2007;89:780–785. [DOI] [PubMed]
- 16.McClung CD, Zahiri Higa CA, Amstutz JK, Amstutz HC, Schmalzried TP. Relationship between body mass index and activity in hip and knee arthroplasty patients. J Orthop Res. 2000;18:35–59. [DOI] [PubMed]
- 17.Mizner RL, Petterson SC, Stevens JE, Axe MJ, Snyder-Mackler L. Preoperative quadriceps strength predicts functional ability one year after total knee arthroplasty. J Rheumatol. 2005;32:1533–1539. [PubMed]
- 18.Rankin EA, Alarcon GS, Chang RWCooney LM, Costley LS, Delitto A, Deyo RA, Donaldson SK, Hochberg MC, MacLean CH, Yelin EH, Marciel K. NIH consensus statement on total knee replacement, December 8–10, 2003. J Bone Joint Surg Am. 2004;86:1328–1335. [DOI] [PubMed]
- 19.Shah AK, Celestin J, Parks ML, Levy RN. Long-term results of total joint arthroplasty in elderly patients who are frail. Clin Orthop Relat Res. 2004 425:106–109. [DOI] [PubMed]
- 20.Spicer DD, Pomeroy DL, Badenhausen WE, Schaper LA Jr, Curry JI, Suthers KE, Smith MW. Body mass index as a predictor of outcome in total knee replacement. Int Orthop. 2001;25:246–249. [DOI] [PMC free article] [PubMed]
- 21.Tierney WM, Fitzgerald JF, Heck DA, Kennedy JM, Katz BP, Melfi CA, Dittus RS, Allen DI, Freund DA. Tricompartmental knee replacement. A comparison of orthopaedic surgeons’ self reported performance rates with surgical indications, contraindications, and expected outcomes. Knee Replacement Patient Outcomes Research Team. Clin Orthop Relat Res. 1994;305:209–217. [PubMed]
- 22.Wendelboe AM, Hegmann KT, Biggs JJ, Cox CM, Portmann AJ, Gildea JH, Gren LH, Lyon JL. Relationships between body mass indices and surgical replacements of knee and hip joints. Am J Prev Med. 2003;25:290–295. [DOI] [PubMed]


