Abstract
The discovery that the dilute gene encodes a class V myosin led to the hypothesis that this molecular motor is involved in melanosome transport and/or dendrite outgrowth in mammalian melanocytes. The present studies were undertaken to gain insight into the subcellular distribution of myosin-V in the melanoma cell line B16-F10, which is wild-type for the dilute gene. Immunofluorescence studies showed some degree of superimposed labeling of myosin-V with melanosomes that predominated at the cell periphery. A subcellular fraction highly enriched in melanosomes was also enriched in myosin-V based on Western blot analysis. Immunoelectron microscopy showed myosin-V labeling associated with melanosomes and other organelles. The stimulation of B16 cells with the α-melanocyte-stimulating hormone led to a significant increase in myosin-V expression. This is the first evidence that a cAMP signaling pathway might regulate the dilute gene expression. Immunofluorescence also showed an intense labeling of myosin-V independent of melanosomes that was observed within the dendrites and at the perinuclear region. Although the results presented herein are consistent with the hypothesis that myosin-V might act as a motor for melanosome translocation, they also suggest a broader cytoplasmic function for myosin-V, acting on other types of organelles or in cytoskeletal dynamics.
INTRODUCTION
Pigmentation in mammals is determined by melanin and depends on pigment synthesis by melanocytes and transfer of the pigment-containing organelles, the melanosomes, via dendritic processes to keratinocytes of the epidermis and hair follicles. Melanosome transfer appears to be a phagocytic process during which the keratinocytes engulf the dendrites of melanocytes, resulting in a uniform distribution of pigment granules throughout the hair shaft and the epidermis (Klaus, 1969; Wolff, 1973). Other mechanisms of melanosome transfer have also been proposed, such as fusion of the plasma membrane and exocytosis, based on ultrastructural studies (Yamamoto and Bhawan, 1994). Thus, proper pigmentation requires the melanosomes to be transported out from their site of synthesis at the perinuclear region to the cell periphery.
Melanocytes are highly polarized cells with the basic functions of synthesizing pigment, packaging the pigment in granules, and translocating the granules along their dendrites. Unlike fish melanophores, where dispersion and aggregation of pigment granules occur and the role of microtubules has been well documented (Rodionov et al., 1994), avian and mammalian melanocytes transport their melanosomes apparently unidirectionally to the cell periphery from where they are transferred to the surrounding keratinocytes. The underlying molecular mechanisms of melanosome transport and transfer to keratinocytes in these latter organisms are not known, nor have the potential roles of filamentous actin and microtubules been clarified (for review see Quevedo et al., 1987), although some models for a concerted action of microtubules and actin filaments (and even intermediate filaments) in pigment granule translocation have been proposed (for review see Taylor, 1992).
The dilute mouse mutation, whose gene encodes a myosin-V, causes dilution of the coat color due to a defect in the distribution of melanosomes from melanocytes to the keratinocytes of a growing hair, causing the pigment granules to form characteristic clumps that lead to a lightening of the coat color (Mercer et al., 1991a,b). Melanocytes in the hair follicle or other locations, such as, for instance, the Harderian gland, appear to have thinner, shorter, and fewer dendrites in dilute mice (reviewed by Silvers, 1979). Silvers (1979) speculated that this altered morphology due to the inadequate development of dendrites results in the clumping and crowding of the melanin granules around the nucleus of the cell and in an uneven transfer of granules from the melanocytes to the epidermal cells of the hair bulb. However, it has been demonstrated that dilute melanocytes in primary culture are capable of extending dendrites yet still fail to transport their melanosomes out to the cell periphery (Koyama and Takeuchi, 1981; Provance et al., 1996). Also, melanoma cells derived from a dilute mouse (S91, Cloudman cell line) can be induced to extend dendrites in vitro upon stimulation with α-melanocyte stimulating hormone (α-MSH) analogues (Pawelek et al., 1975; Preston et al., 1987). Thus, the formation and maintenance of dendritic processes do not seem to be directly affected by the dilute mutation. These results are quite suggestive, although not conclusive, that myosin-V is the molecular motor that translocates the melanosomes from the cell center out to the dendritic extensions.
Evidence for the role of class V myosins comes also from studies of yeast mutants. Temperature-sensitive myo2–66 mutants arrest as large unbudded cells with an accumulation of small vesicles in the mother cell (Johnston et al., 1991). Although the content of these vesicles is not known, it has recently been shown that myo2p is required for the polarized localization of a chitin synthase catalytic subunit (Chs3p) in the budding yeast (Santos and Snyder, 1997). In addition, Myo2p is required for vacuole inheritance even at the permissive temperature when other defects are not observed in the cells (Hill et al., 1996). Myo4p, a second isoform of myosin-V in yeast, has also recently been shown to be involved in polarized transport. In Saccharomyces cerevisiae, mating type switching is restricted to the mother cells. A mutation of the MYO4/SHE1 gene disrupts this restriction, so that daughters can also switch mating type (Jansen et al., 1996). Bobola et al. (1996) showed that Myo4p is required for the restricted localization of Ash1p, a repressor of mating type switching, in the daughter cell. The phenotypic analyses of yeast and mouse myosin-V mutants and the immunolocalization data showing a punctate staining pattern for myosin-V in cultured neurons and astrocytes (Espreafico et al., 1992) have led to the hypothesis of a role for class V myosins in polarized organelle translocation (for review see Mooseker and Cheney, 1995; Larson, 1996).
The present studies were undertaken to determine the subcellular localization of myosin-V in the highly pigmented melanoma cell line B16-F10 (Fidler, 1973), which is wild-type for the dilute gene (Seperack et al., 1995). We show herein some overlapping of myosin-V staining with melanosomes that tends to predominate at the cell periphery and dendritic extensions. An intense melanosome-independent labeling of myosin-V at the perinuclear region and within the dendrites was also observed. Immunogold labeling for myosin-V was observed in association with melanosomes, endoplasmic reticulum and other organelles. We also found that α-MSH treatment, which induces dramatic dendritic outgrowth and melanosome synthesis, caused an increase in myosin-V levels. Although these results are consistent with the hypothesis that myosin-V might act as a motor for melanosome translocation, they also suggest a more complex role for this myosin in melanocytes.
MATERIALS AND METHODS
Materials
The B16-F10 murine melanoma cell line (derived from C57BL/6J mouse, D/D) was a generous gift from Dr. John Pawelek (Yale University School of Medicine, New Haven, CT). Ham’s F-10, DMEM, fetal bovine serum (FBS), and horse serum were obtained from GIBCO-BRL (Gaithersburg, MD). α-MSH and 3-isobutyl-1-methylxanthine (IBMX) were obtained from Sigma (St. Louis, MO). Monoclonal antibody HMB-45 was from Dako (Carpinteria, CA). Fluorescein isothiocyanate-conjugated goat anti-rabbit IgG was from Cappel (Organon Teknika, Durham, NC) or Molecular Probes (Eugene, OR). Texas red-conjugated goat anti-mouse IgG was from Molecular Probes. Gold-labeled (10 nm) goat anti-rabbit IgG, peroxidase-conjugated anti-rabbit IgG, and chemiluminescence reagents (ECL kit) were from Amersham International Plc (Littel Chalfont, United Kingdom). Gold-labeled (18 nm) goat anti-rabbit IgG was from Jackson ImmunoResearch Laboratories (West Grove, PA). LR-White resin was obtained from LADD Research Industries (Burlington, VT) and LX-112 from Electron Microscopy Sciences (Fort Washington, PA). Pefabloc was from Boehringer Mannheim Biochemica (Mannheim, Germany). All other chemicals were from Sigma. Grade I water, prepared by using the Milli-Q (Millipore, Bedford, MA), was used in all solutions.
Cell Culture
B16-F10 murine melanoma cells were cultured in Ham’s F-10 medium supplemented with 10% horse serum in a humid atmosphere containing 5% CO2 in air at 37°C. In experiments of induction of melanization and differentiation, the cells were cultured for 24 h in DMEM and 10% FBS and then changed to DMEM and 2% FBS, containing 0.4 μM α-MSH and 0.5 mM IBMX for additional 48 h.
Immunofluorescence Microscopy
Cells were plated on glass coverslips in 35-mm-diameter Petri dishes containing the appropriate medium as described above. At selected times of incubation, coverslips were washed with phosphate-buffered saline (PBS), pH 7.2, and the cells fixed with 2% paraformaldehyde containing 0.3% Triton X-100 for 10 min at 37°C, followed by washing three times with PBS. Cells were blocked with 2% bovine serum albumin (BSA) and 5% goat serum in PBS for 1 h at room temperature or overnight at 4°C and then incubated for 4 h at room temperature in primary antibody diluted in blocking solution. Two primary antibodies were used in these studies: 1) an affinity-purified polyclonal antibody generated against a recombinant protein corresponding to the tail domain of myosin-V, which has been previously characterized (Espreafico et al., 1992). This antibody was purified on Sepharose column coupled to a fusion protein of the tail domain of myosin-V fused to maltose binding protein and was used at 3.2 μg/ml. 2) A monoclonal antibody, HMB-45, that recognizes a melanosomal antigen (Sturtz and Dabbs, 1994) was used at 14 μg/ml. After incubation with the primary antibody, cells were washed four times with PBS, incubated for 1 h at room temperature in secondary antibody (10 μg/ml in blocking solution), and then washed again with PBS. Coverslips were mounted in 1 mg/ml p-phenylenediamine in 90% glycerol and 10% 10× PBS and observed with a Zeiss Axiophot (Carl Zeiss, Oberkochen, Germany) microscope or a Bio-Rad 1024-UV confocal system (Bio-Rad, Richmond, CA) attached to a Zeiss Axiovert 100 microscope, using a 63× numerical aperture 1.4 Plan-Apo (differential interference contrast or DIC) oil objective. All images were collected by Kalman averaging of at least 10 frames (512 × 512 pixels), by using an aperture (pinhole) of 2.0 μm maximum. The collected DIC images were filtered for sharpening with a minimum setting using Bio-Rad Lasersharp software version 2.1a.
Subcellular Fractionation
Melanoma cells were propagated by injecting them subcutaneously into the dorsal region of C57BL/6 mice. Three to 4 weeks after the injection, the tumors were removed and used fresh for the preparation of melanosomal fractions according to the method of Seiji et al. (1963) slightly modified. The tumors were excised, mixed with 5 volumes of ice-cold 0.3 M sucrose in extraction buffer (40 mM HEPES, pH 7.7, 10 mM EDTA, 5 mM ATP, 2 mM dithiothreitol, 1 mM benzamidine, 2 μg/ml aprotinin, 1 mM pefabloc) and promptly homogenized on ice for 2 min in a Potter–Elvehjem Teflon-on-glass homogenizer. All subsequent steps were performed at 4°C or on ice unless otherwise indicated. The homogenate was centrifuged at 700 × g for 10 min and the resulting low-speed supernatant was centrifuged at 11,000 × g for 10 min, yielding a pellet that was resuspended in a volume equal to the original homogenate of 0.3 M sucrose in extraction buffer and centrifuged at 15,000 × g for 10 min. The resulting sediment, consisting mainly of mitochondria, lysosomes, and melanosomes, referred to as the large granule fraction (LGF), was resuspended in one-sixth of the homogenization volume of 0.3 M sucrose in extraction buffer, and 1 ml was layered onto a discontinuous sucrose density gradient (1.5, 1.55, 1.6, 1.8, 2.0, 2.2, 2.4, and 2.6 M; 1 ml of each concentration) and centrifuged at 100,000 × g for 2 h in a SW40Ti swinging bucket rotor in a Beckman model L8–60 M ultracentrifuge (Beckman, Fullerton, CA). Fractions were collected from the bottom up, by using a peristaltic pump. A small dark pellet (referred to as the melanosomal P fraction), which sedimented through the final sucrose layer, was collected and analyzed with the other fractions. The protein content of the fractions was estimated by the method of Bradford (1976), performed in duplicate by using BSA as a standard. Fractions were subsequently analyzed for total protein by silver staining and for myosin-V by Western blots of equivalent gels that were probed with antibodies against myosin-V tail. The gels were loaded with approximately 2 μg of protein for fractions S1 to P3 and approximately 0.7 μg for fractions LGF to F6.
The chemiluminescence films and silver-stained gels were imaged by scanning on a Hewlett–Packard scanjet 3c at a resolution of 1200 pixels/inch. Quantification analysis was done as follows. Western blots containing 0.3, 0.6, 1.2, and 12 ng of highly purified chick brain myosin-V (Nascimento et al., 1996) were run in parallel with sample blots. The integrated density was measured for each lane on the images by using the program UTHSCSA (ImageTool for Windows version 1.27; Wilcox, Dove, McDavid, and Greer, University of Texas Health Science Center in San Antonio, Copyright 1995–1997). The values obtained were used to calculate an exponential standard curve that best described the data based on the least square method. This curve was used to infer the amount of myosin-V in the B16 tumor fractions from the integrated density values with background subtraction. The average integrated density value obtained from the silver-stained gels (Figure 5, lanes from S1 to P3) was used to extrapolate the amount of total protein in the homogenate (H).
Figure 5.
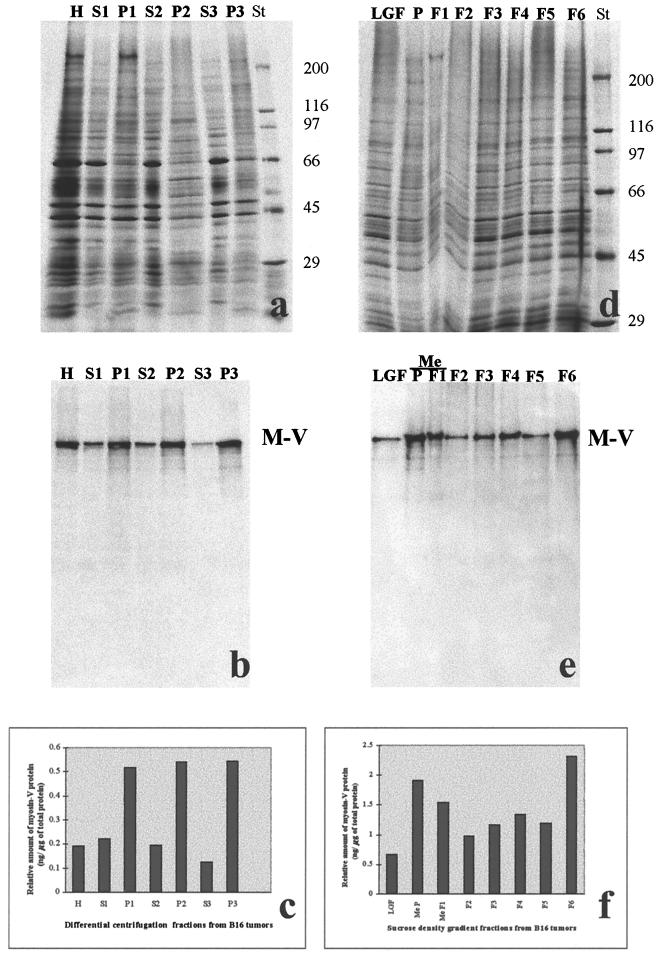
Distribution of myosin-V in subcellular fractions of B16 tumors prepared by differential centrifugation and fractionation on a sucrose density gradient. Silver-stained gels (a and d) and Western blots probed with anti-myosin-V tail and revealed by chemiluminescence (b and e) are shown. (a and b) Gels contain total homogenate (H), postnuclear supernatant (S1), nuclear fraction (P1), 11,000 × g supernatant (S2), pellet (P2), 80,000 × g supernatant (S3), and pellet (P3) after ultracentrifugation of S2 for 6 h, in a Ti50 rotor. (d and e) Gels contain the fractions collected from the fractionation of the LGF on a sucrose density gradient (P denotes the dark pellet and fractions 1–6 are from decreasing sucrose concentrations, respectively). Me, fractions containing purified melanosomes; St, molecular weight standards. (c and f) Quantification of the myosin-V protein in the fractions analyzed, based on the integrated density measurements on the images shown in a and b and in d and e, respectively. Note that the amounts of myosin-V were estimated based on the signal obtained for purified chick brain myosin-V on Western blots, as described in MATERIAL AND METHODS.
Immunoelectron Microscopy
Pellets of cells were fixed with 0.5% glutaraldehyde and 4% paraformaldehyde in 0.1 M cacodilate buffer, pH 7.4, for 2 h at 4°C, followed by 1% osmium tetroxide in the same buffer for 2 h at 4°C, gradual dehydration in ethanol, substitution with propylene oxide, and embedding in LX-112 or LR-White. Ultra-thin sections approximately 80 nm thick from the LX-112 blocks were placed on nickel or gold grids, and sections from the LR-White blocks were placed on pioloform-coated nickel grids (200 mesh). LX-112 sections on the grids were subjected to etching for 10 min in 1% sodium metaperiodate at room temperature and washed in water previous to immunolabeling. For both cases, postembedding immunogold labeling was performed as follows. Blocking of nonspecific sites was done in 20 mM Tris(hydroxymethyl)aminomethane hydrochloride (Tris-HCl), pH 8.2, 0.1% BSA, and 5% goat serum for 30 min at room temperature. Subsequently, the grids were incubated overnight at 4°C with primary antibody (affinity-purified anti-myosin-V tail, diluted at 160 μg/ml in blocking solution containing 1% goat serum and centrifuged for 30 min at 10,000 rpm, at 4°C in a microcentrifuge), washed twice with 20 mM Tris-HCl, pH 8.2, 0.1% BSA, and incubated for 30 min at room temperature with gold-labeled goat anti-rabbit IgG (10- or 18-nm gold particles, diluted at 1:20 and centrifuged for a few seconds at 10,000 rpm in a microcentrifuge). Three control experiments were performed in parallel: 1) the same primary antibody preadsorbed with an excess of purified chick brain myosin-V; 2) nonimmune rabbit IgG used as the primary antibody; and 3) absence of the primary antibody. After incubation with the secondary antibody grids were washed twice for 5 min in the same buffer, rinsed twice in PBS, incubated in 2% glutaraldehyde in PBS for 15 min, washed twice in water, contrasted, and observed with a Phillips electron microscope, model EM 208. Quantification of the immunogold labeling (only for LR-White) was performed as described in the legend of Table 1.
Table 1.
Subcellular distribution of immunogold in B16 melanoma cells
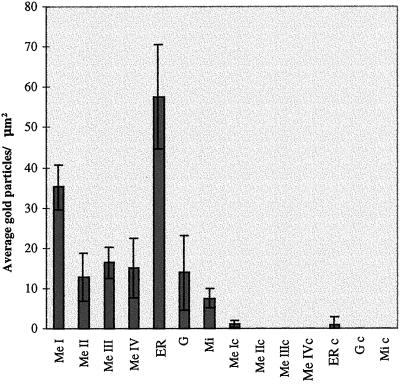
| Groups | No. of fields counted | Area (μm2) | Total gold count | Sum of gold particles/ sum of organelle area | Average no. of gold particles/μm2 | SD | Interval of confidence |
|---|---|---|---|---|---|---|---|
| Anti-MV | |||||||
| Me I | 127 | 15.2 | 539 | 4471.8 | 35.2 | 2.8 | 5.5 |
| Me II | 45 | 3.5 | 44 | 575.6 | 12.8 | 3.0 | 5.9 |
| Me III | 63 | 12.0 | 189 | 1036.8 | 16.5 | 1.9 | 3.8 |
| Me IV | 45 | 5.6 | 65 | 677.7 | 15.1 | 3.8 | 7.3 |
| ER | 119 | 9.3 | 482 | 6851.8 | 57.6 | 6.6 | 12.9 |
| G | 17 | 2.8 | 37 | 235.7 | 13.9 | 4.7 | 9.2 |
| Mi | 65 | 16.0 | 105 | 488.8 | 7.5 | 1.2 | 2.4 |
| Citosol and undefined structuresa | 134 | — | 42 | — | — | — | — |
| Total | 134 | 400 | 1503 | — | 3.8 | — | — |
| Controls | |||||||
| Me Ic | 48 | 8.5 | 14 | 53.9 | 1.1 | 0.4 | 0.8 |
| Me IIc | 15 | 0.8 | 0 | 0 | 0 | 0 | 0 |
| Me IIIc | 17 | 3.8 | 0 | 0 | 0 | 0 | 0 |
| Me IVc | 6 | 0.3 | 0 | 0 | 0 | 0 | 0 |
| ER c | 47 | 2.8 | 2 | 43.8 | 0.9 | 0.9 | 1.8 |
| G c | 10 | 1.2 | 0 | 0 | 0 | 0 | 0 |
| Mi c | 38 | 8.6 | 0 | 0 | 0 | 0 | 0 |
| Total | 50 | 150 | 16 | — | 0.1 | — | — |
B16 cells were fixed and embedded in LR-White resin as described in MATERIAL AND METHODS. Sections of about 80 nm thick were placed on pioloform-coated grids and incubated with antibodies against myosin-V or under two control conditions (antibodies to myosin-V preincubated with excess of myosin-V protein purified from chick brain or nonimmune rabbit IgG). Analyses were done on a total area of 400 μm2 for the myosin-V labeling and 150 μm2 for the controls, on randomly taken photographs, by using the program UTHSCSA ImageTool on a Pentium computer. Spatial measurements were calibrated based on a photograph, taken at the same magnification, of a diffraction grating replica with square pattern of 0.463 μm of distance between the limiting lines. Selection of the organelle area was done manually with the computer mouse. All gold particles in the fields were counted and computed as being associated with a defined organelle, whenever they were on top or a few nanometers close to the organelle. Identified organelles were melanosomes at stages I (MeI), II (MeII), III (MeIII), and IV (MeIV); ER; Golgi apparatus (G); and mitochondria (Mi). c indicates control groups. SD (standard deviation) and interval of confidence were obtained by analysis of variance (Anova Single Factor analysis tool) in the Microsoft Excel.
This group was not included in the analysis of variance.
Preparation of Total Homogenates from Mouse Brain and from Nonstimulated and α-MSH-stimulated B16 Cells
A brain homogenate was prepared from a mouse killed by decapitation. The brain was rapidly removed, placed in 5 volumes of ice-cold buffer (40 mM HEPES, pH 7.7, 10 mM EDTA, 2 mM dithiothreitol, 1 mM benzamidine, 2 μg/ml aprotinin, 1 mM pefabloc) and promptly homogenized on ice by using an Omni 2000 homogenizer. B16 cell homogenates were prepared from confluent cultures grown as described under CELL CULTURE. Cells from stimulated and nonstimulated cultures were lifted with Tyrode’s solution and centrifuged at 1000 × g for 5 min. The pellets were homogenized in 5 volumes of the buffer described above. Aliquots were taken for protein determination (Bradford, 1976), prepared for SDS-PAGE, and analyzed for total protein by silver staining and for myosin-V and myosin-II by chemiluminescence on Western blots.
Electrophoresis and Immunoblotting
SDS-PAGE was performed in 5–16% linear gradient minigels. Western blotting was carried out according to Towbin et al. (1979). Nonspecific sites were blocked by incubating the filters for 1 h in Tris-buffered saline (TBS), pH 8.0, containing 5% nonfat dry milk and 0.1% Tween 20 (TBS-Tween). Subsequently the filters were incubated with affinity-purified primary antibodies diluted in the same solution. The anti-myosin-V tail and the anti-brain myosin-II were both used at 0.5 μg/ml. The antibodies to myosin-II were generated in our laboratories against myosin-II purified from chick brain and affinity-purified against chick brain myosin-II blotted on nitrocellulose filters. Bound antibodies were detected by incubation with peroxidase-conjugated anti-rabbit IgG and visualized by chemiluminescence (ECL).
RESULTS
Immunofluorescence Localization of Myosin-V in Nonstimulated and Stimulated B16 Cells
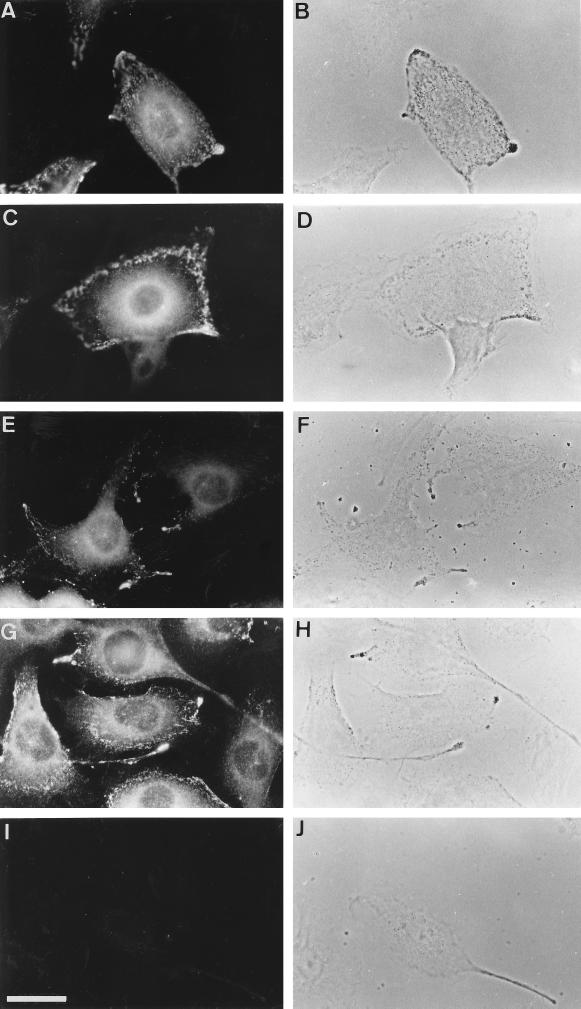
Immunofluorescence microscopy was used to examine the subcellular distribution of myosin-V in the B16 melanoma cells, which are wild-type for the dilute gene. Myosin-V staining in several cells from a nonstimulated culture is shown in Figure 1 with the respective phase-contrast fields. The staining was intense at the perinuclear region, where it displayed a fine punctate texture that gradually decreased in intensity as it extended from around the nucleus toward the cell periphery. Also, an intensely stained dot adjacent to the nucleus could often be seen. In addition, an intense staining of myosin-V was found at the cell periphery, where it showed a granular pattern, often appearing aggregated in areas that were close to or coincided with melanosomes (Figure 1, compare A and B, C and D, E and F, and G and H). The myosin-V staining observed in these cells was shown to be specific by the total lack of staining when the antibody was preadsorbed with an excess of purified brain myosin-V (Figure 1I).
Figure 1.
Immunofluorescence staining of myosin-V in nonstimulated B16 melanoma cells, with affinity-purified anti-myosin tail (A, C, E, and G). Control staining using a primary antibody that was preadsorbed with an excess of purified brain myosin-V (I). Micrographs showing phase-contrast images (B, D, F, H, and J). Note intense staining at regions containing melanosome aggregates seen as dark granules by phase-contrast microscopy. Bar, 30 μm.
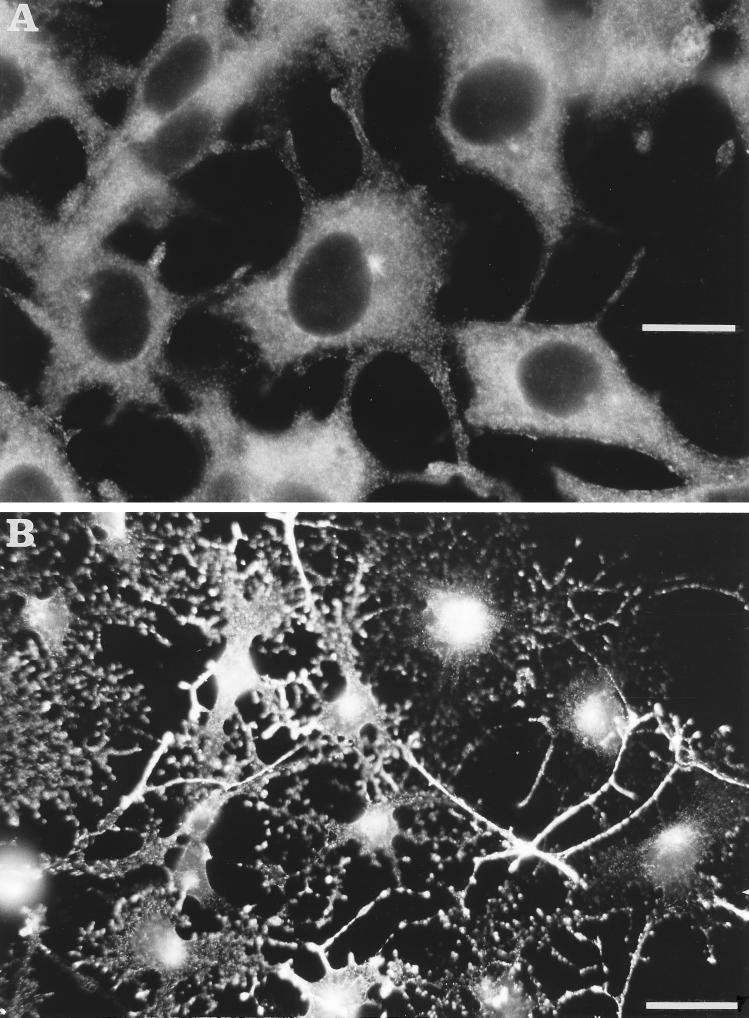
B16 cells respond to α-MSH by acquiring a differentiated morphology, characterized by a prominent dendritic arborization and intense melanization when cultured in the presence of l-tyrosine. We therefore investigated the myosin-V distribution by immunofluorescence studies on B16 cells cultured in DMEM (containing 176 mg/l l-tyrosine) and stimulated with α-MSH/IBMX in comparison with nonstimulated cultures (Figure 2). Under α-MSH stimulation, cells become highly branched and show intense granular staining by anti-myosin-V, remarkably within its cellular extensions and at the perinuclear region (Figure 2B).
Figure 2.
Comparison between nonstimulated (A) and α-MSH-stimulated (B) B16 cells revealed by myosin-V staining. The same concentration of the anti-myosin-V tail was used for both. The photographs were taken by using a 63× objective (A) and a 25× objective (B), respectively. Exposure time was controlled in both cases to minimize saturation. Cells become larger and highly dendritic and myosin-V staining appears more intense under α-MSH stimulation (B). Bars: A, 26 μm; B, 67 μm.
Immunofluorescence Localization of Myosin-V in Stimulated B16 Cells Using Confocal Microscopy
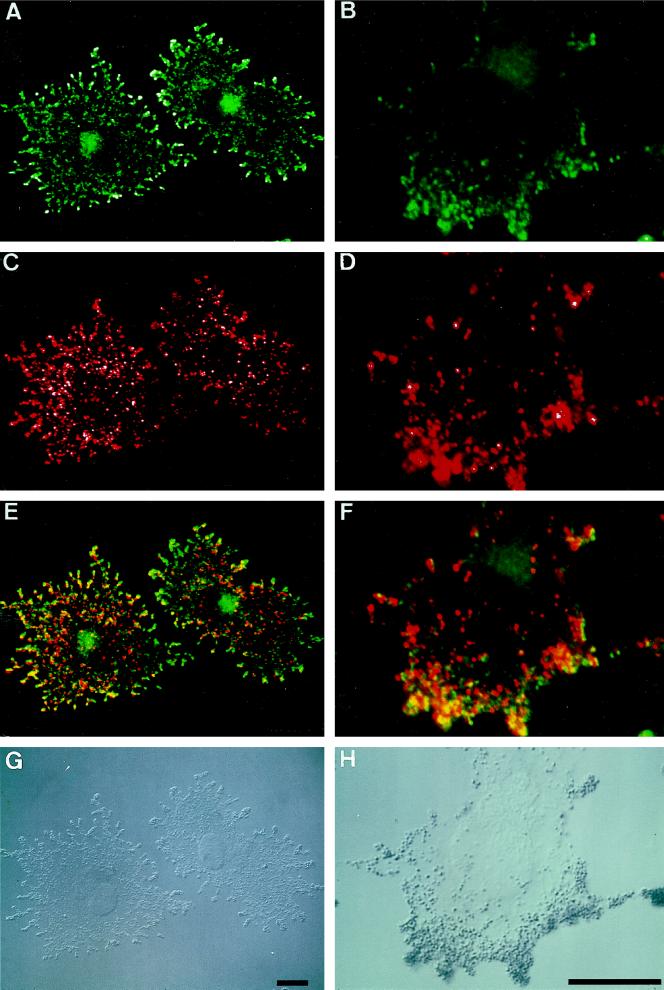
To further investigate the localization of myosin-V and melanosomes, we performed double labeling on α-MSH-stimulated B16 cells with the anti-myosin-V tail antibody and a monoclonal antibody, HMB-45, directed against a melanosomal epitope described to reside primarily on melanosomes at stages I-III (Sturtz and Dabbs, 1994). Besides the punctate perinuclear staining (Figure 3, A and B), the myosin-V staining (green) was prominent throughout the cell cytoplasm, being especially concentrated at the dendrite tips (saturated staining is seen as white dots at the cell periphery (Figure 3A). The melanosome staining (red) gave the expected granular distribution throughout the cytoplasm and, in contrast to myosin-V, showed saturated staining more within the cell boundaries, away from the periphery (Figure 3C, white dots). Partial superimposed labeling was observed, especially at the dendrites and at the lamellar extensions (Figure 3, E and F). Typically, myosin-V staining presents a finer and slightly elongated granular pattern which, although partially overlapping with the HMB-45 staining (see yellow dots at one end or on top of larger red dots; Figure 3, E and F), is also clearly distinct from the melanosomal staining. This pattern may be due to the association of myosin-V with other cytoplasmic organelles or filamentous structures surrounding the melanosomes.
Figure 3.
Confocal microscopy of double labeling immunofluorescence of myosin-V (green) and a melanosomal antigen (red) in α-MSH-stimulated B16 melanoma cells. (A and B) Anti-myosin-V was detected with fluorescein-conjugated goat anti-rabbit IgG. (C and D) Monoclonal antibody HMB-45 was detected with Texas red-conjugated goat anti-mouse IgG. (E and F) Superimposition of A and C and of B and D, respectively. (G and H) DIC images. Saturation of staining is denoted in white. Note the intense branching characteristic of the stimulated B16 cells and the granular staining of myosin-V throughout the cytoplasm, especially pronounced at the tips of dendrites. Notice, also, the superimposed staining of myosin-V and melanosomes (yellow) mainly at the dendrites or lamellar extensions. Bars, 15 μm.
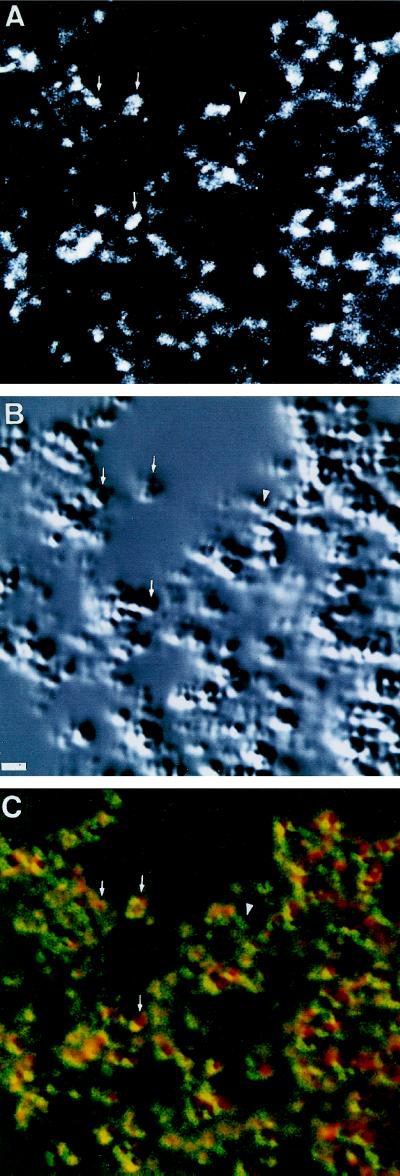
A high-magnification single-optical section obtained from branches of heavily pigmented cells is shown in Figure 4. Bright patches of myosin-V staining are coincident with melanosomes (indicated by arrows) or are located surrounding groups of melanosomes. Some melanosomes, although, do not show myosin-V staining (Figure 4, arrowhead).
Figure 4.
Single plane confocal image of a melanosome-filled cellular extension of a stimulated B16 cell. (A) Anti-myosin-V detected with fluorescein-conjugated goat anti-rabbit IgG. (B) DIC image. (C) Superimposed fluorescence (red) and DIC (green) images shown in A and B, respectively. Arrows indicate examples of myosin-V staining overlapping with melanosomes. Arrowheads indicate absence of myosin-V staining in a region corresponding to a melanosome.
Subcellular Fractionation of B16 Tumors and Determination of Myosin-V Distribution
To investigate the association of myosin-V with melanosomes, subcellular fractionation of B16 tumors leading to melanosome-enriched fractions was undertaken. Samples from each step in the procedure were analyzed by SDS-PAGE (Figure 5, a and d) and by Western blots for myosin-V (Figure 5, b and e). Quantification analysis of these data, obtained as described in MATERIAL AND METHODS, is shown in Figure 5, c and f. The graphics represent the relative distribution of myosin-V throughout the fractions in nanogram of myosin-V per microgram of total protein. It is important to point out that the myosin-V quantification shown herein is based on the Western blot signal obtained for purified chick brain myosin-V, which may result in the underestimation of the amount of mouse myosin-V due to possible species specific epitopes. The results obtained herein indicated that myosin-V constitutes about 0.2 mg/g of total protein in these tumors (Figure 5c), which is within the range of a previous estimate of myosin-V content in brain (Cheney et al., 1993).
We verified by differential centrifugation that myosin-V was distributed roughly equally, based on volume stoichiometry, between the low-speed supernatant (S1) and pellet (P1). Upon centrifugation of S1 at 11,000 × g, a significant amount of myosin-V sedimented with P2, although more than half of myosin-V protein remained in the supernatant S2, which still contains microsomes and other small vesicles. Ultracentrifugation of S2 resulted in most of the myosin-V protein coming down in pellet P3. As shown in Figure 5, these fractions were analyzed based on equal protein loading to determine the relative enrichment of myosin in each fraction. Although myosin-V is present in all fractions, this analysis revealed that it is more than twice enriched in the pelleted fractions relative to the supernatants. About equal enrichment was observed in the nuclear fraction (P1); in the LGF that contains the melanosomes, mitochondria, and lysosomes (P2); and in the ultra-speed pellet (P3) that contains microsomes and other small vesicles and plasma membrane (Figure 5, a–c). These data suggest that myosin-V is mostly associated with particulate fractions in the B16 cells. Myosin-V was detected in all fractions collected from a sucrose density gradient (Figure 5), but it was significantly more enriched in the dark melanosomal fractions (P and F1) and in the fraction collected from the top of the gradient (F6). Electron-microscopy analysis of the gradient fractions indicated that the dark fractions (P and F1) were constituted only by melanosomes mostly at stages III and IV; fractions F2, F3, F4, and F5 also showed immature melanosomes and fragments of melanosomes but were rich in mitochondria (mainly found in F3) and other membranes (our unpublished observations). The F6 fraction that showed high enrichment in myosin-V consisted mainly of membranes and vacuoles that might represent stage I nonpigmented melanosomes, some larger endoplasmic reticulum (ER) cisternae, small dendritic fragments, and plasma membranes.
Immunogold Labeling of Myosin-V in B16 Cells
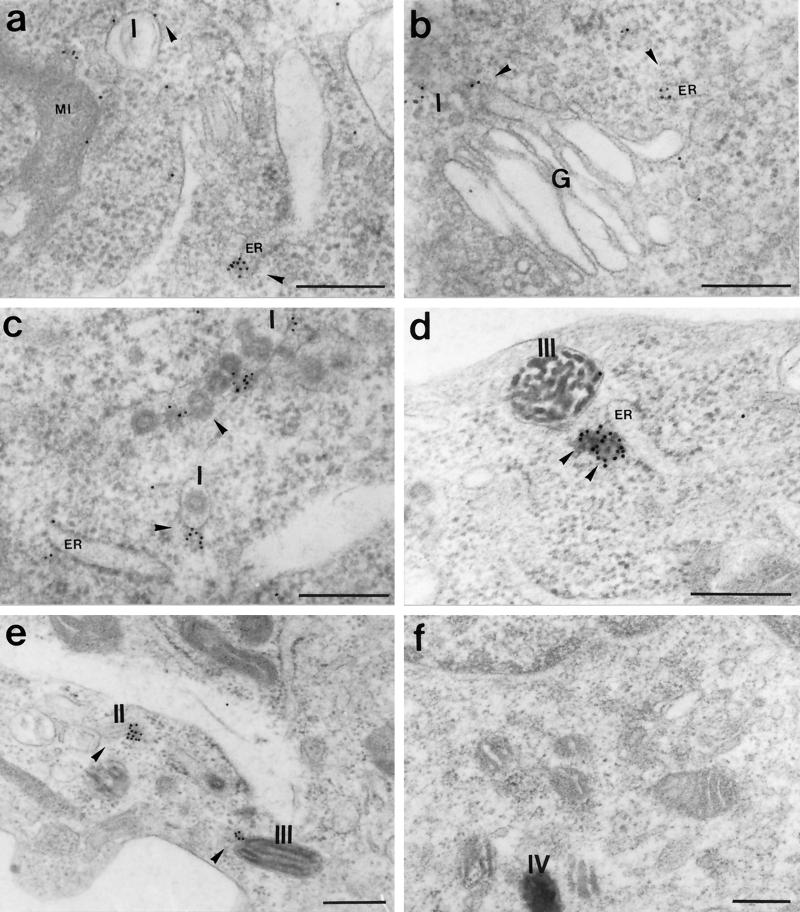
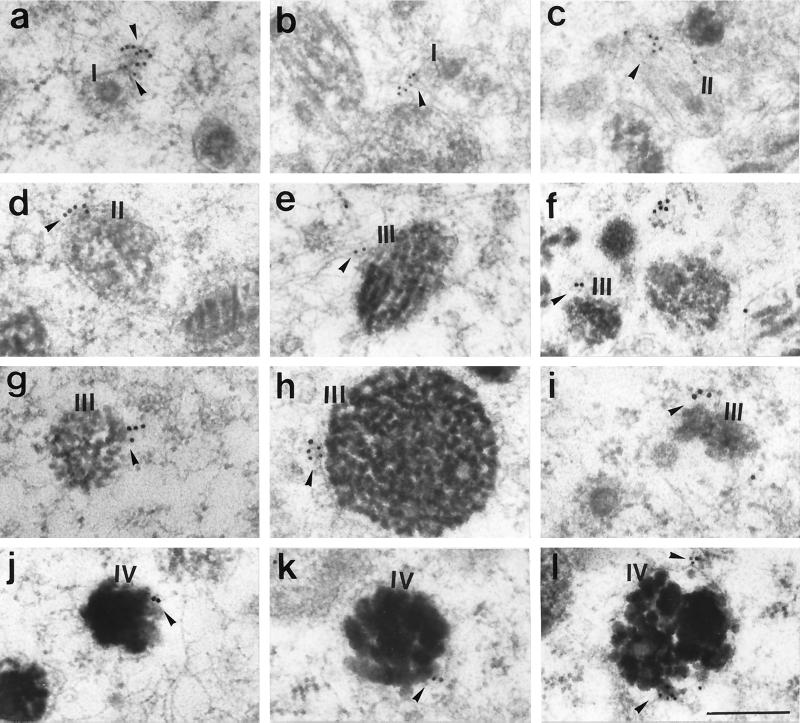
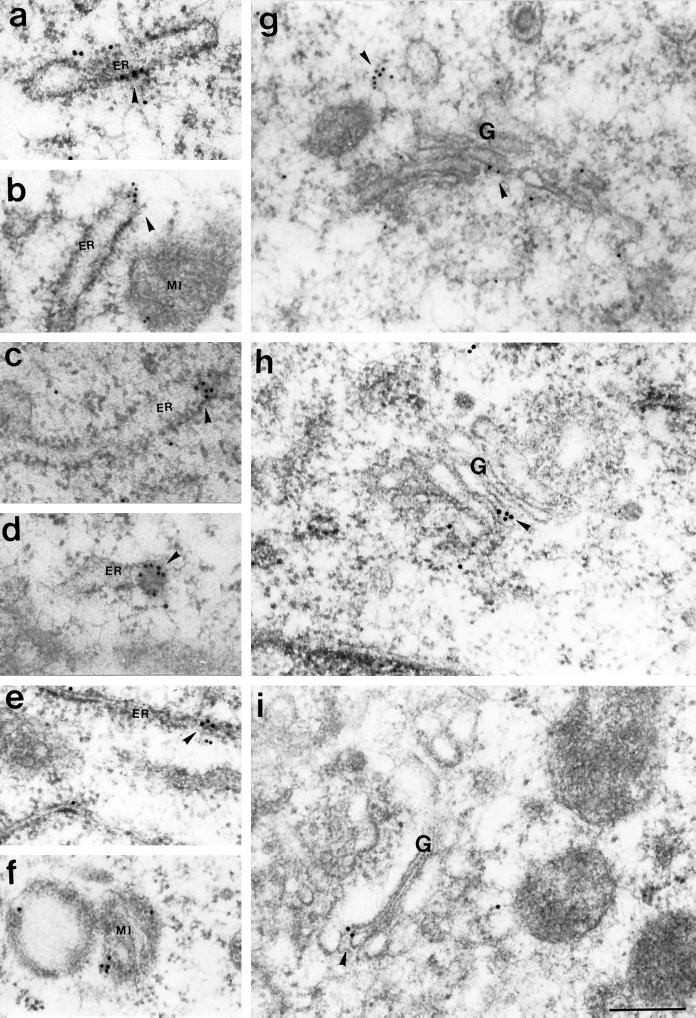
Immunogold labeling performed on ultra-thin sections of B16 cells showed gold particles on the membrane of melanosomes at all stages of maturation, I, II, III, and IV (Figures 6 and 7). Often gold particles were found not directly on the membrane of the melanosomes but a few nanometers away (Figure 6, c and e; Figure 7, a–c, e, and g). This distance may be partially due to diffusion of molecules during the preparation for electron microscopy and partially due to the length of myosin-V tail (calculated to reach ∼75 nm; Cheney et al., 1993). However, in some cases the localization of the gold particles suggested association with vesicle-like structures that were anchored to melanosomes (Figure 6, c and e; Figure 7, c and i) or to filaments surrounding the melanosomes (Figure 7, a, b, and e). Figures 6 and 8 show several examples of immunogold labeling on other organelles, including ER, Golgi apparatus (G), and mitochondria (Mi). In all cases, gold particles appear closely associated with the membrane of the organelle and ER labeling was frequently found at the tip of an expansion of the cisternae (Figure 6a; Figure 8, c and d). Rarely, we observed labeling of dense particles 60–80 nm in diameter as seen in Figure 6d (more often seen with LX-112 embedding). Table 1 and Figure 9 compile the quantification analysis of the immunogold labeling. The total number of gold particles counted was 1503 on a total area of 400 μm2 represented by 134 randomly taken photographs from approximately 100 cells on eight different grids. The most striking result was that the ER had the highest density of gold particles (∼57 particles/μm2), accounting for 32% of the total gold particles counted. Another 55% was associated with melanosomes including all stages. Surprisingly, among the melanosomes, stage I melanosomes had the highest density (∼35 gold particles/μm2) and accounted for 35% of the total particles counted. Melanosomes at stages II, III, and IV and the Golgi apparatus showed a density of ∼11–16 particles/μm2. The lowest density was associated with mitochondria (6.6 particles/μm2). Controls were performed by preincubating the primary antibody with excess of purified brain myosin-V (an example is shown in Figure 6f) or by replacing the primary antibody with a nonimmune rabbit IgG. Photographs from both controls (LR-White resin) were included in the quantification analysis shown in Table 1 and Figure 9. In a total of 150 μm2 analyzed for the controls (∼30 cells on four grids), 16 gold particles were counted (0.1 particle/μm2 as opposed to 3.8 particles/μm2 for the anti-myosin-V), most of them close to or randomly found on top of stage I melanosomes, perhaps due to the high frequency of these organelles in the sections analyzed.
Figure 6.
(a–e) Immunogold labeling of myosin-V in B16 cells, embedded in LX-112 resin, with affinity-purified anti-myosin-V tail at 160 μg/ml and a secondary antibody conjugated to 10-nm gold particles. (f) Control labeling with the primary antibody preadsorbed with excess of purified brain myosin-V. Melanosomes at stages I, II, III, and IV, mitochondria (MI), small vesicles (arrowheads), Golgi (G), and endoplasmic reticulum (ER) are indicated. Bars, 0.3 μm.
Figure 7.
Immunogold labeling of myosin-V in B16 cells embedded in LR-White resin, with affinity-purified anti-myosin-V tail at 160 μg/ml and 10-nm (a–c, e, h, k, and l) or 18-nm (d, f, g, i, and j) gold particles conjugated secondary antibody. Several examples of labeling on or close to melanosomes at stages I, II, III, and IV are shown (arrowheads). Note that labeling is also seen on filaments (a, b, and e) or vesicular structures (c and i) associated with melanosomes. Bar, 0.24 μm.
Figure 8.
Immunogold labeling of myosin-V in B16 cells embedded in LR-White resin, with affinity-purified anti-myosin-V tail at 160 μg/ml and 10-nm (b and g) or 18-nm (a, c–f, h, and i) gold particles conjugated secondary antibody. Several examples of labeling on ER (a–e), Golgi (G; g-i), and mitochondria (MI; b, f) are shown (arrowheads). Bar, 0.24 μm.
Figure 9.
Subcellular distribution of myosin-V immunogold labeling in the cytoplasmic organelles identified in B16 cells. The graphic shows the average density of gold particle on a given type of organelle (average number of gold particles/μm2 of organelle area). The organelles represented on the X-axis are melanosomes at stages I (Me I), II (Me II), III (Me III), and IV (Me IV); ER; Golgi apparatus (G); and mitochondria (Mi). c indicates controls.
We must indicate that usually only 40–60% of melanosomes, ER, or Golgi cisternae and 25% of the mitochondria, which were recognized morphologically, were found to be labeled. This fact accounts for the elevated SD shown by the analysis of variance (Table 1 and Figure 9).
Western Blot Analysis of Myosin-V Expression in Nonstimulated and α-MSH-stimulated B16 Cells
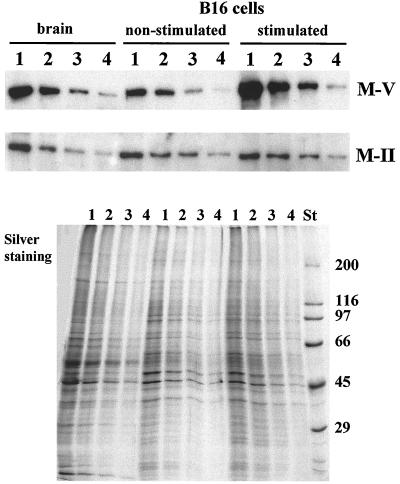
Visual analysis of the immunofluorescence of myosin-V in nonstimulated and stimulated B16 cells suggested that myosin-V expression increases under stimulation with α-MSH–IBMX (Figure 2). This led us to investigate the relative amount of myosin-V in α-MSH-stimulated versus nonstimulated cells in comparison to that of conventional myosin II. Figure 10 shows a Western blot containing equivalent amounts of protein in serial dilutions of whole homogenates from mouse brain and nonstimulated and stimulated B16 cells, respectively, which was probed with antibodies against myosin-V and myosin-II. The myosin-V expression is considerably higher in the stimulated cells than in brain or in nonstimulated B16 cells. On the other hand, myosin-II staining was about the same in all three cases. Comparative measurements of the area of the bands and densitometry indicated that α-MSH–IBMX stimulation for 3 d induced an approximated fourfold increase in the amount of myosin-V in the B16 cells, whereas no significant variation in myosin-II levels was observed. Thus, a specific increase in myosin-V expression accompanies the stimulation of these cells by the α-MSH–IBMX treatment.
Figure 10.
Immunoblotting analysis of myosin-V and myosin-II expression in nonstimulated and α-MSH-stimulated B16 cells. Immunoblots containing total homogenates of mouse brain and nonstimulated and α-MSH-stimulated B16 cells probed with antibodies against myosin-V (M-V) and brain myosin-II (M-II), respectively. Homogenates were prepared as described in MATERIALS AND METHODS. Lanes 1–4 contain 8, 4, 2, and 1 μg of protein, respectively. Western blots were developed by chemiluminescence. An equivalent silver-stained gel, except that half of the amounts of protein were applied, is shown below. St, molecular weight standards.
DISCUSSION
Previous studies have demonstrated that the dilute mouse melanocytes show defective morphology and abnormal distribution of their pigmentary granules (Silvers, 1979; Koyama and Takeuchi, 1981). The demonstration that the dilute gene encodes for myosin-V led to the hypothesis that this myosin is required for melanosome transport or formation and maintenance of dendrites (Mercer et al., 1991a,b). The striking aggregation of the melanosomes at the perinuclear region in dilute melanocytes (Koyama and Takeuchi, 1981; Provance et al., 1996) was suggestive that myosin-V could be the molecular motor that translocates the melanosomes from the cell center out to the dendritic extensions. In the present studies, we provide a detailed description of the subcellular localization of myosin-V in a melanocyte-derived cell line, B16-F10, which is wild-type for myosin-V. These cells respond to α-MSH with a dramatic change in phenotype, including an intense arborization and melanization, an accumulation of melanosomes at the cell periphery and an increase in the amount of myosin-V (Figures 2, 3, and 10). When grown as subcutaneous tumors in mice, they yield sufficient cellular mass for biochemical studies, therefore, providing an interesting model for addressing myosin-V functions in melanocytes. Our data are strongly suggestive of a complex role for myosin-V involving its association with melanosomes and other cytoplasmic organelles and the cytoskeleton.
We show herein that the immunofluorescence staining of myosin-V in B16 cells is partially superimposed on or closely surrounding many melanosomes, although a distinct labeling pattern was observed when compared with the one provided by the melanosomal marker antibody HMB-45 (Figure 3). Similar colocalization of myosin-V and melanosomes in primary cultures of dilute and wild-type mice was reported by Provance et al. (1996) and, most recently, in several mouse melanocyte cell lines, by Wu et al. (1997). Because melanosomes at all stages of maturation have been found within the dilute melanocyte, (Silvers, 1979), the consensus is that myosin-V does not play a role in the process of melanosome maturation but rather has a more direct role in the transport or tethering of melanosomes. In further support of a close association between myosin-V and melanosomes, subcellular fractionation of melanoma tumors showed an enrichment of myosin-V in melanosome subfractions (Figure 5). Immunogold labeling of myosin-V also clearly showed an association of gold particles with melanosomes (Figures 6 and 7). Thus, the data are consistent with the hypothesis of myosin-V being a motor for melanosomal translocation.
Although one might speculate that the low processivity of myosins, as opposed to kinesins (Romberg and Vale, 1993), would make the myosin motor unsuitable for organelle transport, it was shown several years ago that algae myosin can effectively support organelle movement (Kachar and Reese, 1988). More recently, evidence is accumulating that the unconventional myosins are indeed associated with organelles and motility (Bearer et al., 1993; Fath et al., 1994; Langford et al., 1994; Mermall et al., 1994; Evans and Bridgman, 1995; Hasson and Mooseker, 1995; Mermall and Miller, 1995; Simon et al. 1995). Also, recent biochemical evidence indicates that myosin-V remains partially attached to actin filaments in spite of the presence of ATP, and its Mg-ATPase activity is maximally activated at very low actin concentrations (Nascimento et al., 1996), properties that are consistent with those of a motor expected to translocate organelles.
On the other hand, it is curious that the superimposed labeling of myosin-V and melanosomes is more readily detected at the cell periphery, especially in the stimulated cells (Figure 3). If myosin-V is the molecular motor that transports the granules from their sites of synthesis to the dendritic tips, why do we not observe a more uniform superimposed labeling of myosin-V and melanosomes throughout the cytoplasm? A possible explanation is that the translocation of melanosomes may be a two-step process in which microtubule-based translocation of the melanosomes occurs from the cell center to the cortical region, where actin-based motility takes over with myosin-V as a motor. Involvement of microtubule-dependent movement of pigment granules has been demonstrated in other cells and organisms (Rodionov et al., 1994). Organelle translocation from microtubules to microfilaments has been demonstrated by Kuznetsov et al. (1992) in extruded axoplasm from the squid axon. Evans et al. (1997) showed that myosin-V-associated organelles in growth cones are present on both microtubules and actin filaments, suggesting that myosin-V may be carried as a passenger on organelles transported by microtubule-based motors; these organelles may then switch to movement along actin filaments in regions devoid of microtubules. A transition from microtubule- to actin-based motility may be crucial to the dynamic events that must take place within the melanosome-loaded dendrites for their transfer to the engulfing keratinocytes. Another possibility is that myosin-V may play a role at the dendritic tips in the anchorage of melanosomes to specific sites on the apical plasma membrane and in the dynamic organization of the apical actin cytoskeleton. This may be analogous to the specific role suggested for myosin-V in the extension of neuronal growth cone filopodia by Wang et al. (1996).
A striking aspect of our data is the high-density labeling of immature stage I melanosomes and the aspect of the gold-particle distribution forming vesicle-like shapes associated or close to melanosomes. This observation is consistent with myosin-V being involved in the targeting of components that link the melanosomes to the transport process or have a more general role in the process of biogenesis. Therefore, it might be worthwhile, with the new molecular tools, to investigate subtle structural defects on the dilute melanosomes.
Another remarkable finding of our studies is that a large fraction of myosin-V in B16 cells is not associated with melanosomes. Subcellular fractionation shows that more than half of the myosin-V sediments with the nuclear fraction. From the postnuclear supernatant, more than half remains in the 11,000 × g supernatant after sedimentation of the crude melanosome fraction. Furthermore, myosin-V present in this latter supernatant was not free, because it was almost entirely pelleted by ultracentrifugation, suggesting its association with lighter membranes and organelles (Figure 5). Immunoelectron microscopy showed gold particles on ER and Golgi cisternae, on the mitochondrial membrane, on filaments, and sometimes forming circular shapes with a diameter of about 70 nm close to ER cisternae or associated with melanosomes (Figures, 6, 7, 8, 9; Table 1). The high density of immunogold labeling of myosin-V on the ER membrane is particularly interesting. Recent reports that ER compartments are missing in the dendritic spines of Purkinje cells in the cerebellum from the ataxic mutant rat dilute-opisthotonus (dop; Dekker-Ohno et al., 1996) and from the dilute-lethal (dl) mouse (Takagishi et al., 1996) suggest that myosin-V may work as a motor for the translocation of ER compartments perhaps at specific regions of the cytoplasm. The abundance of myosin-V labeling on the ER and other organelles shown herein may also reflect a role in the targeting of components between ER and Golgi, melanosomes, and even mitochondria. Evidence from the yeast myosin-V mutants supports the notion of a role for myosin-V in membrane and component-specific targeting. Early, but not late, SEC genes are involved in the formation of the subset of vesicles that accumulate in the mother cell in the myo2–66 mutant at the restrictive temperature, suggesting a defect in Golgi inheritance (Govindan et al., 1995). Also, the myo4 mutant is defective in localization to the daughter cell of a repressor of mating type switching (Bobola et al., 1996).
Because the normal cellular distribution of ER cisternae is known to be dependent on microtubules and kinesins, one must consider the possibility that myosin-V plays a regulatory role on microtubule-dependent motility. In yeast, the demonstration that the kinesin-related protein Smy1p, when overexpressed, can suppress the myo2–66 phenotype and that the double mutant myo2/smy1 is synthetically lethal (Lillie and Brown, 1992, 1994) led to the hypothesis of overlapping or interacting functions between the actin and microtubule cytoskeletal components. This hypothesis has gained attention with the recent report by Espindola et al. (1996) showing that myosin-V might share the 10 K light chain with cytoplasmic dynein. Indeed, a second striking feature of the subcellular localization of myosin-V shown herein is the fine punctate and fibrous texture of myosin-V immunofluorescence staining at the perinuclear region with a bright dot at the centrosome (Figures 1A and 2A). Similar labeling in a variety of cells and colocalization with the centrosome has been verified (Espreafico, Coling, Kalinec, and Kachar, unpublished results). This intriguing finding suggests that myosin-V may also play a role in the organization of the cytoskeleton from the centrosomal region in these cells, and a disruption of this organization in dilute melanocytes may explain why there is such a dramatic accumulation of melanosomes toward the cell center. Further studies on the cytoskeleton organization in wild-type and dilute melanocytes are needed to clarify this point.
The relative amount of myosin-V is increased severalfold upon stimulation of the B16 cells with α-MSH and IBMX. In contrast, the myosin-II content in the same samples does not change (Figure 10). Thus, either the dilute gene expression is activated or the degradation of the myosin-V protein is inhibited by the activation of the cAMP signaling pathway. In any case these results provide additional evidence of a primary role for myosin-V in the process of differentiation and cellular organization in melanocytes.
In summary, our data provide a detailed description of myosin-V immunolocalization at the level of light and electron microscopy in a melanocyte-derived cell line, which is consistent with the hypothesis that myosin-V might act as a melanosome translocator. The data presented also strongly suggest a more complex role for myosin-V in these cells than previously recognized, which may include targeting and regulatory functions on other organelles and/or cytoskeleton dynamics.
ACKNOWLEDGMENTS
We especially thank Dr. Renato Mortara for precious help on image acquisition with the confocal microscope set up at the Escola Paulista de Medicina, Universidade Federal Paulista. We thank Dr. John Pawelek (Department of Dermatology, Yale School of Medicine) for providing the cell line used to develop this work. We also thank Dr. João K. Kajiwara for his assistance in performing the statistical analysis and the doctoral student Alexandre Azevedo who prepared and characterized the antiserum toward brain myosin-II. We thank Silmara R. Banzi, Domingos E. Pitta, Benedita O. de Souza, Silvia R.A. Nascimento, and Domingos de Souza for technical assistance; and Maria D. Seabra and Jose Augusto Maulin for assistance with electron microscopy. This work was supported by grants to R.E.L. and E.M.E. from the Fundação de Amparo à Pesquisa do Estado de São Paulo (FAPESP), 93/3552–9, Programa de Apoio ao Desenvolvimento Científico e Tecnológico (PADCT), 62.0099/95.0, and Conselho Nacional de Desenvolvimento Científico e Tecnológico (CNPq), 53.0377/93.4. A.A.C.N. is the recipient of a postdoctoral stipend from CNPq. J.C.B. and R.G.A. are predoctoral fellows from CNPq and Fundaçao Coorienação de Aperfeiçoamento de Pessoal de Nível Superior, respectively.
Footnotes
Abbreviations used: α-MSH, α-melanocyte-stimulating hormone; FBS, fetal bovine serum; IBMX, 3-isobutyl-1-methylxanthine; LGF, large granule fraction; PBS, phosphate-buffered saline; TBS,-Tris buffered saline.
These centrifugations were done in the presence of 5 mM ATP, and because myosins characteristically dissociate from microfilaments under these conditions, one might expect that association with other particulate components is responsible for the myosin-V sedimentation. However, recent biochemical data question this rational for myosin-V, which has been shown to cosediment with filamentous actin in vitro even in the presence of 10 mM ATP (Nascimento et al., 1996). Thus, we cannot yet distinguish between direct association of myosin-V to particulate fractions versus actin-linked association.
REFERENCES
- Bearer EL, DeGiorgis JA, Bodner RA, Kao AW, Reese TS. Evidence for myosin motors on organelle in squid axoplasm. Proc Natl Acad Sci USA. 1993;90:11252–11256. doi: 10.1073/pnas.90.23.11252. [DOI] [PMC free article] [PubMed] [Google Scholar]
- Bobola N, Jansen RP, Shin TH, Nasmyth K. Asymetric accumulation of Ash1p in postanaphase nuclei depends on a myosin and restricts yeast mating-type switching to mother cells. Cell. 1996;84:699–709. doi: 10.1016/s0092-8674(00)81048-x. [DOI] [PubMed] [Google Scholar]
- Bradford MM. A rapid and sensitive method for the quantification of microgram quantities of protein utilizing the principle of protein-dye binding. Anal Biochem. 1976;72:248–254. doi: 10.1016/0003-2697(76)90527-3. [DOI] [PubMed] [Google Scholar]
- Cheney RE, O’Shea MK, Heuser JE, Coelho MV, Wolenski JS, Espreafico EM, Forcher P, Larson RE, Mooseker MS. Brain myosin-V is a two-headed unconventional myosin with motor activity. Cell. 1993;75:13–23. doi: 10.1016/S0092-8674(05)80080-7. [DOI] [PubMed] [Google Scholar]
- Dekker-Ohno K, Hayasaka S, Tagagishi Y, Oda S, Noboru W, Mikoshiba K, Inouye M, Yamamura H. Endoplasmic reticulum is missing in dendritic spines of Purkinje cells of the ataxic mutant rat. Brain Res. 1996;714:226–230. doi: 10.1016/0006-8993(95)01560-4. [DOI] [PubMed] [Google Scholar]
- Espindola, F.S., Cheney, R.E., King, S.M., Suter, D.M., and Mooseker, M.S. (1996). Myosin-V and dynein share a similar light chain. Mol. Biol. Cell 7(suppl), 372a. (Abstract).
- Espreafico EM, Cheney RE, Matteoli M, Nascimento AAC, De Camilli PV, Larson RE, Mooseker MS. Primary structure and cellular localization of chicken brain myosin-V (p190), an unconventional myosin with calmodulin light chains. J Cell Biol. 1992;119:1541–1558. doi: 10.1083/jcb.119.6.1541. [DOI] [PMC free article] [PubMed] [Google Scholar]
- Evans LL, Bridgman PC. Particles moving along actin filament bundles in nerve growth cones. Proc Natl Acad Sci USA. 1995;92:10954–10958. doi: 10.1073/pnas.92.24.10954. [DOI] [PMC free article] [PubMed] [Google Scholar]
- Evans LL, Hammer J, Bridgman PC. Subcellular localization of myosin-V in nerve growth cones and outgrowth from dilute-lethal neurons. J Cell Sci. 1997;110:439–449. doi: 10.1242/jcs.110.4.439. [DOI] [PubMed] [Google Scholar]
- Fath KR, Trimbur GM, Burgess DR. Molecular motors are differentially distributed on Golgi membranes from polarized epithelial cells. J Cell Biol. 1994;126:661–675. doi: 10.1083/jcb.126.3.661. [DOI] [PMC free article] [PubMed] [Google Scholar]
- Fidler IJ. Selection of successive tumor lines for metastasis. Nat New Biol. 1973;245:148–149. doi: 10.1038/newbio242148a0. [DOI] [PubMed] [Google Scholar]
- Govindan B, Bower R, Novick P. The role of MYO2, a yeast class V myosin, in vesicular transport. J Cell Biol. 1995;128:1055–1068. doi: 10.1083/jcb.128.6.1055. [DOI] [PMC free article] [PubMed] [Google Scholar]
- Hasson T, Mooseker MS. Molecular motors, membrane movements and physiology: emerging roles for myosins. Curr Opin Cell Biol. 1995;7:587–594. doi: 10.1016/0955-0674(95)80017-4. [DOI] [PubMed] [Google Scholar]
- Hill KL, Catlett NL, Weisman LS. Actin and myosin function in directed vacuole movement during cell division in Saccharomyces cerevisiae. J Cell Biol. 1996;135:1535–1549. doi: 10.1083/jcb.135.6.1535. [DOI] [PMC free article] [PubMed] [Google Scholar]
- Jansen RP, Dowzer C, Michaelis C, Galova M, Nasmyth K. Mother cell-specific HO expression in budding yeast depends on the unconventional myosin Myo4p and other cytoplasmic proteins. Cell. 1996;84:687–697. doi: 10.1016/s0092-8674(00)81047-8. [DOI] [PubMed] [Google Scholar]
- Johnston GC, Prendergast JA, Singer RA. The Saccharomyces cerevisiae MYO2 gene encodes an essential myosin for vectorial transport of vesicles. J Cell Biol. 1991;113:539–551. doi: 10.1083/jcb.113.3.539. [DOI] [PMC free article] [PubMed] [Google Scholar]
- Kachar B, Reese TS. The mechanism of cytoplasmic streaming in Characean algal cells: sliding of endoplasmic reticulum along actin filaments. J Cell Biol. 1988;106:1545–1552. doi: 10.1083/jcb.106.5.1545. [DOI] [PMC free article] [PubMed] [Google Scholar]
- Klaus SN. Pigment transfer. Arch Dermatol. 1969;100:756–762. [PubMed] [Google Scholar]
- Koyama YI, Takeuchi T. Ultrastructural observations on melanosome aggregation in genetically defective melanocytes of the mouse. Anat Rec. 1981;201:599–611. doi: 10.1002/ar.1092010404. [DOI] [PubMed] [Google Scholar]
- Kuznetsov SA, Langford GM, Weiss DG. Actin-dependent organelle movement in squid axoplasm. Nature. 1992;356:722–725. doi: 10.1038/356722a0. [DOI] [PubMed] [Google Scholar]
- Langford GM, Kuznetsov SA, Johnson D, Cohen DL, Weiss DG. Movement of axoplasmic organelles on actin filaments assembled on acrosomal processes: evidence for a barbed-end-directed organelle motor. J Cell Sci. 1994;107:2291–2298. doi: 10.1242/jcs.107.8.2291. [DOI] [PubMed] [Google Scholar]
- Larson RE. Myosin-V: a class of unconventional molecular motors. Braz J Med Biol Res. 1996;29:309–318. [PubMed] [Google Scholar]
- Lillie S, Brown S. Suppression of a myosin defect by a kinesin related gene. Nature. 1992;356:358–361. doi: 10.1038/356358a0. [DOI] [PubMed] [Google Scholar]
- Lillie S, Brown S. Immunofluorescence localization of the unconventional myosin, Myo2p, and the putative kinesin-related protein, Smy1p, to the same regions of polarized growth in Saccharomyces cerevisiae. J Cell Biol. 1994;125:825–842. doi: 10.1083/jcb.125.4.825. [DOI] [PMC free article] [PubMed] [Google Scholar]
- Mercer JA, Seperack PK, Strobel MC, Copeland NG, Jenkins NA. Novel myosin heavy chain encoded by murine dilute coat color locus. Nature. 1991a;349:709–713. doi: 10.1038/349709a0. [DOI] [PubMed] [Google Scholar]
- Mermall V, McNally JG, Miller KG. Transport of cytoplasmic vesicles catalyzed by an unconventional myosin in living Drosophila embryos. Nature. 1994;369:560–562. doi: 10.1038/369560a0. [DOI] [PubMed] [Google Scholar]
- Mermall V, Miller KG. The 96F unconventional myosin is required for proper organization of the Drosophila syncytial blastoderm. J Cell Biol. 1995;129:1575–1588. doi: 10.1083/jcb.129.6.1575. [DOI] [PMC free article] [PubMed] [Google Scholar]
- Mooseker MS, Cheney RE. Unconventional myosins. Annu Rev Cell Dev Biol. 1995;11:633–675. doi: 10.1146/annurev.cb.11.110195.003221. [DOI] [PubMed] [Google Scholar]
- Nascimento AAC, Cheney RE, Tauhata SBF, Larson RE, Mooseker MS. Enzymatic characterization and functional domain mapping of brain myosin-V. J Biol Chem. 1996;271:17561–17569. doi: 10.1074/jbc.271.29.17561. [DOI] [PubMed] [Google Scholar]
- Pawelek J, Sansone M, Koch N, Christie G, Halaban R, Hendee J, Lerner AB, Varga JM. Melanoma cells resistent to inhibition of growth by melanocyte stimulating hormone. Proc Natl Acad Sci USA. 1975;72:951–955. doi: 10.1073/pnas.72.3.951. [DOI] [PMC free article] [PubMed] [Google Scholar]
- Preston SF, Volpi M, Pearson CM, Berlin RD. Regulation of the cell shape in the Cloudman melanoma cell line. Proc Natl Acad Sci USA. 1987;84:5247–5251. doi: 10.1073/pnas.84.15.5247. [DOI] [PMC free article] [PubMed] [Google Scholar]
- Provance DW, Jr, Wei M, Ipe V, Mercer JA. Cultured melanocytes from dilute mutant mice exhibit dendritic morphology and altered melanosome distribution. Proc Natl Acad Sci USA. 1996;93:14554–14558. doi: 10.1073/pnas.93.25.14554. [DOI] [PMC free article] [PubMed] [Google Scholar]
- Quevedo WC, Fitzpatrick TB, Szabó G, Jimbow K. Dermatology in General Medicine. 3rd ed. New York: McGraw-Hill; 1987. Biology of the melanine pigmentary system; pp. 224–258. [Google Scholar]
- Rodionov VI, Lim S-S, Gelfand VI, Borisy GG. Microtubule dynamics in fish melanophores. J Cell Biol. 1994;126:1455–1464. doi: 10.1083/jcb.126.6.1455. [DOI] [PMC free article] [PubMed] [Google Scholar]
- Romberg L, Vale RD. Chemomechanical cycle of kinesin differs from that of myosin. Nature. 1993;361:168–170. doi: 10.1038/361168a0. [DOI] [PubMed] [Google Scholar]
- Santos B, Snyder M. Targeting of chitin synthase 3 to polarized growth sites in yeast requires Chs5p and Myo2p. J Cell Biol. 1997;136:95–110. doi: 10.1083/jcb.136.1.95. [DOI] [PMC free article] [PubMed] [Google Scholar]
- Seiji M, Shimao K, Birbeck MSC, Fitzpatrick TB. Subcellular localization of melanin biosynthesis. Ann NY Acad Sci. 1963;100:497–533. [PubMed] [Google Scholar]
- Seperack PK, Mercer JA, Strobel MC, Copeland NG, Jenkins NA. Retroviral sequences located within an intron of the dilute gene alter dilute expression in a tissue-specific manner. EMBO J. 1995;14:2326–2332. doi: 10.1002/j.1460-2075.1995.tb07227.x. [DOI] [PMC free article] [PubMed] [Google Scholar]
- Silvers WK. Dilute and Leaden, the p-locus, Ruby-Eye, and Ruby-Eye-2. In: Silvers W, editor. Coat Colors of Mice: A Model for Mammalian Gene Action and Interaction. K., New York: Springer Verlag; 1979. pp. 83–107. [Google Scholar]
- Simon VR, Swayne TC, Pon LA. Actin-dependent mitochondrial motility in mitotic yeast and cell-free systems: identification of a motor activity on the mitochondrial surface. J Cell Biol. 1995;130:345–354. doi: 10.1083/jcb.130.2.345. [DOI] [PMC free article] [PubMed] [Google Scholar]
- Sturtz CL, Dabbs DJ. Angiomyolipomas: the nature and expression of the HMB45. Mod Pathol. 1994;7:842–845. [PubMed] [Google Scholar]
- Takagishi Y, Oda S, Hayasaka S, Dekker-Ohno K, Shikata T, Inouye M, Yamamura H. The dilute-lethal (dl) gene attacks a Ca2+ store in the dendritic spine of Purkinje cells in mice. Neurosci Lett. 1996;215:169–172. doi: 10.1016/0304-3940(96)12967-0. [DOI] [PubMed] [Google Scholar]
- Taylor JD. Does the introduction of a new player, the endoplasmic reticulum, create more or less confusion in understanding the mechanism(s) of pigmentary organelle translocation? Pigm Cell Res. 1992;5:49–57. doi: 10.1111/j.1600-0749.1992.tb00001.x. [DOI] [PubMed] [Google Scholar]
- Towbin H, Staehelin T, Gordon J. Electrophoretic transfer of proteins from polyacrylamide gels to nitrocellulose sheets: procedure and some applications. Proc Natl Acad Sci USA. 1979;76:4350–4354. doi: 10.1073/pnas.76.9.4350. [DOI] [PMC free article] [PubMed] [Google Scholar]
- Wang FS, Wolenski JS, Cheney RE, Mooseker MS, Jay DG. Function of myosin-V in filopodial extension of neuronal growth cones. Science. 1996;273:660–663. doi: 10.1126/science.273.5275.660. [DOI] [PubMed] [Google Scholar]
- Wolff K. Melanocyte-keratinocyte interactions in vivo: the fate of melanosomes. Yale J Biol Med. 1973;46:384–396. [PMC free article] [PubMed] [Google Scholar]
- Wu X, Bowers B, Wei Q, Kocher B, Hammer III JA. Myosin-V associates with melanosomes in mouse melanocytes: evidence that myosin-V is an organelle motor. J Cell Sci. 1997;110:847–859. doi: 10.1242/jcs.110.7.847. [DOI] [PubMed] [Google Scholar]
- Yamamoto O, Bhawan J. Three modes of melanosome transfers in Caucasian facial skin: hypothesis based on an ultrastructural study. Pigm Cell Res. 1994;7:158–169. doi: 10.1111/j.1600-0749.1994.tb00044.x. [DOI] [PubMed] [Google Scholar]


