Abstract
Spectroscopic and electronic structure studies of the class I Escherichia coli ribonucleotide reductase (RNR) intermediate X and three computationally-derived model complexes are presented, compared and evaluated to determine the electronic and geometric structure of the FeIII-FeIV active site of intermediate X. Rapid freeze-quench (RFQ) EPR, absorption and MCD were used to trap intermediate X in R2 wild-type (WT) and two variants, W48A and Y122F/Y356F. RFQ-EPR spin quantitation was used to determine the relative contributions of intermediate X and radicals present, while RFQ-MCD was used to specifically probe the FeIII/FeIV active site, which displayed three FeIV d-d transitions between 16 700 – 22 600 cm-1, two FeIV d-d spin-flip transitions between 23 500 – 24 300 cm-1 and five oxo to FeIV and FeIII charge transfer (CT) transitions between 25 000 – 32 000 cm-1. The FeIV d-d transitions were perturbed in the two variants, confirming that all three d-d transitions derive from the d-π manifold. Furthermore, the FeIV d-π splittings in the WT are too large to correlate with a bis-μ-oxo structure. The assignment of the FeIV d-d transitions in WT intermediate X best correlates with a bridged μ-oxo/μ-hydroxo [FeIII(μ-O)(μ-OH)FeIV] structure. The μ-oxo/μ-hydroxo core structure provides an important σ/π superexchange pathway, which is not present in the bis-μ-oxo structure, to promote facile electron transfer from Y122 to the remote FeIV through the bent oxo bridge, thereby generating the tyrosyl radical for catalysis.
1. Introduction
Binuclear non-heme iron-containing active sites are found in a large number of enzymes that perform highly specific oxidation reactions involving binding and activation of dioxygen.1-3 This class of enzymes includes hemerythrin (reversible O2 binding),4,5 soluble methane monooxygenase (sMMO, hydroxylation of methane),6,7 stearoyl acyl carrier protein Δ9-desaturase (Δ9D, fatty acid desaturation)8-10 and the R2 subunit of class I ribonucleotide reductase (RNR, generation of stable tyrosyl radical).11-14 Current research centers on understanding the structural and electronic features of the binuclear iron clusters that govern the diverse reactivity of these enzymes with O2. Crystal structures exist for many proteins in this class in oxidized and/or reduced forms.15-17 Each protein contains carboxylate and histidine ligands that coordinate the binuclear iron core responsible for the reductive activation of O2, generating similar peroxo-diferric and high-valent iron-oxo intermediates that have been observed and characterized in some of these enzymes.18-23
Ribonucleotide reductase catalyzes the rate-limiting step in DNA biosynthesis in all organisms, the reduction of ribonucleotides to their corresponding deoxyribonucleotides.13,14 The R1 subunit of the Escherichia coli RNR holoenzyme R1•R2 complex contains the ribonucleotide catalytic active site, whereas the R2 subunit contains the binuclear FeII active site, which (along with an exogenous electron) reductively activates O2 resulting in one-electron oxidation of an endogeneous Y122 residue to form a tyrosyl radical and an oxo-bridged diferric cluster, as shown in Scheme 1. The generation of this stable Y122• makes R2 active to initiate a long-range (~35 Å) proton coupled electron transfer (PCET), between the two subunits, to the catalytic active site in the R1 subunit.24 This leads to the formation of a thiyl radical on C439 of R1 and ultimately nucleotide reduction.25
Scheme 1.
Reaction mechanism of O2 activation and tyrosyl radical (Y122•) generation from the E. coli class I RNR R2 binuclear iron site.
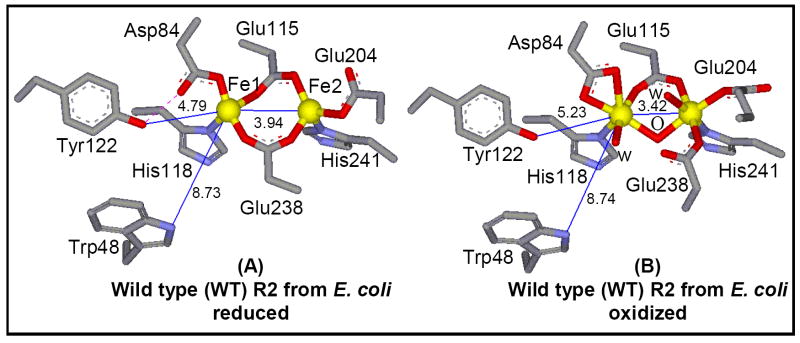
Crystal structures of both reduced and oxidized R2-WT and several variants combined with spectroscopy have greatly contributed towards the understanding of the binuclear non-heme iron active site.12,15 The active site structures of both diferrous and diferric R2-WT are shown in Figure 1. In the fully reduced form of R2-WT (see Figure 1A), the two irons centers are separated by a distance of 3.9 Å, with the Fe1 being 4C and Fe2 5C, as supported by MCD spectroscopy.26,27 The two carboxylate residues, Glu115 and Glu238 bridge the two Fe centers in a μ-1,3 fashion and the rest of coordination is completed by His118 and monodentate Asp84 on Fe1, and bidentate Glu204 and His241 on the Fe2 center. Tyr122, which gets oxidized to the stable radical, is ~5 Å away from Fe1 and is H-bonded to Asp84.28-30 The major change during the conversion of the binuclear iron cluster from diferrous to diferric form involves a significant reorganization of two carboxylates, Glu238 and Asp84. In oxidized R2-WT (see Figure 1B), both Fe centers become 6C with an Fe-Fe distance of 3.3 Å. There is one bridging μ-1,3 carboxylate from Glu115 and a single μ-oxo bridge (from O2)31 between the two FeIII centers. Fe1 is coordinated to His118, bidentate Asp84, and a terminal solvent molecule (water or hydroxide), whereas Fe2 coordination is completed by His241, monodentate Glu204 and Glu238, and a terminal solvent molecule.
Figure 1.
Crystal structures of the (A) reduced binuclear active site of R2-WT (1XIK), and (B) oxidized binuclear active site of R2-WT (1RIB) from E. coli. Specific H-bonding interactions that are crucial for R2 reactivity are shown in purple (dotted line). The structures were generated using the crystallographic coordinates from the indicated PDB files.
Major efforts have been directed toward defining the structural and electronic properties of high valent iron-oxo intermediates, specifically in sMMO and R2.1,6,32-34 sMMO catalyzes the two electron oxidation of methane to methanol and both intermediates P or Hperoxo (peroxo FeIII2 complex) and Q (FeIV2 species) have been trapped and kinetically characterized in sMMO.20,21 The methane-hydroxylating intermediate, Q, characterized by Mössbauer and EXAFS spectroscopies, exhibits an S=0 diamagnetic ground state and is thought to contain a bis-μ-oxo core structure with two antiferromagnetically-coupled FeIV ions at an Fe-Fe distance of 2.46 Å.35 For R2, there is evidence for the formation of a cis-μ-1,2-peroxo FeIII2 intermediate similar to P in D84E variants of the E. coli protein and the WT protein from mouse.23,36 During the assembly of the R2 binuclear iron in the presence of O2, an intermediate X (an oxo-bridged FeIIIFeIV species) has been identified kinetically and spectroscopically (by stopped-flow, EPR, ENDOR, EXAFS, and RFQ-MCD).19,28,37-41 The latter decays to give the stable Y122• and oxo-bridged diferric cluster. Mössbauer spectroscopy was consistent with X containing two inequivalent iron sites, a high-spin FeIII (S = 5/2) antiferromagnetically coupled to a high-spin FeIV (S = 2) yielding a resultant Stot = 1/2 spin system.19,28 This magnetic coupling between the two iron atoms is also evident from a nearly isotropic S = 1/2 EPR signal at g = 2. The short distance between the two iron atoms in intermediate X (2.5 Å) determined from EXAFS37 results in combination with 17O and 1,2H ENDOR spectroscopy39,40 indicated the presence of at least one μ-oxo bridge, with the second oxygen atom being coordinated to the FeIII site as a terminal water or hydroxide. The presence of two additional bridging ligands (carboxylates) in either a μ-1,1 or μ-1,3 bridging mode has also been inferred. The spectroscopic data on both intermediate X and Q are of high interest as both have distinctly short Fe-Fe distances with the spectra implicating a different number of bridging oxo ligands. Alternatively, a number of computational analyses,33,42-52 including the most recent study by Noodleman and coworkers,53 have concluded that X contains a bis-μ-oxo core structure, similar to the proposed structure of intermediate Q in sMMO.
Thus, the structure of X remains to be determined and the geometric and electronic description of X is required to understand the mechanism of tyrosyl radical formation in RNR. Recently, we developed a rapid-freeze-quench magnetic circular dichroism technique (RFQ-MCD) to probe electronic and structural properties of intermediate X, utilizing a double variant of RNR (Y122F/Y356F), which allowed for the generation of up to 1.4 equivalents of X.38 These MCD data permitted direct detection of the high-spin FeIV spin-allowed and forbidden ligand field transitions.
In the present study RFQ-MCD is used in combination with low temperature (LT) absorption, VTVH MCD, and EPR spectroscopies to obtain a detailed experimental description of the ligand-metal bonding in the catalytically active FeIII-FeIV binuclear site of X in the R2 subunit of RNR in WT and two variants, a double variant Y122F/Y356F and a single variant W48A. In R2-WT, X forms in a second order reaction between the biferrous active-site and O2 with a rate constant of kform = 2.1 ± 0.2 × 10⁵ mol-1s-1 and decays with a rate constant of kdecay = 1.0 ± 0.2 s-1 at 5 °C, whereas in R2 Y122F/Y356F, X had a formation rate constant kform = 5 ± 1 × 10⁴ mol-1 s-1 and kdecay = 0.3 ± 0.1 s-1 at 11 °C.54,55 Thus, the replacement of easily oxidizable Y122 and Y356 residues with phenylalanines leads to high yields of pure X (up to 1.4 eq.) with increased lifetime. The decay of X in R2-Y122F/Y356F variant generates a tyrosyl radical from one of the nearby tyrosine residues in the protein, as it cannot oxidize F122. The crucial role of W48 in the ET process of R2 has been recently investigated.54-57 In both W48F and W48A variants of R2, a diradical intermediate species containing both intermediate X and Y122• (X-Y122•) is formed from a preceding Fe2O2 complex with a kform = 7.5 ± 2.5 s-1 and with a kdecay = 0.18 ± 0.04 s-1.54-57 The kinetic parameters and the Y122• production stoichiometry for the R2-W48A variant are very similar to those reported earlier for R2-W48F.55 These experimental data presented here are complemented by DFT, TD-DFT, ΔSCF and Slater transition state calculations to examine the ligand field transition energies of the FeIV site to correlate to three possible model core structures for X: mono-μ-oxo, μ-oxo/μ-hydroxo and bis-μ-oxo (vide infra). This study correlates the experimental spectroscopic data with DFT calculations to elucidate the fundamental features of the FeIV-oxo bond in X, understand the effects of the geometric perturbations on the FeIII-O-FeIV unit and to evaluate its geometric and electronic structural contributions to the formation of Y122•.
2. Experimental Section
All commercial reagents of highest grade were used as obtained without further purification: enzyme grade 4-(2-hydroxyethyl)-1-piperazineethanesulfonic acid (HEPES) (Aldrich), ferrous ammonium sulfate (Mallinckrodt), glycerol (Aldrich), d3-glycerol (98 atom % D, Cambridge Isotope Laboratories), and deuterium oxide (99.9 atom % D, Aldrich). HEPES buffer (100 mM, pH 7.6) was degassed with at least 3 freeze-pump-thaw cycles at 10-3 Torr, while the apo protein samples (on ice) were degassed by gentle flushing with O2-scrubbed Argon gas on the Schlenk line for at least 30 minutes at 4 °C. Solid ferrous ammonium sulfate was made anaerobic by pumping at 10-3 Torr for 30 minutes.
Preparation of apo R2-WT, R2-Y122F/Y356F, and R2-W48A
The apo form of R2-WT, Y122F/Y356F and W48A variants was overexpressed, purified, and characterized as previously reported.54-59
Preparation of Intermediate X RFQ-MCD and RFQ-EPR samples
The preparation of differous R2 cluster was carried out under strictly anaerobic conditions in an argon filled Vacuum Atmospheres Company (Hawthorne, CA) glove box (< 1 ppm O2). Once apo protein samples (1.0-1.6 mM) were deoxygenated on a Schlenk line at 4 °C, they were preloaded with 3.3-3.5 equivalents of FeII (ferrous ammonium sulfate) dissolved in an anaerobic solution of 5 mM H2SO4 (neutralized with excess buffer), both with and without 5 mM ascorbate. The samples were allowed to equilibrate for 5 minutes prior to loading into a RFQ syringe. The second RFQ syringe was loaded with an O2-saturated 100 mM HEPES buffer (1.5 mM O2, 4 °C). All RFQ samples were prepared using Update Instruments System 1000 (Madison, WI) equipped with a Wiskind Grid Mixer and a spraying nozzle. Intermediate X was generated by quenching 20-50 μL of the anaerobic diferrous R2-WT, R2-Y122F/Y356F, and R2-W48A enzyme against an equal volume of O2-saturated 100 mM HEPES buffer, pH = 7.6. This step was repeated multiple times to accumulate enough sample for MCD and EPR. The samples were freeze-quenched by spraying directly into liquid nitrogen or into liquid nitrogen cooled isopentane at −140 °C using appropriate reaction times (100-125 ms for R2-WT at 5 °C, 70-100 ms at 11 °C for R2-Y122F/Y356F, and 350-450 ms at 5 °C for R2-W48A). These aging reaction times used for trapping X were chosen based on previous stopped-flow kinetic studies.57-59 The samples of R2-W48A variant also contained 10% glycerol. The best results were achieved by freeze-quenching ~20-50 μL of the reaction mixture (diferrous protein samples and O2-saturated 100 mM HEPES buffer, pH = 7.6). A wide mouth shallow liquid nitrogen container was used for quenching the samples directly in liquid nitrogen by placing the spraying nozzle ~5 mm above the surface of the liquid nitrogen. The reaction was initiated immediately upon placing the spraying nozzle in its position. After mixing, samples were ejected rapidly from the spray nozzle, freezing before rising to the surface of the liquid nitrogen (the samples came into contact with the walls of dewar only after freezing). The frozen samples are small, flat ice crystals (~2-3 mm in size; in contrast samples frozen in chilled isopentane formed a slurry). Higher ram velocities (up to 3.2 cm/s) produced the best quality crystals. The reproducibility was verified by repeating the experiment for each sample numerous times (all the spectra shown are a result of at least eight independent experiments). Freezing samples of R2 in chilled isopentane (-140 °C) led to the formation of poor glasses (with light depolarization of ~10-15%) that limit the measurements of quantitative MCD spectral data. However, MCD spectra collected for corresponding samples frozen in liquid N2 and isopentane were identical (see Figures S3 and S4 in Supporting Information). RFQ frozen samples required for EPR analysis were packed into 4 mm quartz EPR tubes using long packers. The protocol for generation of an RFQ-MCD sample was described previously.38 In brief, the frozen crystals of the intermediate were crushed into a fine powder in a container immersed in liquid nitrogen and then mixed thoroughly with glycerol (pre-measured volume) at −30 °C in dry ice/ethanol bath until a homogeneous sample was obtained. To ensure homogeneity of the RFQ-MCD samples, the light beam in the MCD experiments was focused on at least ten different regions of each MCD sample glass and independent spectra were recorded. The MCD cell was carefully assembled on dry ice (two brass pieces with the 3.2 mm neoprene spacer and two infrasil quartz disks) with the intermediate frozen ice crystals/glycerol mixed paste being distributed evenly over the quartz disk of the MCD cell. The paste of intermediate X was then sandwiched between the two quartz disks and the cell quickly frozen in liquid nitrogen. All RFQ-MCD samples of intermediate X contained ~60-70% glycerol and the final samples ranged in Fe concentration from 0.3-0.8 mM. The whole MCD sample preparation took on average 2-3 minutes. The stability of X in R2-WT and the two R2 variants was tested by monitoring the EPR signal of X over a 2-15 minute time course at −30 °C since all RFQ-MCD sample were prepared at this temperature.
RFQ-EPR Experiments
All X-band (9.3 GHz) EPR spectra were obtained with a Bruker ER 220-D-SRC spectrometer equipped with an Air Products Model LTR Helitran liquid helium transfer refrigerator and a Lake Shore Cryotronics temperature controller model DTC-500 and an ESR-900 helium flow cryostat. The EPR signals were monitored at different temperatures ranging from 100 – 3 K using an ESR-900 cryostat and an external vacuum pump for temperatures below 4.2 K. Specific sample conditions and spectrometer conditions are given in figure legends. Spin quantitation of EPR samples was determined from integrated EPR signal intensities using 1 mM copper perchlorate as a standard.
RFQ-MCD Spectroscopy
MCD spectra were recorded on JASCO J810 (UV-visible region) and J200 (NIR region) spectropolarimeters, each equipped with an Oxford Instruments SM4-7T superconducting magnetocryostat capable of magnetic fields up to 8 T and 7 T respectively and temperatures down to 1.4 K, using an S-20 photomultiplier tube (UV-vis, 900-300 nm) and a liquid-nitrogen cooled InSb solid state detector (NIR, 2000-600 nm). All MCD samples were checked for light depolarization effects by comparing the CD signal of a nickel (+)-tartrate solution placed before and after the sample. The depolarization was < 5% at 1.8 K for all samples. All LT absorption and MCD spectra were simultaneously fit to Gaussian band shapes using the program PeakFit version 4 (AISN Software Inc.). VTVH MCD data were fit using an in-house program, which minimizes the χ2 value by fitting the effective transition moment products with either a Simplex or a Levenberg-Marquadt algorithm with a spin Hamiltonian for the ground state Kramer’s doublet S = 1/2.60
LT Absorption Spectroscopy
Low temperature absorption spectra were collected on a Cary-17 double-beam spectrometer equipped with a Janis Super Vari-Temp liquid helium cryostat at 10.0 K.
Computational
All density functional theory (DFT) calculations were performed on dual-CPU Pentium Xeon 2.8 GHz work stations employing spin-unrestricted (SU) and broken symmetry (BS) methods61-63 to allow for a reasonable description of the electronic structure of antiferromagnetically coupled systems. All three models were geometry optimized using the Amsterdam Density Functional (ADF) program, version 2003.01 developed by Baerends et al.64,65 A triple-ζ Slater-type orbital basis set (ADF basis set TZP) with a single polarization function at the local density approximation of Vosko, Wilk, and Nusair66 with nonlocal gradient corrections of Becke and Perdew (BP86)67,68 were employed. The molecular orbitals were plotted using gOpenMol version 2.32 and Molden version 4.1. ΔSCF and Slater transition state methods were employed using ADF. The Mulliken population analyses were performed using the AOMix69 and PyMolyze70 programs. Time-dependent DFT (TD-DFT) calculations were performed with the Gaussian 03 package.71 A 6-311G* basis-set was used for all atoms with the local density approximation of Vosko, Wilk, and Nusair66 and the nonlocal gradient corrections of Becke and Perdew (BP86).67,68 In all models, the single high-spin Fe / antiferromagnetic (AF) state was initially converged with smaller basis-sets (i.e. 3-21G*), which was used as the initial guess for larger basis-sets (i.e. 6-311G*). The high-spin AF state for all models was found to be lower in energy than the low-spin AF state. Complete coordinates of all the geometry-optimized models discussed in the text are included in Supporting Information (Tables S1-S3).
3. Results
3.1 EPR Characterization of RFQ Samples
All the RFQ-MCD samples of X used in the analysis were characterized by RFQ-EPR spectroscopy to establish the % X and % Y122• present. Figure 2 shows the comparison of the EPR spectra of X trapped in R2-WT and the two variants Y122F/Y356F and W48A, with their corresponding decayed X spectra. The characteristic signal of X observed in both R2-WT (Figure 2A) and the double variant (Figure 2C) is typical of a system with the ground state Stot = 1/2 and nearly isotropic g = 2.0 value. The aging times (110-125 ms) used for formation of X in the R2-WT enzyme allowed for maximum amounts of X to be formed with as little of decayed products as possible, but variable amounts of the reaction product, Y122• were also detected (from 28-42%). This was unavoidable for the R2-WT reaction since the MCD sample manipulations were carried out at −30 °C following RFQ trapping in order to obtain good-quality optical samples of X. The X intermediate was found to decay faster in the R2-WT enzyme than in the two R2 variants.
Figure 2.
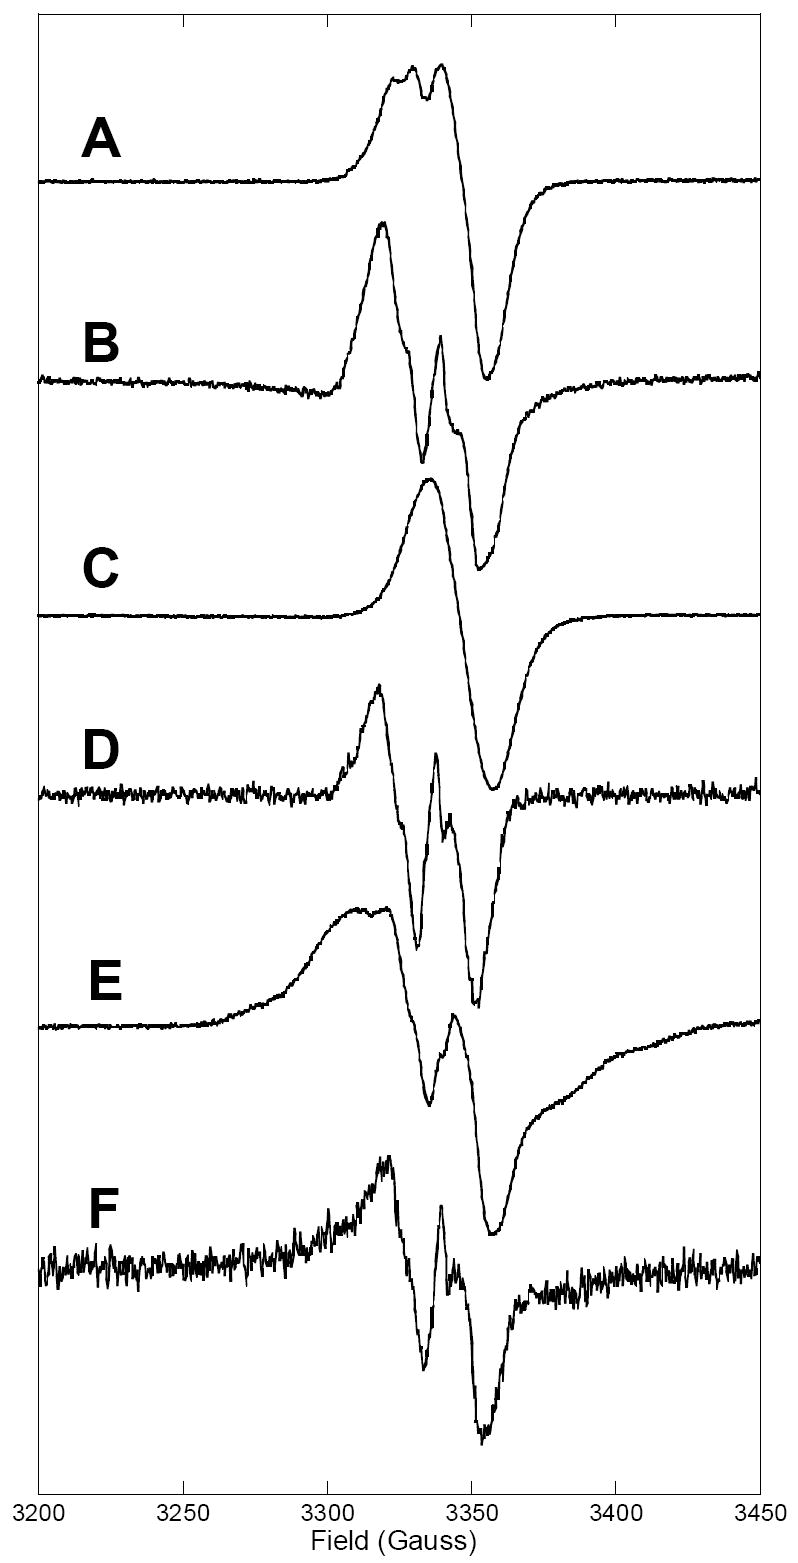
RFQ-EPR spectra of (A) the intermediate X in R2-WT (relative ratio of X and Y122• 0.62:0.42), (C) in R2-Y122F/Y356F (98-100% X), and (E) the X-Y• (79%) diradical species, formed in the reaction of apo enzymes with FeII and O2, in comparison with EPR spectra of decayed intermediate X in R2-WT, R2-Y122F/Y356F, and R2-W48A (B, D, and F). The EPR spectra of decayed X were obtained by allowing the samples of X to thaw at room temperature for 10 minutes prior to freezing in liquid nitrogen. The spectrometer conditions for data acquisition were: microwave frequency 9.38 GHz, temperature 3.0 K, microwave power 10 μW, modulation frequency 100 KHz, modulation amplitude 4 G, and receiver gain of 2.24 × 10⁴.
Figure 2A shows the EPR spectrum of X in R2-WT containing 62% ± 2% X and 38% ± 2% Y122•. The 10-minute time-point of the reaction was used as a reference spectrum of magnetically isolated Y122• (see Figure 2B). A freeze-quenched sample from the reaction of double variant with O2 was used as a reference sample for X as its kinetics of X formation and decay are such that pure X accumulates in high yields (1.4 equiv) without contamination from Y122• (Figure 2C). A slight excess of dithionite was used to eliminate any W48+• species, which can accumulate by supplying an additional electron to form X under reductant-limiting conditions. The EPR spectrum of decayed X in the double variant is characteristic of a tyrosyl radical (Figure 2D). Finally, the EPR spectrum of X in the W48A variant exhibits a unique feature with a broader g = 2.0 signal (Figure 2E). This EPR signal is attributed to a coupled biradical species containing both X and Y122•. This EPR spectrum is not the same as magnetically isolated intermediate X or isolated Y122• indicating a weak interaction of the two paramagnetic species, X and Y122•.54,72 Subsequent decay of X-Y122• in W48A gives an EPR spectrum characteristic of isolated Y122• (Figure 2F). EPR spin quantitation for the W48A variant indicates that ~0.25 equivalents of stable Y122• are formed at the end of the reaction.
3.2 Low-Temperature Absorption and MCD Spectroscopy of Intermediate X
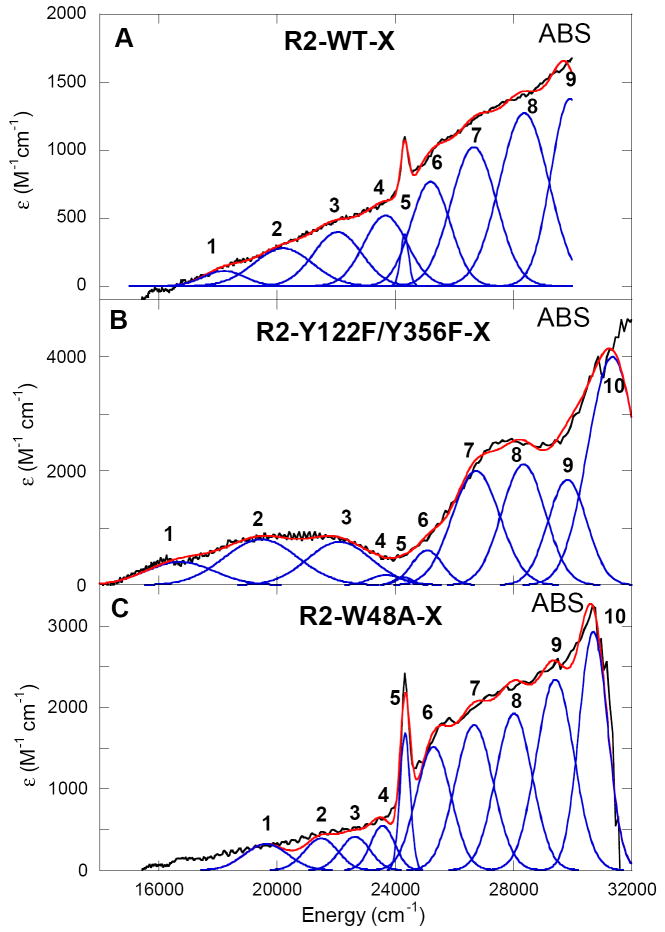
The low-temperature (LT) absorption spectra of X in R2-WT, R2-Y122F/Y356F, and R2-W48A are shown in Figure 3. The predominant spectral features of intermediate X in the 10 K absorption spectrum occur in the high-energy region centered at ~27 800 cm-1 (ε ≈ 2800 M-1cm-1) with a steep increase in intensity starting at ~31 000 cm-1 (ε ≈ 4000 M-1cm-1). There is also a rather weak tailing absorption feature at ~20 000 cm-1 (ε ≈ 900 M-1cm-1). In the case of the R2-W48A variant, there is also a sharp feature in the absorption spectrum at ~24 000 cm-1 (Figure 3C) indicative of the presence of Y122• that is weakly spin coupled to X (vide supra). A smaller similar sharp feature is present in the absorption spectrum of R2-WT-X (Figure 3A), but here the amount of Y122• species correlates with the amount of decayed X quantitated by EPR. Consistent with the EPR results in Figure 2, no sharp Y122• feature is present in the absorption spectrum of X for the R2-Y122F/Y356F variant.
Figure 3.
Low temperature (10 K) absorption spectra of intermediate X in (A) R2-WT, (B) R2-Y122F/Y356F, and (C) R2-W48A with simultaneous Gaussian fitting with their respective MCD data.
The 10 K absorption spectra of decayed X in R2-WT reaction and the two R2 variants are shown in Supporting Information (Figure S1). Decay of X generates a μ-oxo bridged diferric cluster (broad absorption bands at ~31 250 and ~27 000 cm-1) and the tyrosyl radical characterized by a sharp feature at ~24 330 cm-1. The high-energy absorption features of X are difficult to differentiate from those attributed to decayed X (particularly in WT) since both X and the diferric cluster absorb in the region of ~27 000 – 28 000 cm-1 and the primary difference lies in the kinetics of the band formation and disappearance. However, MCD spectroscopy allows for a complete differentiation of these bands, as the diferric cluster is not paramagnetic and will not exhibit intense LT MCD features (C-terms). Since intermediate X is paramagnetic, it shows an intense VTVH MCD signal.
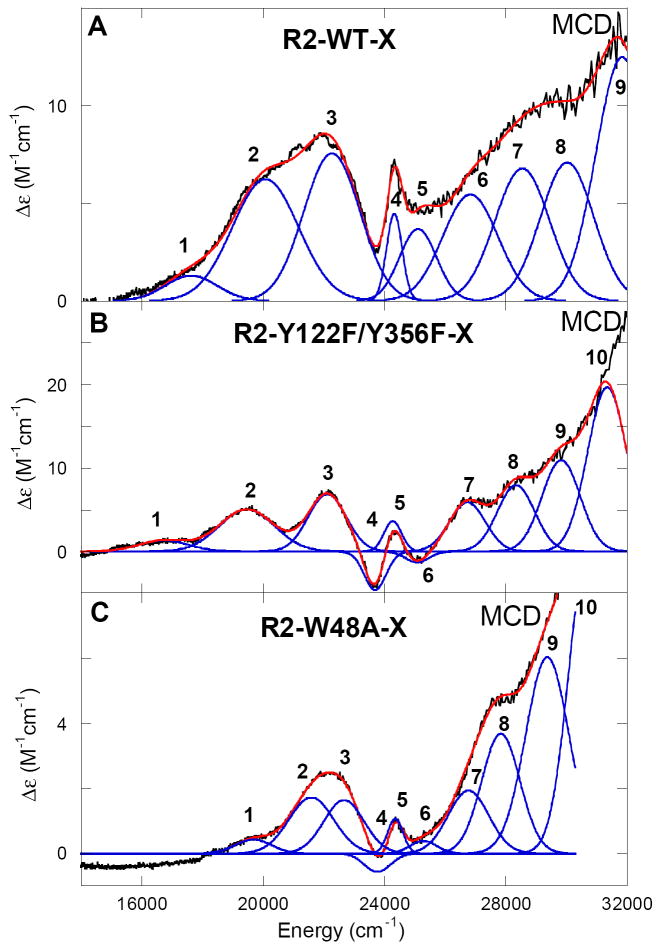
Figure 4 displays the low-temperature MCD spectra of X in R2-WT, R2-Y122F/Y356F, and R2-W48A. Figures 3B and 4B reproduce the absorption and MCD data obtained previously on R2-Y122F/Y356F-X. There is a good correlation of band signs, energies, and shapes between the three MCD spectra of intermediate X, and these can be correlated to the features observed in the absorption spectra. The simultaneous Gaussian fitting of the MCD with the LT absorption data results in 10 electronic transitions in the region from 5000 to 33 300 cm-1 (Table 1, note that no transitions are observed in the NIR region below 14 000 cm-1 associated with intermediate X). The LT-MCD data show an apparent large deviation from the MCD “sum rule” (equal and opposite signed LT-MCD intensity) and the deviation requires spin-orbit coupling of low-lying excited states into the ground state. The MCD and absorption spectra have been divided into three regions based on the intensities and C0/D0 ratios for X in R2-WT and the two R2 variants. C0/D0 ratios (C0/D0 = kBT/μBB (Δε/ε)max where kB is the Boltzmann’s constant, μB is the Bohr magneton (kB/μB = 1.489 K-1 T-1), T is the temperature in K, ε is the molar absorptivity in M-1 cm-1, and Δε is the MCD intensity maximum in M-1 cm-1 recorded in the linear 1/T region) are used to differentiate metal-based ligand field (d → d transitions) from ligand-based charge transfer (CT) transitions. Since the spin-orbit coupling constant for the FeIV is much higher (ξFeIV = 520 cm-1) than for the oxygen (60-70 cm-1) or nitrogen (50 cm-1) ligands, the d → d LF transitions are expected to have higher C0/D0 ratios as they are centered on the FeIV of intermediate X.73,74 Region I (bands 1-3 in Figures 3 and 4) displays the most intense features in the MCD spectrum of X, with high C0/D0 ratios from 0.012-0.050 (i.e. high MCD, but weak absorption intensity). Thus, these three bands (bands 1-3) can be assigned as the spin-allowed ligand field transitions of the high-spin FeIV, supporting significant FeIV character in the paramagnetic center of X.
Figure 4.
Low temperature RFQ-MCD (1.8 K, 7 T) spectra of intermediate X in (A) R2-WT, (B) R2-Y122F/Y356F, and (C) R2-W48A with simultaneous Gaussian fitting with their respective absorption spectra.
Table 1.
Experimental transition energies (cm-1), C0/D0 ratio and assignment of intermediate X transitions in (a) wild-type; (b) Y122F/Y356F; and (c) W48A. Fit parameters were determined using simultaneous Gaussian resolution of the LT absorption and MCD spectra, from Figures 3 and 4.
| (a) wild-type | (b) Y122F/Y356F | (c) W48A | |||
|---|---|---|---|---|---|
| Band | νmax (cm-1) | νmax (cm-1) | νmax (cm-1) | C0/D0 | Assignment |
| 1 | 17 630 | 16 700 | 19 680 | 0.0062 | FeIV d → d |
| 2 | 20 080 | 19 460 | 21 590 | 0.0117 | FeIV d → d |
| 3 | 22 260 | 22 100 | 22 660 | 0.0170 | FeIV d → d |
| 4 | 23 530 | 23 690 | 23 760 | 0.0492 | FeIV d → d spin-flip |
| 5 | 24 320 | 24 270 | 24 360 | 0.0502 | FeIV d → d spin-flip |
| 6 | 25 110 | 25 080 | 25 280 | 0.0040 | Oxo → FeIV |
| 7 | 26 830 | 26 730 | 26 770 | 0.0055 | Oxo → FeIV |
| 8 | 28 540 | 28 340 | 27 840 | 0.0069 | Oxo → FeIV |
| 9 | 30 020 | 29 820 | 29 370 | 0.0110 | Oxo → FeIII or FeIV |
| 10 | 31 840 | 31 350 | 30 670 | 0.0092 | Oxo → FeIII or FeIV |
Region II (bands 4 and 5) involves spin-forbidden LF transitions (ΔS = 1 spin-flip transitions). These sharp but weak MCD bands are observed between 23 000 and 24 500 cm-1 and do not vary over any of the MCD spectra for X in R2-WT and the two variants. Based on the energy and bandwidth these transitions could be assigned to either a spin flip on the FeIII or FeIV center. The ligand field independent spin-forbidden transitions gain some intensity in coupled dimers through the exchange interaction associated with the bridging ligand (vide infra). The ligand field independent spin flips of an FeIII center (involving the 6A1 → 4A1, 4E transitions) are well known to occur in the region of ~21 000 cm-1 in mono-μ-oxo ferric dimers and in the region 17 700 – 19 100 cm-1 for bis-μ-oxo ferric dimers.75 Bands 4 and 5 are too high in energy to be attributed to FeIII spin flips and are thus assigned as ligand field independent spin-forbidden transitions (5E → 3T1) on the FeIV.
Region III (bands 6-10) involves transitions at ≥ 25 000 cm-1 with low C0/D0 ratios from 0.004 – 0.011 (i.e. weak MCD, but strong absorption) and are thus assigned as oxo to FeIV and oxo to FeIII CT transitions. Oxo → FeIV transitions are anticipated to be at a lower energy relative to oxo → FeIII CT due to the increased Zeff. Modestly intense oxo → FeIII CT transitions in mono-μ-oxo ferric dimers are observed at ≥ 28 000 cm-1.75 Jorgensen’s optical electronegativity differences between the donor and acceptor orbitals can be used to estimate charge transfer transition energies.76 Using rough estimates of optical electronegativities (χopt) for high-spin FeIV (χopt(FeIV) = 2.8-3.2) and a bridging oxo ligand (χopt(O2-) = 3.6-3.8) in the following expression:
νCT = 30 000 [χopt(O2-) - χopt(FeIV)] cm-1 (LMCT),
calculates the oxo → FeIV CT transitions in the range of 24 000 – 28 000 cm-1. The same expression for high-spin FeIII (χopt(FeIII) = 2.5-2.7) gives oxo → FeIII CT transitions in the range of 27 000 – 33 000 cm-1. Therefore, it is reasonable to assume that bands 6 and 7 and possibly 8 in the MCD spectrum of X can be assigned as oxo → FeIV CT transitions and that the higher energy transitions could correspond to oxo → FeIII CT transitions. However, this approach assumes the FeIII-oxo and the FeIV-oxo bonding are mutually exclusive and neglects covalency effects over the entire FeIII–O–FeIV dimer unit (vide infra).
The absorption and MCD spectra of decayed X in R2-WT and the two variants are given in Supporting Information (Figure S1 and S2). These spectra are distinctly different from those of intermediate X in Figure 4, and provide additional evidence for the assignment of the spectral features in Figure 4 as due solely to X. The tyrosyl radical and μ-oxo bridged diferric cluster are the major decay products of X with tyrosyl radical being the primary paramagnetic component. The MCD spectrum of decayed X in R2-WT enzyme exhibits a feature at ~24 300 cm-1 due to tyrosyl radical formation (note that this feature is different from that observed in this energy region for X). There is also a broad negative feature observed at ~20 000 cm-1 which is due to some paramagnetic decay contribution, not yet identified. The high energy band at ~30 000 cm-1 is temperature independent (B-term MCD intensity) and arises from the diamagnetic contribution of the oxo-bridged diferric cluster. The decayed X of the R2-Y122F/Y356F variant exhibits the characteristic tyrosyl radical feature at ~ 24 300 cm-1 and the high-energy band at ~ 30 000 cm-1 which is also temperature independent.28-30
The decayed X in R2-W48A variant is characterized by a broad negative feature at 15 000 – 20 000 cm-1 and a broad positive, temperature independent feature at 25 000 – 30 000 cm-1 which is associated with the diamagnetic decayed diferric cluster. The tyrosyl radical feature is not obvious in this spectrum as it is very weak and masked by the broad negative and positive features. Importantly, the MCD spectra of decayed X in Figure S2 clearly display different features from those attributed to X. Given that the spin-orbit coupling constant for the tyrosyl radical is small, this at most contributes a small feature to the MCD spectrum of decayed X. The MCD features of intermediate X assigned as spin flips (bands 4 and 5) in Figure 4 are present even after subtraction of the tyrosyl radical contribution in R2-WT enzyme and are present in the MCD spectrum of Y122F/Y356F-X, which does not contain a contribution from the tyrosyl radical (from EPR).
Finally, it is important to note for Figures 3 and 4, that while R2-WT-X and R2-Y122F/Y356F-X exhibit similar energies for the three spin allowed d-d transitions of the FeIV center, the d-d transitions in the R2-W48A-X (Figure 4C) are shifted to higher energy and display a smaller energy separation of bands 1-3.
3.3 Variable Temperature Variable Field (VTVH) MCD
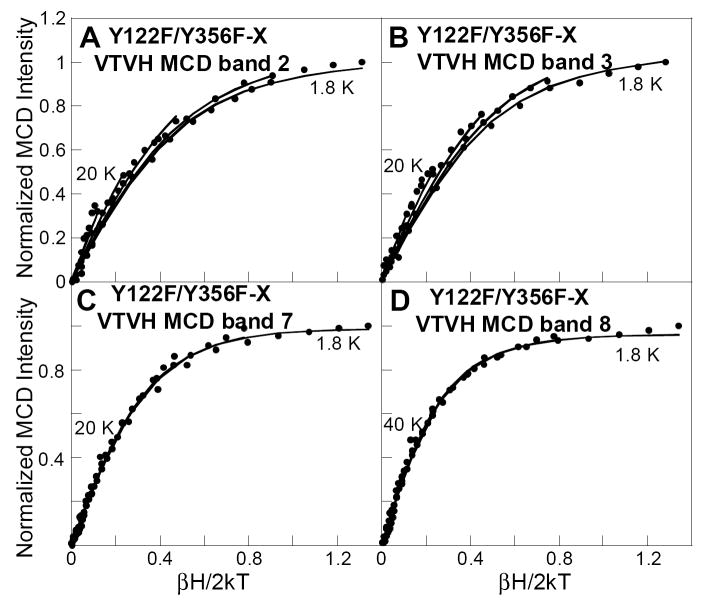
VTVH-MCD data were collected for R2-WT and the two variant forms of intermediate X. R2-Y122F/Y356F X displays the most well resolved MCD transitions for VTVH analysis, Figure 4. The VTVH-MCD data for R2-Y122F/Y356F X were collected at four different bands as presented in Figure 5. All the saturation magnetization curves (MCD intensity as a function of βH/2kT) recorded at various magnetic fields and at a series of temperatures from 1.8-40 K overlay within standard deviation and thus do not display any nesting behavior. These isotherms are dependent on the Stot of the ground state and were fit using the EPR parameters of X (g∥ = 2.006 and g⊥ = 1.994), resulting in spin Hamiltonian parameters characteristic for an isotropic ground state with an isolated S = 1/2 for all bands.
Figure 5.
VTVH MCD data of X in R2-Y122F/Y356F variant showing unnested saturation behavior within experimental standard deviation: (A) band 2 at 19 230 cm-1, (B) band 3 at 22 220 cm-1, (C) band 7 at 26 810 cm-1, and (D) band 8 at 28 740 cm-1 at 1.8, 3.0, 5.0, 10, 20 K, and 40 K. The magnetization data were fit with a spin Hamiltonian for a S =1/2 ground state Kramer’s doublet.60
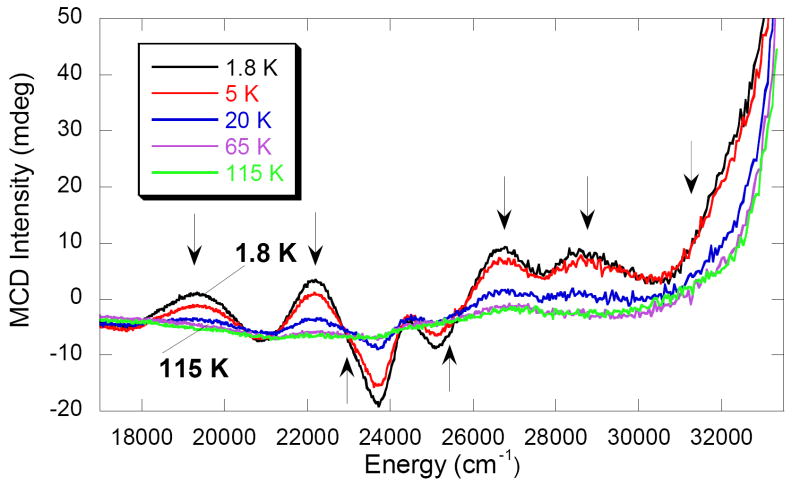
The temperature dependence of the full MCD spectra of X for both the R2-Y122F/Y356F and R2-W48A variants, ranging from 1.8 K to 170 K at high field (7 T) were collected. Figure 6 shows the 7-T MCD spectrum of intermediate X in the R2-Y122F/Y356F variant over the energy region of 17 000 – 33 000 cm-1 between 1.8 K and 115 K. The variable temperature MCD data exhibit typical C-term behavior with the signal intensity decreasing as 1/T with increasing temperature. This behavior is observed for all the spectral features of intermediate X.
Figure 6.
Temperature dependence of MCD signal of intermediate X in R2-Y122F/Y356F. All MCD bands decrease in intensity with increase in temperature indicative of C-term MCD behavior.
Since the MCD signal intensity of all bands decreases linearly as 1/T for temperatures up to 115 K, it can be concluded that there is no thermally accessible low-lying excited sublevel of the Stot = 1/2 ground state of intermediate X. The energy splitting of the ground state is described by a phenomenological spin Hamiltonian, H = -2JS1·S2, where S represents the spin on each iron and J is the exchange coupling constant. A two-level Boltzmann distribution yields a ΔE > 110 cm-1 between the two levels with a population of < 20% population of the excited state, at a temperature of 115 K. The lack of an observable thermally accessible (at 115 K) Stot = 3/2 excited state indicates a strong antiferromagnetically coupled FeIII-O-FeIV dimer, giving a lower-limit on the magnitude of the exchange coupling of -3J > 110 cm-1.
4. Analysis
Our preliminary report on the RFQ-MCD of X in Y122F/Y356F used a quantitative assessment of the FeIV ligand field to support that intermediate X contained a single oxo bridge,38 consistent with 17O – O2 and H2O ENDOR data.40 The ligand field analysis argued against the possibility of a bis-μ-oxo core structure due to the larger equatorial ligand field oxo bonds which leads to a larger splitting of the FeIV d-d transitions compared with the mono-μ-oxo splitting. The larger splitting of the bis-μ-oxo would shift the FeIV d-d transitions to higher energy than the relatively low energy d-d transitions observed in intermediate X. These LF calculations were calibrated based on absorption and MCD data from mono- and bis-μ-oxo binuclear Mn systems.77-79
This study extends the initial ligand field analysis to include covalency effects and π- as well as σ-bonding interactions from the bridging oxo ligand(s) through the use of DFT calculations combined with perturbations on the spectral data of X in the two variants and WT (section 5). This computational approach was used to explore the electronic and geometric structure differences between three possible structural models for X (mono-μ-oxo, μ-oxo/μ-hydroxo and the bis-μ-oxo bridged species). Furthermore, TD-DFT, Slater and ΔSCF transition state methods were used to calculate the FeIV d-d transitions within these three models and correlate their energies and intensities to those observed by RFQ-MCD for intermediate X in the WT R2, as well as the structurally perturbed forms of X in the two variants (section 5).
4.1 DFT: Geometry Optimizations
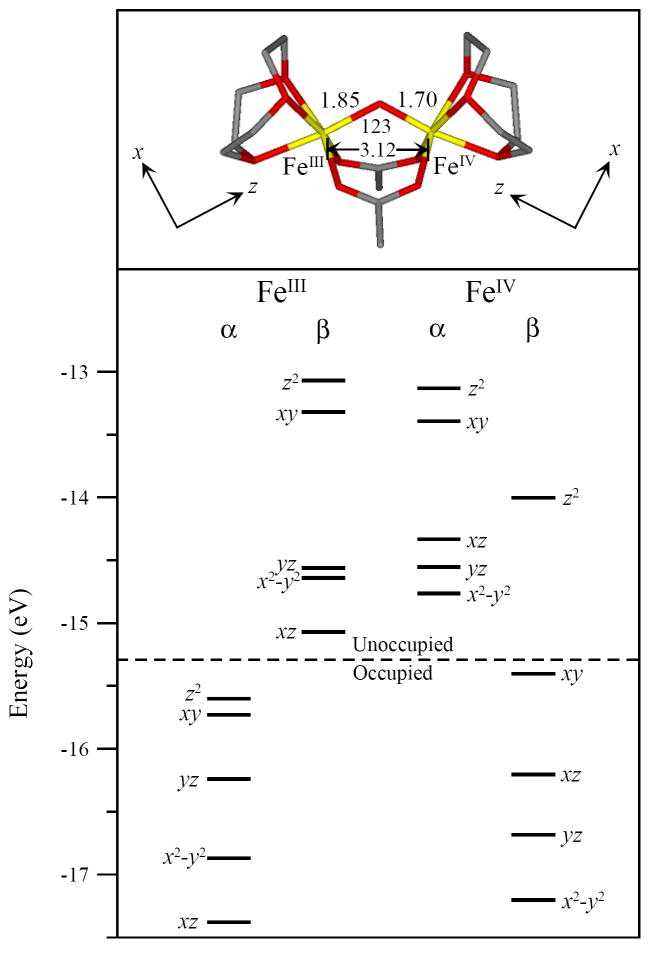
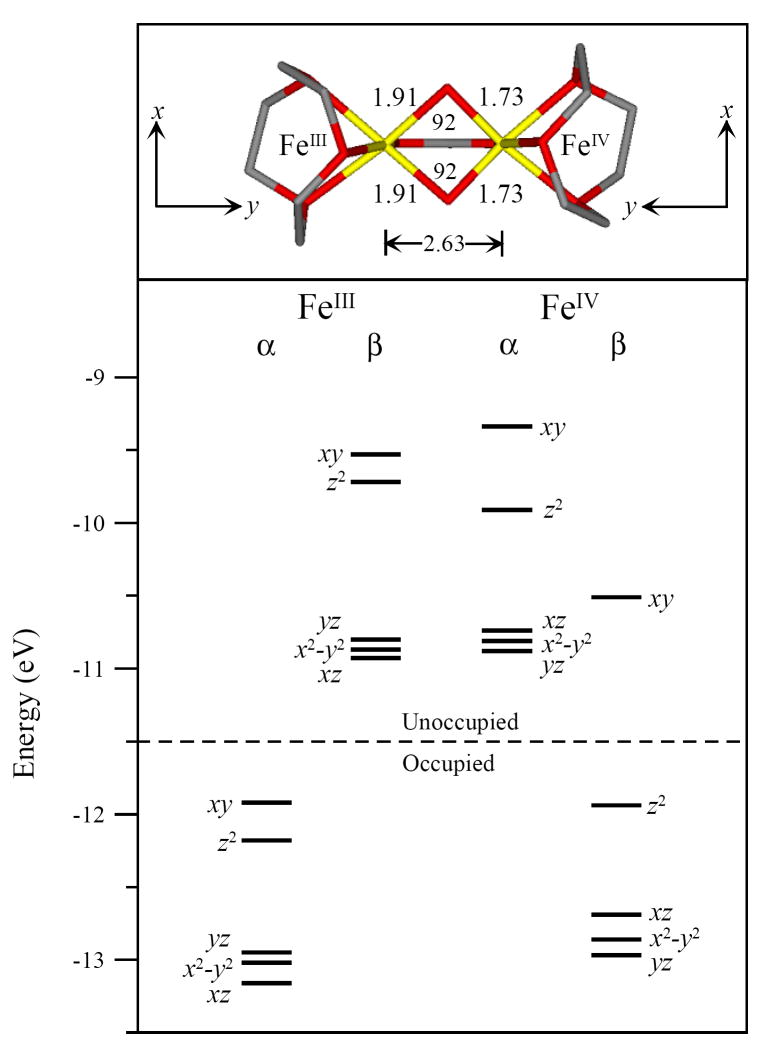
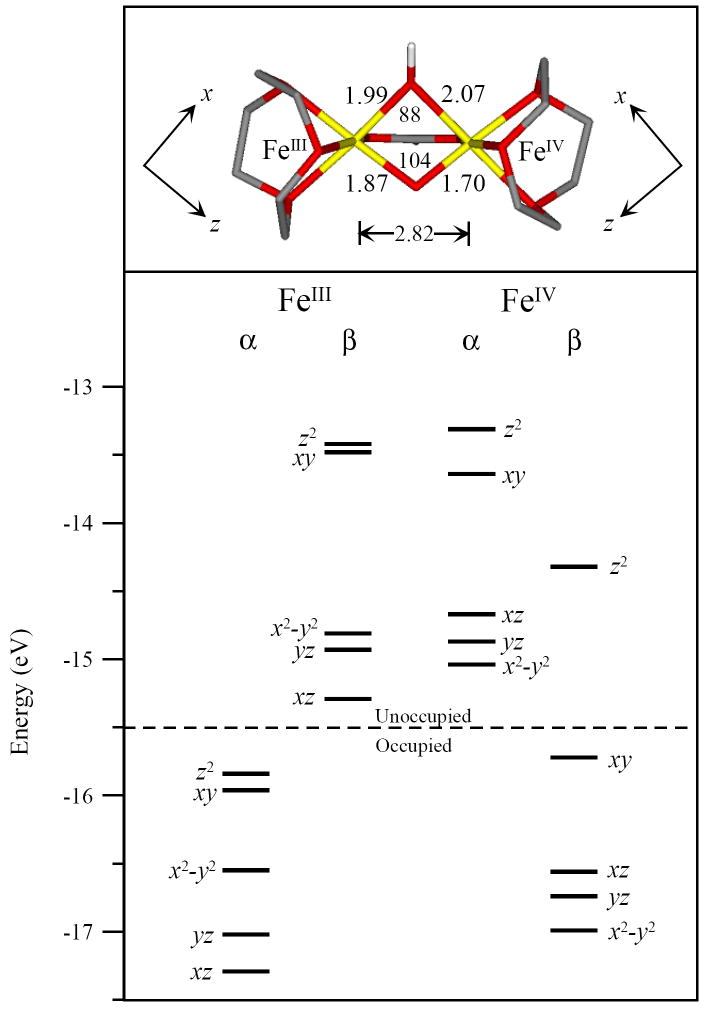
Previous structural assignments for intermediate X have primarily focused on either a mono- or bis-μ-oxo core structure, based on EPR,18 ENDOR,39,40 EXAFS,37 Mössbauer28 and MCD38 spectroscopies as well as DFT calculations.33,42-49,51-53,80 The μ-oxo/μ-hydroxo core structure is also included here as it has been generated in diferric model complexes81 as well as explored by DFT,51 but has not been considered thus far as a viable structure for intermediate X. This structure would have one strong oxo bridge, but a short Fe – Fe distance associated with two mono atomic bridging ligands, as observed in EXAFS.37 The tops of Figures 7 – 9 display the three possible geometric core structures of intermediate X evaluated here: mono-μ-oxo, [FeIII(μ-O)FeIV]; μ-oxo/μ-hydroxo, [FeIII(μ-O)(μ-OH)FeIV]; and bis-μ-oxo, [FeIII(μ-O)2FeIV], respectively.
Figure 7.
Energy level diagram of the Stot=1/2 unrestricted DFT geometry optimized mono-μ-oxo, [FeIII(μ-O)FeIV] core structure. The top portion displays the mono-μ-oxo structure with Fe-O and Fe-Fe distance and angle data. Local coordinate frames are displayed for each iron. Ligand hydrogens are omitted for clarity.
Figure 9.
Energy level diagram of the Stot=1/2 unrestricted DFT geometry optimized bis-μ-oxo, [FeIII(μ-O)2FeIV] core structure. The top portion displays the bis-μ-oxo structure with Fe-O and Fe-Fe distance and angle data. Local coordinate frames are displayed for each iron. Ligand hydrogens are omitted for clarity.
While there is a small number of high-valent binuclear iron oxo model systems available, only one has been structurally characterized,82 and none of these models has the correct high-spin state for each iron as found in intermediate X. Therefore, the computational models presented here were based on similar diferric and dimanganese model structures, with an effort to keep the non-oxo ligands identical. The mono-μ-oxo structure was based on the structurally characterized [(FeIII)2(μ-O)([9]aneN3)2(μ-CH3CO2)2]3+ complex of Wieghardt et al.83 The electronic structure of this complex consists of two high-spin FeIII (S = 5/2) atoms antiferromagnetically coupled to yield an overall S = 0 ground state. The DFT geometry optimization of this complex led to a final structure that paralleled the geometric and electronic structure of the actual complex. However, upon the computational removal of one electron from the geometry optimized FeIII2 complex, the oxidized complex reoptimized to a low-spin FeIII S = 1/2 and low-spin FeIV S = 1 antiferromagnetically coupled system. This result is consistent with the experimental electrochemical results for this oxidized complex, which yielded a 35:65 mixture of S = 1/2 and S = 3/2 species.84 The Mössbauer and EPR results from this complex were ambiguous as to the nature of the FeIV spin-state.
The μ-oxo/μ-hydroxo and bis-μ-oxo models were based on the structurally characterized [MnIII(μ-O)2MnIV([9]aneN3)2(μ-CH3CO2)]2+ complex and differ by one proton bound to an oxo bridge.79 Similar spin-state issues (these complexes energetically optimized to a low-spin state on each iron) were also encountered for these models. The FeIV spin-state plays an important role in defining the geometric and electronic structure of the complex, which determines its reactivity. Therefore, a weaker ligand set was chosen for all three structures to maintain high-spin states on both irons and to preserve their structural consistency. The nitrogen-based [9]aneN3 ligand set was replaced with a weaker oxygen-based 9-crown-3 ether ligand set. This ligand change resulted in the three computational models shown in Figures 7-9. With this ligand modification, all three models geometry optimized to minimum energy complexes, which maintained high-spin FeIII S = 5/2 antiferromagnetically coupled to a high-spin FeIV S = 2 to yield Stot = 1/2 ground states. The mono-μ-oxo structure was the only complex which needed to be geometry optimized to the ferromagnetic Stot = 9/2 state first, and then reoptimized under broken symmetry (BS) to converge to the lower energy antiferromagnetically coupled high-spin state. The other structures were also geometry optimized to ferromagnetically coupled Stot = 9/2 states, which were at higher energy than the Stot = 1/2 for all three complexes.
4.2 DFT: Ground State Geometric and Electronic Structure
Figures 7, 8 and 9 display a geometry optimized structure and energy level diagram for each of the three possible structural models of intermediate X. The comparison of these calculated structures to the experimental data of intermediate X provides a reasonable basis for the evaluation of the geometric and electronic structure of X.
Figure 8.
Energy level diagram of the Stot=1/2 unrestricted DFT geometry optimized μ-oxo/μ-hydroxo, [FeIII(μ-O)(μ-OH)FeIV] core structure. The top portion displays the μ-oxo/μ-hydroxo structure with Fe-O and Fe-Fe distance and angle data. Local coordinate frames are displayed for each iron. Non-oxo ligand hydrogens are omitted for clarity.
While all three structures maintain a high-spin FeIII (S = 5/2) and FeIV (S = 2) antiferromagnetically coupled to yield an Stot = 1/2 ground state, their geometric and electronic structures vary. The mono-μ-oxo and μ-oxo/μ-hydroxo structures display the shorter FeIV–Ooxo distance of 1.70 Å, while the bis-μ-oxo structure displays two FeIV–Ooxo distances of 1.73 Å. However, all three bridged structures have longer distances than the experimentally well defined (TMC-NCMe)FeIV=O (S = 1) complex with a terminal oxo, which has a relatively short FeIV–Ooxo distance of 1.65 Å.85 The FeIII–O–FeIV angle decreases from the mono-μ-oxo to the μ-oxo/μ-hydroxo to the bis-μ-oxo; 123°, 104°, and 92° respectively. The FeIII – FeIV distance also decreases from the mono-μ-oxo to the μ-oxo/μ-hydroxo to the bis-μ-oxo; 3.12 Å, 2.82 Å, and 2.63 Å respectively. Parallel to the FeIV–Ooxo distance, the FeIII–Ooxo distance also lengthened from the mono-μ-oxo to the μ-oxo/μ-hydroxo to the bis-μ-oxo structures; 1.85 Å, 1.87 Å, and 1.91 Å respectively.
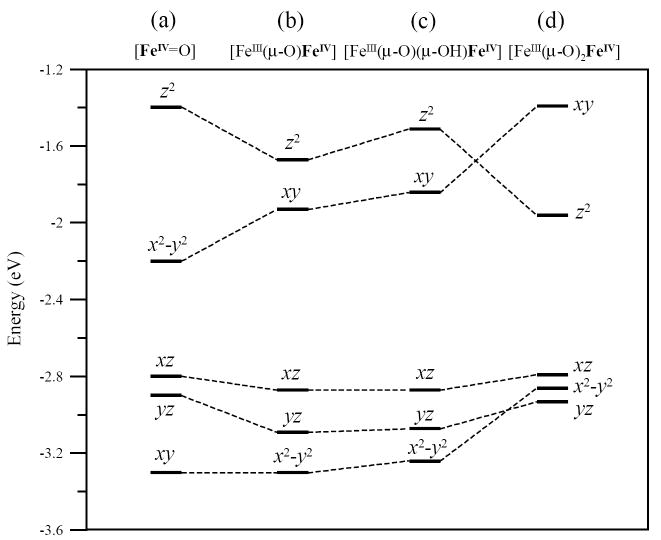
The geometric differences among the three structures are reflected in their electronic structures. Each electronic structure is given by the energy level diagram at the bottom of Figures 7, 8 and 9. These figures display the ground state occupied and unoccupied d-orbital energy levels for each iron. The FeIV has five α unoccupied, four β occupied and one β unoccupied d orbitals. The FeIV 10Dq values (based on the average energy separation between the d-σ* (xy, z2) and d-π* (xz, yz and x2-y2) manifolds for the FeIV β-orbitals) are 16 100 cm-1, 14 100 cm-1 and 13 000 cm-1 for the mono-μ-oxo, μ-oxo/μ-hydroxo and the bis-μ-oxo structures respectively. The three 10Dq values vary by only ~3000 cm-1. The energy splittings of the FeIV d-σ* orbitals are also fairly similar with energies of 11 300 cm-1, 11 300 cm-1, and 11 500 cm-1 for the mono-μ-oxo, μ-oxo/μ-hydroxo and bis-μ-oxo structures respectively. Importantly, the energy splittings of the FeIV d-π* manifold decreased significantly from the mono-μ-oxo to μ-oxo/μ-hydroxo to bis-μ-oxo; 8100 cm-1, 3500 cm-1, and 2300 cm-1 respectively.
The FeIII d-manifolds displayed similar energy changes among the three structures. Interestingly, the FeIII and FeIV d-manifolds appear in nearly the same energy region for all three structures, which reflects a significant amount of covalency within the FeIII–O–FeIV unit (vide infra).
The FeIV d-manifold energy differences reflect changes in the bonding interactions between the FeIV and the core oxo and hydroxo ligand(s). Due to a significant amount of spin-polarization in the β-occupied FeIV d-orbitals, these differences are most easily correlated in the α-unoccupied FeIV d-orbitals, which reflect the un-compensated bonding interactions of the FeIV β-occupied orbitals. Figure 10 summarizes these energy differences, also see Tables 2 and 3. Supplementary Figures S5 and S6 include contours that further dissect the FeIV–Ooxo bonding interactions that give rise to these energy differences. Figure 10 and Tables 2 and 3 also include a hypothetical mononuclear FeIV=O high-spin S = 2 system as a reference.86,87 Figure 10 displays the large energy splitting between the mononuclear FeIV d-σ manifold. This is due to dominant FeIV-Ooxo σ-bonding along the z-axis versus the relatively weaker equatorial ligand field along the x and y axes. This is reflected in the large amount of oxo character in the d(z2) orbital, Tables 2 and 3. In Figure 10b-d and S5, all three binuclear models display a smaller splitting between their FeIV d-σ* orbitals, consistent with their longer FeIV–Ooxo bond lengths. Also, the bent FeIII–O–FeIV angle of 123° in the mono-μ-oxo and 104° in the μ-oxo/μ-hydroxo dimers weakens the FeIV – Opz bond and lowers the energy of the d(z2) orbital in both structures relative to the mononuclear case. (Note that different axis systems are used for the different structures. The z-axis is directed along the FeIV-oxo bond in the mononuclear, binuclear mono-μ-oxo and binuclear μ-oxo/μ-hydroxo cases. The z-axis in the binuclear bis-μ-oxo case is perpendicular to the FeIV-(O)2 plane. The x and y axes bisect the ligand – Fe bonds in the binuclear systems.) The bis-μ-oxo structure has two oxo ligands that impose a stronger equatorial ligand field and increase the energy of the d(xy) orbital. Overall, the FeIV d-σ* splitting is smaller for the binuclear complexes due to the bridged bonding of the oxo that results in a weaker FeIV – Opz bond. The bent nature of the FeIII–O–FeIV unit also weakens the FeIV –Opz bond in the mono-μ-oxo and the μ-oxo/μ-hydroxo complexes.
Figure 10.
Comparison of the unoccupied α FeIV d-orbital energy levels between the (a) mononuclear FeIV=O S=2; (b) mono-μ-oxo, Stot=1/2; (c) μ-oxo/μ-hydroxo, Stot=1/2; and (d) bis-μ-oxo, Stot=1/2 structures.
Table 2.
Energies (eV) and Compositions (%) of the α unoccupied FeIV d-based MOs for mono and binuclear FeIV (a) mono-μ-oxo; (b) μ-oxo/μ-hydroxo and (c) bis-μ-oxo structures.
| Mononuclear Fe
| |||||||
|---|---|---|---|---|---|---|---|
| MO no. | Orbital | E(eV) | FeIV | O | |||
| unoccupied | |||||||
| α 51 | z2 | -1.40 | 53 | 17 | |||
| α 50 | x2-y2 | -2.20 | 74 | 3 | |||
| α 49 | xz | -2.80 | 62 | 33 | |||
| α 48 | yz | -2.90 | 62 | 32 | |||
| α 47 | xy | -3.30 | 81 | 0 | |||
| Binuclear Fe | |||||||
| (a) mono-μ-oxo
| |||||||
| MO no | Orbital | E(eV) | FeIII | FeIV | OA | ||
|
| |||||||
| unoccupied | |||||||
| α 137 | z2 | -13.13 | 1 | 62 | 16 | ||
| α 136 | xy | -13.39 | 0 | 71 | 0 | ||
| α 135 | xz | -14.33 | 10 | 53 | 21 | ||
| α 134 | yz | -14.55 | 2 | 71 | 20 | ||
| α 133 | x2-y2 | -14.76 | 0 | 82 | 0 | ||
| (b) μ-oxo/μ-hydroxo
| |||||||
| MO no. | Orbital | E(eV) | FeIII | FeIV | OAH | OB | |
|
| |||||||
| unoccupied | |||||||
| α 126 | z2 | -13.31 | 1 | 62 | 2 | 16 | |
| α 125 | xy | -13.64 | 0 | 72 | 7 | 0 | |
| α 124 | xz | -14.67 | 7 | 57 | 0 | 21 | |
| α 123 | yz | -14.87 | 3 | 69 | 0 | 22 | |
| α 122 | x2-y2 | -15.04 | 3 | 75 | 7 | 2 | |
| (c) bis-μ-oxo
| |||||||
| MO no. | Orbital | E(eV) | FeIII | FeIV | OA | OB | |
|
| |||||||
| unoccupied | |||||||
| α 126 | xy | -9.35 | 0 | 60 | 14 | 15 | |
| α 125 | z2 | -9.92 | 0 | 68 | 4 | 3 | |
| α 124 | xz | -10.75 | 2 | 67 | 4 | 22 | |
| α 123 | x2-y2 | -10.82 | 3 | 67 | 12 | 8 | |
| α 122 | yz | -10.89 | 1 | 71 | 17 | 6 | |
Table 3.
Energies (eV) and Compositions (%) of the β occupied and unoccupied FeIV d-based MOs for mono and binuclear FeIV (a) mono-μ-oxo; (b) μ-oxo/μ-hydroxo and (c) bis-μ-oxo structures.
| Mononuclear Fe
| ||||||
|---|---|---|---|---|---|---|
| MO no. | Orbital | E(eV) | FeIV | O | ||
| unoccupied | ||||||
| β 51 | z2 | -2.70 | 45 | 26 | ||
| occupied | ||||||
| β 50 | x2-y2 | -4.60 | 47 | 9 | ||
| β 49 | xz | -5.00 | 34 | 58 | ||
| β 48 | yz | -5.10 | 35 | 52 | ||
| β 47 | xy | -5.60 | 33 | 1 | ||
| Binuclear Fe | ||||||
| (a) mono-μ-oxo
| ||||||
| MO no. | Orbital | E(eV) | FeIII | FeIV | OA | |
|
| ||||||
| unoccupied | ||||||
| β 135 | z2 | -14.00 | 40 | 22 | 18 | |
| occupied | ||||||
| β 131 | xy | -15.40 | 4 | 37 | 0 | |
| β 130 | xz | -16.20 | 1 | 8 | 4 | |
| β 124 (126,122) | yz | -16.68 | 5 | 10 | 13 | |
| β 121 | x2-y2 | -17.20 | 3 | 19 | 2 | |
| (b) μ-oxo/μ-hydroxo
| ||||||
| MO no. | Orbital | E(eV) | FeIII | FeIV | OAH | OB |
|
| ||||||
| unoccupied | ||||||
| β 124 | z2 | -14.32 | 30 | 30 | 0 | 21 |
| occupied | ||||||
| β 120 | xy | -15.72 | 6 | 39 | 12 | 1 |
| β 119 | xz | -16.56 | 1 | 12 | 1 | 5 |
| β 116 (115) | yz | -16.74 | 5 | 8 | 2 | 8 |
| β 114 (112) | x2-y2 | -16.99 | 1 | 12 | 8 | 5 |
| (c) bis-μ-oxo
| ||||||
| MO no. | Orbital | E(eV) | FeIII | FeIV | OA | OB |
|
| ||||||
| unoccupied | ||||||
| β 124 | xy | -10.52 | 11 | 37 | 18 | 22 |
| occupied | ||||||
| β 120 | z2 | -11.95 | 12 | 31 | 3 | 3 |
| β 119 | xz | -12.70 | 4 | 25 | 10 | 40 |
| β 118 | x2-y2 | -12.87 | 6 | 24 | 25 | 4 |
| β 117 | yz | -12.98 | 3 | 25 | 13 | 12 |
Figures 10a and S6a display the large energy splitting of the mononuclear FeIV=O d-π* orbitals. This is due to the large amount of oxo px,y π character in the d(xz) and d(yz) orbitals with none in the d(xy) orbital. Note the mononuclear FeIV d(xz) and d(yz) orbitals lie close in energy due to the close C4v symmetry resulting in similar oxo π character. However, the d(xz) and d(yz) d-π* splitting greatly increases and their average energy decreases in the binuclear mono-μ-oxo FeIV structure. This is primarily due to the sharing of oxo character within the FeIII–O–FeIV unit, which elongates FeIV–Ooxo bond and causes both the d(xz) and d(yz) to lower in energy. Furthermore, while bending in the xz-plane has little effect on the energy of the d(yz) orbital, the d(xz) orbital loses π overlap, but gains σ overlap from the Opx orbital. This causes an energy stabilization of the d(xz) orbital, while the d(yz) orbital lowers in energy and results in a larger splitting between the two d-orbitals. The FeIV d(x2-y2) orbital in the mono-μ-oxo structure has no oxo overlap and thus no energy change. The μ-oxo/μ-hydroxo structure displays a somewhat smaller total energy splitting within the FeIV d-π* manifold, which results from the added interaction between the hydroxo π and the d(x2-y2) orbital. This is due to a butterfly distortion of the [FeIII(μ-O)(μ-OH)FeIV] unit, which offsets the oxo px orbital and introduces some oxo character into the d(x2-y2) orbital, as shown in Figure S6c. The most dramatic energy change occurs within the bis-μ-oxo FeIV d-π* orbitals (Figure 10d and Table 2 and 3). In the bis-μ-oxo case, there is less mixing of the FeIV d-orbitals with the FeIII relative to the previous structures and the combined oxo character in the FeIV increases, which increases the overall d-π* energy. More importantly, the C2v symmetry of the bis-μ-oxo complex provides similar oxo-π contributions to all three d-π* orbitals (from Table 2, the percent oxo character in each of the d-π* orbitals ranges from 26, 20 and 23 in the bis-μ-oxo structure to 21, 20 and 0 in the mono-μ-oxo structure), resulting in similar d-π* energies and thus a much smaller splitting within the bis-μ-oxo FeIV d-π* manifold, relative to the mono-μ-oxo and μ-oxo/μ-hydroxo bridged structures.
4.3 TD-DFT: Spectral Assignments
Time-Dependent Density Functional Theory (TD-DFT) provided a quantitative prediction of transition energies and intensities, which was applied to all three proposed intermediate X models, and the results for the FeIV ligand field transitions are summarized in Figure 11 and Table 4. Slater and some ΔSCF transition state energies, which converged to the spectral excited states, were also calculated for the three binuclear structures (Table 5) and provided energies similar to the TD-DFT results. The TD-DFT transition energies and intensities of the three possible X models were correlated to the experimental data of intermediate X.
Figure 11.
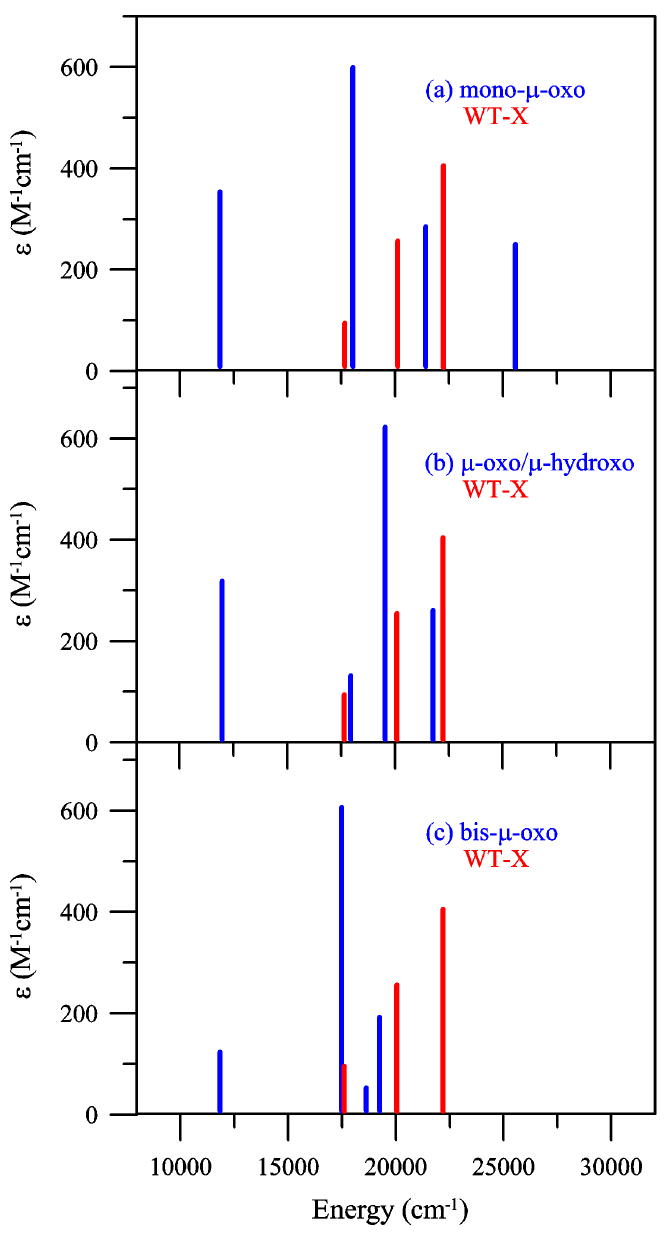
FeIV d-d transition comparison between the experimental WT-X data and the computational TD-DFT data of the (a) mono-μ-oxo, (b) μ-oxo/μ-hydroxo and (c) bis-μ-oxo model structures. Each stick represents an FeIV d-d transition.
Table 4.
TD-DFT calculated transition energies νcalc (cm-1), oscillator strength (f), composition (%) and dominant one-electron excitation of relevant FeIV d-d transitions in (a) mono-μ-oxo; (b) μ-oxo/μ-hydroxo and (c) bis-μ-oxo structures.
| (a) mono-μ-oxo
| ||||||
|---|---|---|---|---|---|---|
| νcalc (cm-1) | f | % | FeIV one-electron excitation | |||
| 11 871 | 0.0010 | 62 | xy (β 131) → z2 (β 135) | |||
| 18 021 | 0.0017 | 41 | xz (β 130) → z2 (β 135) | |||
| 21 404 | 0.0008 | 69 | yz (β 124) → z2 (β 135) | |||
| 25 562 | 0.0007 | 55 | x2-y2 (β 121) → z2 (β 135) | |||
| (b) μ-oxo/μ-hydroxo
| ||||||
| νcalc (cm-1) | f | % | FeIV one-electron excitation | |||
|
| ||||||
| 11 946 | 0.0027 | 64 | xy (β 120) → z2 (β 124) | |||
| 17 905 | 0.0011 | 46 | xz (β 119) → z2 (β 124) | |||
| 19 512 | 0.0053 | 55 | yz (β 116) → z2 (β 124) | |||
| 21 730 | 0.0022 | 18 | x2-y2 (β 114) → z2 (β 124) | |||
| (c) bis-μ-oxo
| ||||||
| νcalc (cm-1) | f | % | FeIV one-electron excitation | |||
|
| ||||||
| 11 858 | 0.0003 | 83 | z2 (β 120) → xy (β 124) | |||
| 17 507 | 0.0017 | 42 | xz (β 119) → xy (β 124) | |||
| 18 660 | 0.0001 | 83 | yz (β 118) → xy (β 124) | |||
| 19 283 | 0.0005 | 76 | x2-y2 (β 117) → xy (β 124) | |||
Table 5.
Calculated Slater and ΔSCF transition energies νcalc (cm-1) and designated FeIV d-d transition in (a) mono-μ-oxo; (b) μ-oxo/μ-hydroxo and (c) bis-μ-oxo structures.
| (a) mono-μ-oxo
| ||
|---|---|---|
| Slater, νcalc (cm-1) | ΔSCF, νcalc (cm-1) | FeIV d-d excitation |
| 13 187 | 12 918 | xy (β 131) → z2 (β 135) |
| 19 664 | 19 222 | xz (β 130) → z2 (β 135) |
| 21 349 | 21 053 | yz (β 126) → z2 (β 135) |
| 24 479 | unconverged | x2-y2 (β 125) → z2 (β 135) |
| (b) μ-oxo/μ-hydroxo
| ||
| Slater, νcalc (cm-1) | ΔSCF, νcalc (cm-1) | FeIV d-d excitation |
|
| ||
| 12 550 | 12 226 | xy (β 120) → z2 (β 124) |
| 18 946 | 18 457 | xz (β 119) → z2 (β 124) |
| 20 253 | 19 983 | yz (β 116) → z2 (β 124) |
| 22 696 | unconverged | x2-y2 (β 114) → z2 (β 124) |
| (c) bis-μ-oxo
| ||
| Slater, νcalc (cm-1) | ΔSCF, νcalc (cm-1) | FeIV d-d excitation |
|
| ||
| 13 437 | 13 350 | z2 (β 120) → xy (β 124) |
| 18 381 | 18 469 | xz (β 119) → xy (β 124) |
| 19 970 | unconverged | yz (β 118) → xy (β 124) |
| 20 333 | unconverged | x2-y2 (β 117) → xy (β 124) |
The TD-DFT FeIV d-d transitions originate from the promotion of an electron from one of the four β-occupied FeIV d-orbitals to the β-unoccupied FeIV d-orbital in Figures 7 - 9. Figure 11 displays the TD-DFT calculated FeIV d-d transitions in blue for each structure and an overlay of the WT intermediate X FeIV d-d transitions in red as identified from RFQ-absorption and MCD spectra, in Figures 3 and 4. The results from the excited state analysis were consistent with the ground state splittings described above.
In general, the experimental and calculated spectra can be divided into two energy regions. The lower energy region, <15 000 cm-1, contained a single spin-allowed FeIV d-d transition in all three calculated structures near 12 000 cm-1, which was attributed to the strong oxo axial ligand field and the relatively weak equatorial ligand field of the mono-μ-oxo and μ-oxo/μ-hydroxo models and the weak axial/strong equatorial ligand field of the bis-μ-oxo model that significantly split the d-σ* orbitals and the transition energy between these orbitals. This d-d transition (the FeIV d-σ* → d-σ* Jahn-Teller transition) was not observed in the experimental absorption or MCD data of the WT and both variants, which could reflect weak absorption and very low MCD intensity as it is well separated from the CT transitions and will not mix by spin-orbit coupling, which is required for low temperature MCD intensity. Also note that related bis-μ-oxo and mono-μ-oxo Mn dimers display MnIII (high-spin d4, Stot = 2) d-σ* → d-σ* Jahn-Teller transitions at 11 000 and 14 500 cm-1 respectively, as determined by absorption, CD and MCD spectroscopies,78,79 which are close to the calculated FeIV d-σ* splitting of 12 000 cm-1 for all three model structures studied here.
Three spin-allowed FeIV d-d transitions are observed in the higher energy region, >15 000 cm-1 for both experimental and calculated spectra, and they exhibit an energy trend consistent with the ground state analysis. While electronic relaxation effects can be significant, in this case,s they were small. The ground state DFT calculations showed that the bis-μ-oxo FeIV d-π* β-occupied orbitals were relatively close in energy (split by ~2300 cm-1), whereas the mono-μ-oxo FeIV d-π* β-occupied orbitals were further split in energy (~8100 cm-1), with the μ-oxo/μ-hydroxo in-between the two (~3500 cm-1), (Figures 7 - 10). This same trend was displayed in the TD-DFT calculations (Figure 11 and Table 4). These three d-d transitions are thus assigned as FeIV d-π* → d-σ* transitions, all originating from the d-π* manifold. The calculated bis-μ-oxo structure displayed three d-π* → d-σ* FeIV d-d transitions all within an 1800 cm-1 region (at 17 500, 18 660 and 19 280 cm-1). The calculated mono-μ-oxo structure displayed its three d-π* → d-σ* FeIV d-d transitions over a 7500 cm-1 region (at 18 020, 21 400 and 25 560 cm-1). The μ-oxo/μ-hydroxo structure displayed d-π* → d-σ* FeIV d-d transitions over a range of 3800 cm-1 (at 17 900, 19 510 and 21 730 cm-1). Importantly, the experimental RFQ-MCD determined FeIV d-d transitions for WT intermediate X were all within a 4600 cm-1 region (at 17 630, 20 080 and 22 260 cm-1).
The FeIV d-d transition assignment is a crucial step in the correlation of the computational models to the experimental data, and our assignments differ from those presented by Noodleman and coworkers.53 In the assignment presented here, the spectra are divided into two energy regions, the lower energy region containing the FeIV Jahn-Teller d-σ* → d-σ* transition, not observed experimentally, and the higher energy region containing the three FeIV d-π* → d-σ* transitions. Furthermore, the experimental d-π* splittings observed have the best correlation to the d-π* splittings of the calculated μ-oxo/μ-hydroxo model.
In addition to the calculated energies, the TD-DFT results provide oscillator strength information, which can help identify transitions as well as correlate to the experimental data on intermediate X. While the experimental RFQ-absorption and MCD spectra did not display a low energy FeIV d-σ* → d-σ* Jahn-Teller transition at <15 000 cm-1, the spectra did display three reasonably intense FeIV d-π* → d-σ* transitions in the region >15 000 cm-1. Also, while MCD is important for identifying transitions, the TD-DFT oscillator strengths should be correlated to the absorption intensities. However, the experimental absorption intensities of WT intermediate X, as shown in Figure 3A and indicated by the red lines in Figure 11, are not well resolved and hence the intensities given are not a unique fit. Nevertheless, MCD still has the resolving power to identify and assign bands and give their quantitative energies; the experimental absorption intensities (Figure 11, red) are a reasonable estimate and follow the absorption spectrum for WT intermediate X (Figure 3A).
It should also be noted that there were many low energy MMCT (metal to metal charge transfer) transitions in the TD-DFT calculations, see Table S4 in Supplementary Information. These transitions are not observed experimentally and would not contribute to the MCD intensity, as MMCT are unidirectional while MCD requires two perpendicular transition dipole moments. Thus, these transitions are not displayed in Figure 11.88
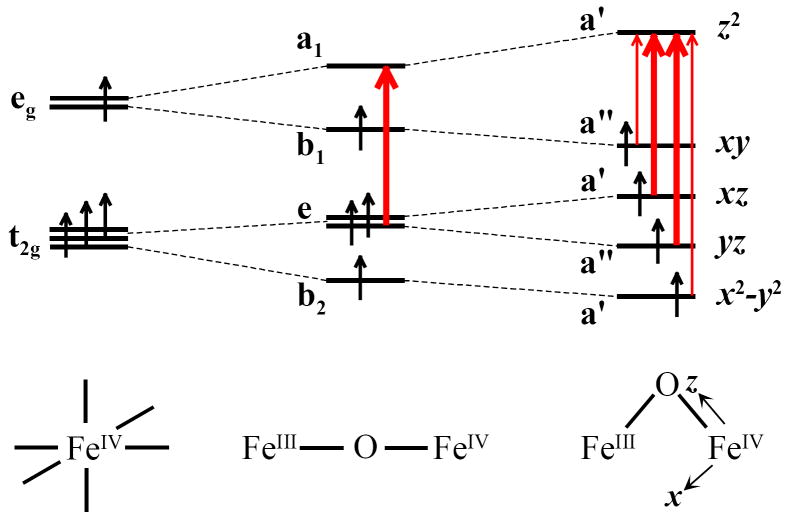
The TD-DFT results displayed some agreement with the intensities of the higher energy FeIV d-π* → d-σ* transitions. However, the mono-μ-oxo and μ-oxo/μ-hydroxo structures displayed unreasonably large low energy FeIV d-σ* → d-σ* Jahn-Teller transition TD-DFT intensities due to borrowing from nearby intense MMCT transitions that strongly contribute to the calculated absorption intensities. Therefore, we turn to group theory to gain insight into the FeIV d-d transition intensities for the different possible structures for X. Figure 12 gives the predicted intensities for the mono-μ-oxo and μ-oxo/μ-hydroxo structures. Both structures follow a similar dissent in symmetry starting from a mononuclear high-spin FeIV in Oh symmetry that is lowered to C4v due to the strong FeIV – oxo bond (in an oxo monomer or a linear FeIV–O–FeIII dimer). In C4v symmetry only one FeIV d-d transition is orbitally allowed, 5A1 → 5E(e → a1), and should have significant absorption intensity. Upon bending of the FeIV–O–FeIII dimer, the effective symmetry is lowered to Cs and all four spin-allowed d-d transitions become orbitally allowed, however the most intense transitions will arise from the 5A1 → 5E(e → a1) C4v parent transition. Thus, group theory predicts the mono-μ-oxo and the μ-oxo/μ-hydroxo cases will display four orbital- and spin-allowed d-d transitions, with the two inner d-π* transitions being more intense (Figure 12).
Figure 12.
Qualitative splitting of FeIV d-orbitals mono-μ-oxo and μ-oxo/μ-hydroxo under dissent in symmetry. There are four spin-allowed d-d transitions. The thick red arrows represent FeIV d-d transitions which are predicted to be more intense than the d-d transitions with thin red arrows, due to the lowering of symmetry.
The bis-μ-oxo case is given in Figure 13, with the two cis oxo ligands that lower the Fe IV symmetry to C2v and the d-orbitals split accordingly. Group theory predicts three orbitally allowed transitions in the bis-μ-oxo structure, one d-σ* and two d-π* → d-σ*. If the symmetry is further lowered, the fourth spin-allowed d-π* transition can borrow intensity, yielding three moderately intense d-d transitions with a weaker transition in the middle.
Figure 13.
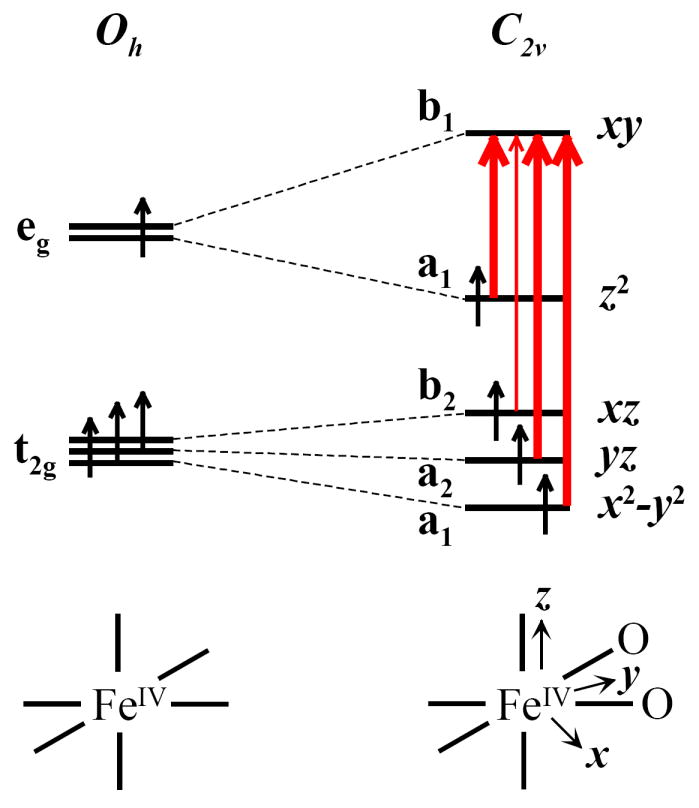
Qualitative splitting of bis-μ-oxo FeIV d-orbitals under dissent in symmetry. There are four spin-allowed d-d transitions. The thick red arrows represent FeIV d-d transitions which are orbitally allowed in C2v. The thin red arrow becomes allowed, due to the lowering of symmetry.
While the lowest energy Jahn-Teller transition, FeIV d-σ* → d-σ*, was not experimentally observed, group theory predicts the lowest energy Jahn-Teller transition, FeIV d-σ* → d-σ*, to have significant intensity in the bis-μ-oxo structure, but little intensity in the mono-μ-oxo and μ-oxo/μ-hydroxo structures (Figures 11 and 12). Thus, the group theory intensity prediction is also consistent with the μ-oxo/μ-hydroxo but not the bis-μ-oxo structure.
In summary, the energy and intensity comparison of the TD-DFT calculated FeIV d-d transitions (blue) with the RFQ-absorption and MCD spectra of WT X (red) in Figure 11 and Tables 1 and 4, best correlate with and strongly support the μ-oxo/μ-hydroxo structure for intermediate X. The Slater transition energies in Table 5 are consistent with the TD-DFT results and also agree with the μ-oxo/μ-hydroxo model. This is further supported by the structural perturbations as described below.
5. Structural Perturbations of X
The variations of the FeIV d-d transitions in the RFQ-MCD spectra of Figure 4 from the WT and the two variants further support the μ-oxo/μ-hydroxo model and indicate that the Fe remote to Y122 is the FeIV center. Previous Mössbauer41 and MCD26 studies also suggested that the FeIV is remote to Y122.
The calculated TD-DFT and Slater transition energy separation between the two lowest energy FeIV d-d transitions (the Jahn-Teller d-σ* → d-σ* transition and the lowest d-π* → d-σ* transition) was ~6000 cm-1 for all three structures. This large energy separation does not correlate to the WT or any variant FeIV band 1 – band 2 energy separation and further substantiates that the three observed RFQ-MCD transitions all originate from the FeIV d-π* manifold. Furthermore, Figure 4 shows that all three FeIV d-d transitions shift in unison, which would not be possible if band 1 in the RFQ-MCD spectra was assigned as the Jahn-Teller transition. As the d-σ* – d-σ* splitting increases, the d-π* – d-π* splitting would also increase. Thus, if band 1 were the d-σ* transition and band 2 were the lowest energy d-π* transition, the splitting between band 1 and 2 would decrease, which is not observed between the WT and variant RFQ-MCD spectra. Therefore, the three identified spin-allowed FeIV d-d transitions in the RFQ-MCD spectra of X for WT, and the W48A and Y122F/Y356F variants directly reflect the splitting of the FeIV d-π* manifold. The total FeIV d-π* manifold splitting is 4630 cm-1 for the WT-X (bands 1–3 at 17 630, 20 080 and 22 260 cm-1), whereas the manifold decreases to 2980 cm-1 in the W48A variant (19 680, 21 590 and 22 660 cm-1) and increases to 5400 cm-1 in the Y122F/Y356F variant (16 700, 19 460 and 22 100 cm-1). The TD-DFT calculated energy separation of the d-π* manifold is ~7400 cm-1 for the mono-μ-oxo structure, ~3800 cm-1 for the μ-oxo/μ-hydroxo structure and ~1900 cm-1 for the bis-μ-oxo structure. In addition, while the W48A variant exhibited the smallest splitting of the FeIV d-π* manifold, it was still significantly larger than the splitting calculated for the bis-μ-oxo model.
These large changes in the FeIV d-π* manifold can be correlated to perturbations of X through structural changes that occur in response to the substitutions. Figure 14 displays the proposed structural perturbations of X that correlate with the FeIV d-π* manifold splitting for the WT and two variants. The proposed structure for WT intermediate X is shown in Figure 14B with the μ-oxo/μ-hydroxo core structure with the FeIII coordinated by a terminal hydroxide and a monodentate D84 that H-bonds to the –OH of Y122. However, in the proposed structure for Y122F/Y356F – X (Figure 14A), the replacement of tyrosine with phenylalanine disrupts this H-bonding network, which would result in the D84 carboxylate and the terminal hydroxide donating more charge to the FeIII. This in turn would weaken the FeIII–Ooxo bond and thus strengthen the Ooxo–FeIV bonding, which would result in a larger splitting of the FeIV d-π* manifold, as observed in the MCD spectrum in Figure 4B. It is important to note that if the Fe closest to Y122 were the FeIV, then the predicted trend would be opposite to what is experimentally observed.
Figure 14.
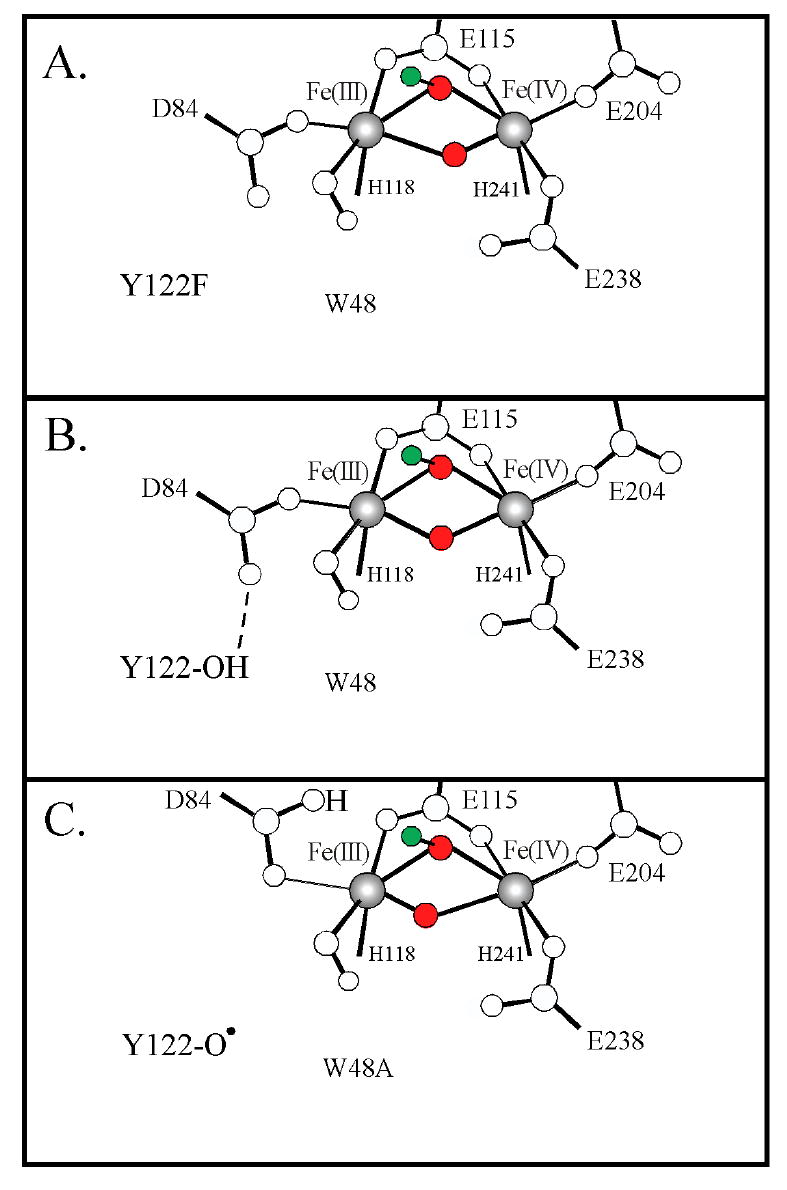
Proposed structural perturbations of X in (A) Y122F/Y356F, (B) WT, and (C) W48A variants. The μ-oxo/μ-hydroxo core structure of X is composed of oxygen atoms that derive from O2 colored red and a proton colored green.
The W48A variant forms X by oxidizing Y122 to Y122•, which would also disrupt the H-bonding network (Figure 14C), but by a different mechanism than in the Y122F/Y356F variant. In this case, the proton from Y122-OH could be transferred in a PCET process to either the terminal hydroxide or to the D84 carboxylate and result in the donation of less charge to the FeIII by these ligands. This change would, in turn, strengthen the FeIII–Ooxo bond and weaken the Ooxo–FeIV bonding, which would result in a smaller splitting of the FeIV d-π* manifold, as observed in the MCD spectrum in Figure 4C. Again, the opposite trend would be observed if the FeIV were proximal to the Y122.
The structural and related spectroscopic perturbations associated with these substitutions also help in the evaluation and exclusion of the possibility of a bis-μ-oxo structure for intermediate X. The bis-μ-oxo structure is relatively symmetric and thus would maintain a reasonably small splitting of its FeIV d-π* manifold. Previous studies on a related bis-μ-oxo MnIII-MnIV dimer suggest that core bending or butterfly distortion reduces Mn-oxo overlap as observed in its absorption spectrum.79 Therefore, an increased butterfly distortion of the FeIII-(μ-O)2-FeIV bis-μ-oxo core would decrease the Fe – oxo overlap, which would further decrease the splitting of the d-π* manifold, making correlation to the WT X FeIV d-d transitions worse and explanation of the larger d-π* splitting in the Y122F/Y356F X variant even more problematic.
Thus, from these correlations, it appears that the substitutions of Y122F/Y356F and W48A directly perturb the FeIII site of X, which indirectly perturbs the FeIV through the oxo bond. This analysis supports the Mössbauer and MCD results that the FeIV is the remote iron center located distal to Y122 and further supports the μ-oxo/μ-hydroxo core structure for intermediate X. It also raises important mechanistic implications for the geometric and electronic structure of X, as discussed below.
6. Discussion
Through the correlation of EPR, absorption, MCD and VTVH MCD spectroscopies with DFT and TD-DFT calculations, we have determined that the μ-oxo/μ-hydroxo core structure [FeIII(μ-O)(μ-OH)FeIV] best correlates to the experimental data for the electronic and geometric structure of X. The variants perturb the Fe closest to the Y122, in a manner which is opposite to what is observed in the spectral changes of the FeIV. This supports a structure where the FeIV is remote to Y122 and is perturbed through the mono-μ-oxo bridge. The geometric and electronic structure characterization of intermediate X provides a greater understanding of its reactivity in RNR and further insight into the factors that tune its O2 reactivity relative to the other binuclear non-heme iron enzymes.
The R2 binuclear non-heme ferrous site reacts with O2 to ultimately generate a radical on Y122 through intermediate X. Scheme 2 presents two possible mechanistic pathways by which the previously established cis-μ1,2-peroxo diferric structure23,36 could convert to intermediate X. These two pathways both result in cleavage of the O-O bond; however, the upper pathway is triggered by the protonation of the peroxide. Past studies on the cis-μ1,2-peroxo diferric structure show it is activated for protonation.23,89 Once protonated, the hydroperoxo would raise the potential of the complex and lower the energy of the peroxo σ* orbital, activating it to oxidize one electron from the remote FeIII and the other from the tryptophan residue (W48 in E. coli R2) to promote the two electron reduction and cleavage of the O-O bond, thus forming a μ-oxo/μ-hydroxo [FeIII(μ-O)(μ-OH)FeIV] core structure for intermediate X. If the peroxo were not protonated, it is possible that it could rearrange to a μ-η2:η2 structure and undergo homolysis of the O-O bond to form the bis-μ-oxo structure. Our experimental results strongly support a μ-oxo/μ-hydroxo core structure with the protonation step activating O-O bond cleavage.
Scheme 2.
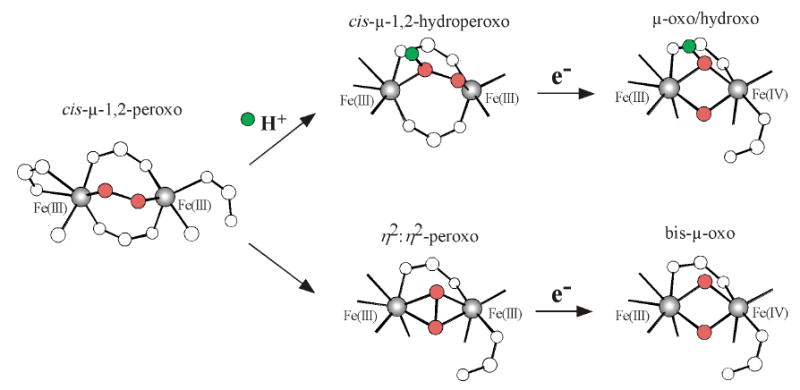
Possible O2 cleavage pathways to generate the high-valent intermediate X. (Top) proton-triggered and (Bottom) non proton-triggered. Both pathways derive one electron from an exogenous source and the other electron from the remote Fe.
Our data and structural assignment of X are in reasonable agreement with previous 1,2H and 17O ENDOR studies of X by the Hoffman and Stubbe groups that display two different 17O peaks from 17O2 (and a 1,2H peak from 1,2H2O) that have been assigned to a single oxo bridge and a terminal hydroxo on the FeIII.39,40 However, our RFQ-MCD data are more consistent with a bridging rather than a terminal hydroxo, which would also be more consistent with the EXAFS Fe-Fe distance.37 Consistent with our MCD results, the ENDOR data do not support a bis-μ-oxo “diamond core” structure for X.
Recently, Noodleman and coworkers proposed a bis-μ-oxo “diamond core” structure for X based on the correlation of FeIV d-d transitions calculated from ΔSCF and Slater transition state methods of four possible models with a truncated binuclear iron active site and the experimentally determined FeIV d-d transitions from our RFQ-MCD spectrum of X in the Y122F/Y356F variant.53 This variant displays three FeIV spin-allowed d-d transitions with the largest d-d energy splittings of the three investigated species of intermediate X. A comparison of Noodleman’s Slater transitions to our TD-DFT and Slater transitions show similar energy splittings for the mono-μ-oxo, μ-oxo/μ-hydroxo and bis-μ-oxo structures, despite ligand differences between their structures relative to those used here (Figures 7-9). They correlate the lowest energy Jahn-Teller d-σ* → d-σ* transition to band 1 in our MCD spectrum. However, all three observed MCD bands shift in unison from the WT transitions to the perturbed W48A and Y122F/Y356F variant transitions. Since the Jahn-Teller transition would shift in a manner opposite to the d-π* manifold, this means that all three experimentally observed FeIV d-d transitions must arise from the d-π* manifold. Alternatively, the energy differences for the higher energy d-π* transitions of their μ-oxo/μ-hydroxo and mono-μ-oxo models in reference 53 correlate much closer (than the d-π* transitions of their bis-μ-oxo structure) to the RFQ-MCD spectrum of WT intermediate X.
The electronic and geometric structures of X in Figures 15 and 16 respectively, are well tuned to oxidize Y122 by one electron, likely via a proton-coupled electron transfer (PCET) process. Figure 16 shows the H-bonding interaction between D84 and Y122-OH, which would provide a superexchange pathway to the proximal FeIII. The electron would then transfer to the lowest energy unoccupied orbital on the FeIII. The mono-μ-oxo bridge would then play an important role in electron transfer from the FeIII to the remote FeIV. Figure 15B shows the LUMO (β-124) of the μ-oxo/μ-hydroxo core structure [FeIII(μ-O)(μ-OH)FeIV], which displays a good π/σ superexchange pathway between the FeIII d(xz) and the FeIV (dz2). This bent μ-oxo superexchange pathway provides an efficient and favorable path for the electron transfer from Y122 through the FeIII to the remote FeIV, as shown in Figure 16.
Figure 15.
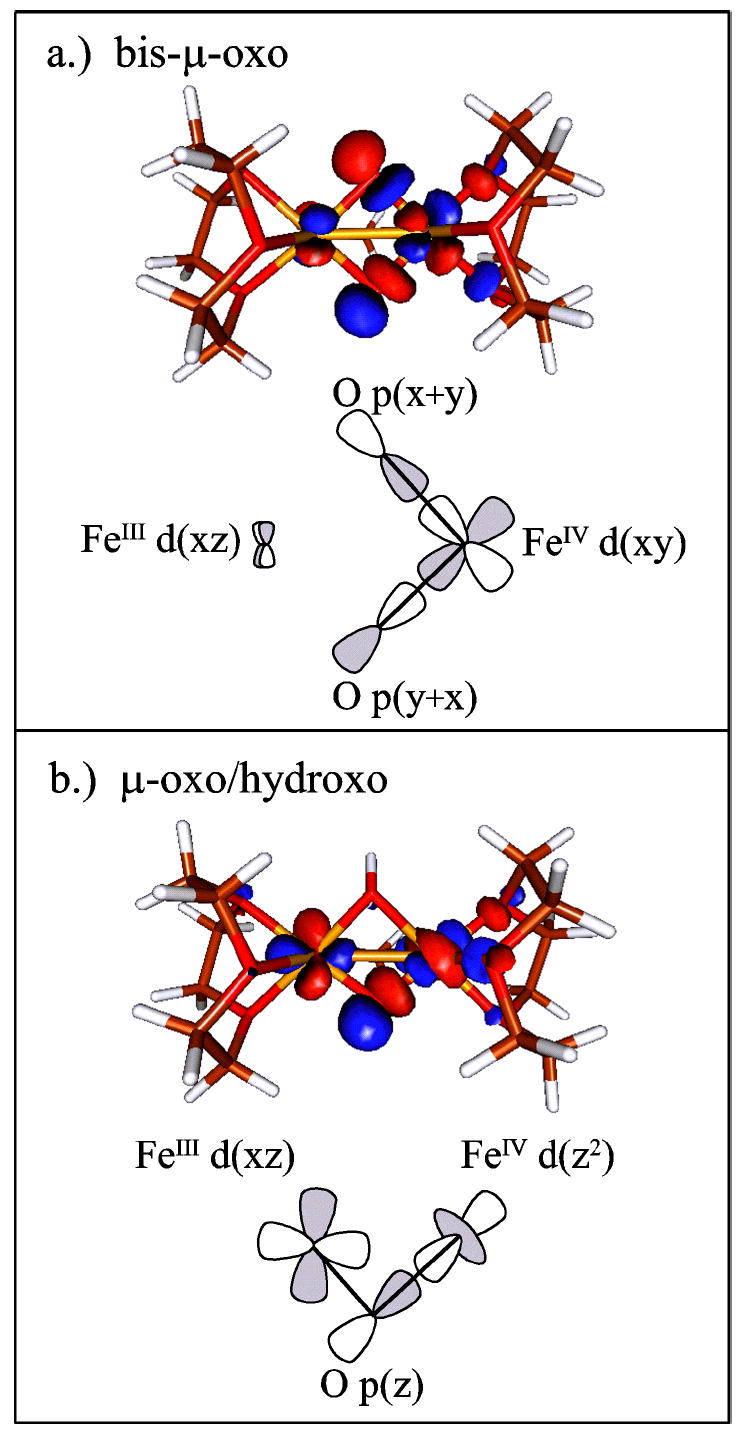
Electron transfer pathways for the LUMO (β-124) of both the (A) bis-μ-oxo and (B) μ-oxo/μ-hydroxo structures. The bis-μ-oxo structure does not show a good ET pathway, whereas the μ-oxo/μ-hydroxo structure displays a good π/σ superexchange ET pathway.
Figure 16.
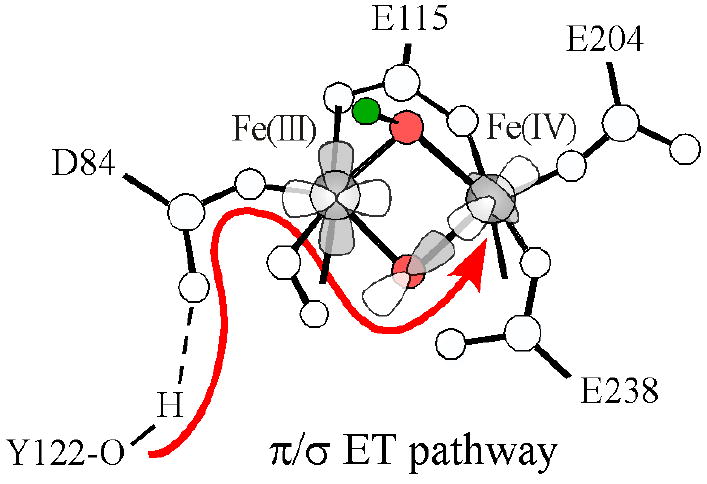
Proposed ET pathway from Y122 to the remote FeIV through the π/σ superexchange pathway of the μ-oxo bridge.
In addition, there would be fundamental reactivity differences between the μ-oxo/μ-hydroxo and bis-μ-oxo structures in H atom abstraction from Y122. In contrast to the μ-oxo/μ-hydroxo, the bis-μ-oxo structure contains an extremely poor ET pathway within the FeIII(μ -O)2FeIV unit to transfer an electron from Y122 to the remote FeIV, as shown in Figure 15A. In contrast to the μ-oxo/μ-hydroxo structure, which has a highly delocalized orbital pathway between the FeIII and FeIV, the bis-μ-oxo structure localizes the LUMO on the remote FeIV and provides a poor superexchange pathway betweenY122 near the FeIII and the remote FeIV.
It is interesting to compare the reactivity of R2 to that of another binuclear non-heme iron protein, hemerythrin. In hemerythrin, O2 reversibly binds to one Fe, yet there is ET from the second Fe through a bent mono-μ-oxo bridge.4,5 Again, it has been shown that the π/σ superexchange pathway associated with the bent oxo bridge allows ET to the remote Fe. The bent μ-oxo bridge also plays a dominant role in the exchange coupling of bent ferric oxo dimer sites in both proteins and model complexes, and these studies connect the π/σ exchange coupling in the homo dimers to the superexchange pathway for ET through the bent μ-oxo bridge.75,77
In summary, the spectroscopic and computational studies presented here support a μ-oxo/μ-hydroxo [FeIII(μ-O)(μ-OH)FeIV] core structure for intermediate X, and that this core structure is well tuned to provide an efficient and favorable π/σ superexchange pathway for PCET from Y122 to the remote FeIV to generate the catalytically essential tyrosyl radical in class I RNR.
Supplementary Material
Supporting Information Available: Absorption and MCD spectra of decayed X, MCD spectra of X trapped using liquid N2 and isopentane, FeIV d-orbital energy level diagram for the three models with contours, DFT calculation coordinates for the three models and TD-DFT transition energies, oscillator strengths and M.O. transition assignment for all three models and the complete reference 71 citation. This material is available free of charge via the Internet at http://pubs.acs.org.
Acknowledgments
We thank Brian Hoffman for his helpful ENDOR discussions of intermediate X. We thank financial support by the NSF Molecular Biophysics Program (MCB-342807 to E.I.S.), NIH (GM-55365 to J.M.B., Jr.) and NIH R.L. Kirschstein NRSA Fellowship (GM-70292 to M.D.C).
Contributor Information
J. Martin Bollinger, Jr, Email: jmb21@psu.edu.
Edward I. Solomon, Email: edward.solomon@stanford.edu.
References
- 1.Solomon EI, Brunold TC, Davis MI, Kemsley JN, Lee SK, Lehnert N, Neese F, Skulan AJ, Yang YS, Zhou J. Chem Rev. 2000;100:235–349. doi: 10.1021/cr9900275. [DOI] [PubMed] [Google Scholar]
- 2.Nordlund P, Eklund H. Curr Opin Struc Biol. 1995;5:758–766. doi: 10.1016/0959-440x(95)80008-5. [DOI] [PubMed] [Google Scholar]
- 3.Wallar BJ, Lipscomb JD. Chem Rev. 1996;96:2625–2657. doi: 10.1021/cr9500489. [DOI] [PubMed] [Google Scholar]
- 4.Brunold TC, Solomon EI. J Am Chem Soc. 1999;121:8277–8287. [Google Scholar]
- 5.Brunold TC, Solomon EI. J Am Chem Soc. 1999;121:8288–8295. [Google Scholar]
- 6.Merkx M, Kopp DA, Sazinsky MH, Blazyk JL, Muller J, Lippard SJ. Angew Chem Int Edit. 2001;40:2782–2807. doi: 10.1002/1521-3773(20010803)40:15<2782::AID-ANIE2782>3.0.CO;2-P. [DOI] [PubMed] [Google Scholar]
- 7.Fox BG, Froland WA, Jollie DR, Lipscomb JD. Method Enzymol. 1990;188:191–202. doi: 10.1016/0076-6879(90)88033-7. [DOI] [PubMed] [Google Scholar]
- 8.Schmidt H, Heinz E. Plant Physiol. 1990;94:214–220. doi: 10.1104/pp.94.1.214. [DOI] [PMC free article] [PubMed] [Google Scholar]
- 9.Wada H, Schmidt H, Heinz E, Murata N. J Bacteriol. 1993;175:544–547. doi: 10.1128/jb.175.2.544-547.1993. [DOI] [PMC free article] [PubMed] [Google Scholar]
- 10.Fox BG, Lyle KS, Rogge CE. Acc Chem Res. 2004;37:421–429. doi: 10.1021/ar030186h. [DOI] [PubMed] [Google Scholar]
- 11.Reichard P, Ehrenberg A. Science. 1983;221:514–519. doi: 10.1126/science.6306767. [DOI] [PubMed] [Google Scholar]
- 12.Nordlund P, Eklund H. J Mol Biol. 1993;232:123–164. doi: 10.1006/jmbi.1993.1374. [DOI] [PubMed] [Google Scholar]
- 13.Stubbe J. Curr Opin Chem Biol. 2003;7:183–188. doi: 10.1016/s1367-5931(03)00025-5. [DOI] [PubMed] [Google Scholar]
- 14.Nordlund P, Reichard P. Annu Rev Biochem. 2006;75:681–706. doi: 10.1146/annurev.biochem.75.103004.142443. [DOI] [PubMed] [Google Scholar]
- 15.Nordlund P, Sjoberg BM, Eklund H. Nature. 1990;345:593–598. doi: 10.1038/345593a0. [DOI] [PubMed] [Google Scholar]
- 16.Rosenzweig AC, Nordlund P, Takahara PM, Frederick CA, Lippard SJ. Chem Biol. 1995;2:632. [PubMed] [Google Scholar]
- 17.Elango N, Radhakrishnan R, Froland WA, Wallar BJ, Earhart CA, Lipscomb JD, Ohlendorf DH. Protein Sci. 1997;6:556–568. doi: 10.1002/pro.5560060305. [DOI] [PMC free article] [PubMed] [Google Scholar]
- 18.Bollinger JM, Jr, Edmondson DE, Huynh BH, Filley J, Norton JR, Stubbe J. Science. 1991;253:292–298. doi: 10.1126/science.1650033. [DOI] [PubMed] [Google Scholar]
- 19.Bollinger JM, Jr, Tong WH, Ravi N, Huynh BH, Edmondson DE, Stubbe J. Method Enzymol. 1995;258:278–303. doi: 10.1016/0076-6879(95)58052-2. [DOI] [PubMed] [Google Scholar]
- 20.Liu KE, Valentine AM, Wang DL, Huynh BH, Edmondson DE, Salifoglou A, Lippard SJ. J Am Chem Soc. 1995;117:10174–10185. [Google Scholar]
- 21.Lee SK, Nesheim JC, Lipscomb JD. J Biol Chem. 1993;268:21569–21577. [PubMed] [Google Scholar]
- 22.Broadwater JA, Ai JY, Loehr TM, Sanders-Loehr J, Fox BG. Biochemistry. 1998;37:14664–14671. doi: 10.1021/bi981839i. [DOI] [PubMed] [Google Scholar]
- 23.Skulan AJ, Brunold TC, Baldwin J, Saleh L, Bollinger JM, Jr, Solomon EI. J Am Chem Soc. 2004;126:8842–8855. doi: 10.1021/ja049106a. [DOI] [PubMed] [Google Scholar]
- 24.Stubbe J, Nocera DG, Yee CS, Chang MCY. Chem Rev. 2003;103:2167–2201. doi: 10.1021/cr020421u. [DOI] [PubMed] [Google Scholar]
- 25.Licht SS, Stubbe J. FASEB J. 1995;9:A1320–A1320. [Google Scholar]
- 26.Yang YS, Baldwin J, Ley BA, Bollinger JM, Jr, Solomon EI. J Am Chem Soc. 2000;122:8495–8510. [Google Scholar]
- 27.Wei PP, Skulan AJ, Mití N, Yang YS, Saleh L, Bollinger JM, Jr, Solomon EI. J Am Chem Soc. 2004;126:3777–3788. doi: 10.1021/ja0374731. [DOI] [PubMed] [Google Scholar]
- 28.Ravi N, Bollinger JM, Jr, Huynh BH, Edmondson DE, Stubbe J. J Am Chem Soc. 1994;116:8007–8014. [Google Scholar]
- 29.Bollinger JM, Jr, Tong WH, Ravi N, Huynh BH, Edmondson DE, Stubbe J. J Am Chem Soc. 1994;116:8024–8032. [Google Scholar]
- 30.Bollinger JM, Jr, Tong WH, Ravi N, Huynh BH, Edmondson DE, Stubbe J. J Am Chem Soc. 1994;116:8015–8023. [Google Scholar]
- 31.Ling JS, Sahlin M, Sjoberg BM, Loehr TM, Sanders-Loehr J. J Biol Chem. 1994;269:5595–5601. [PubMed] [Google Scholar]
- 32.Solomon EI. Inorg Chem. 2001;40:3656–3669. doi: 10.1021/ic010348a. [DOI] [PubMed] [Google Scholar]
- 33.Siegbahn PEM. Chem Phys Lett. 2002;351:311–318. [Google Scholar]
- 34.Gherman BF, Baik MH, Lippard SJ, Friesner RA. J Am Chem Soc. 2004;126:2978–2990. doi: 10.1021/ja036506+. [DOI] [PubMed] [Google Scholar]
- 35.Shu LJ, Nesheim JC, Kauffmann K, Munck E, Lipscomb JD, Que L. Science. 1997;275:515–518. doi: 10.1126/science.275.5299.515. [DOI] [PubMed] [Google Scholar]
- 36.Yun D, Garcia-Serres R, Chicalese BM, An YH, Huynh BH, Bollinger JM., Jr Biochemistry. 2007 doi: 10.1021/bi061717n. ASAP article. [DOI] [PubMed] [Google Scholar]
- 37.Riggs-Gelasco PJ, Shu LJ, Chen SX, Burdi D, Huynh BH, Que L, Stubbe J. J Am Chem Soc. 1998;120:849–860. [Google Scholar]
- 38.Mití N, Saleh L, Schenk G, Bollinger JM, Jr, Solomon EI. J Am Chem Soc. 2003;125:11200–11201. doi: 10.1021/ja036556e. [DOI] [PubMed] [Google Scholar]
- 39.Willems JP, Lee HI, Burdi D, Doan PE, Stubbe J, Hoffman BM. J Am Chem Soc. 1997;119:9816–9824. [Google Scholar]
- 40.Burdi D, Willems JP, Riggs-Gelasco P, Antholine WE, Stubbe J, Hoffman BM. J Am Chem Soc. 1998;120:12910–12919. [Google Scholar]
- 41.Bollinger JM, Jr, Chen SX, Parkin SE, Mangravite LM, Ley BA, Edmondson DE, Huynh BH. J Am Chem Soc. 1997;119:5976–5977. [Google Scholar]
- 42.Siegbahn PEM. Inorg Chem. 1999;38:2880–2889. doi: 10.1021/ic981332w. [DOI] [PubMed] [Google Scholar]
- 43.Lovell T, Li J, Noodleman L. J Biol Inorg Chem. 2002;7:799–809. doi: 10.1007/s00775-002-0358-y. [DOI] [PubMed] [Google Scholar]
- 44.Torrent M, Vreven T, Musaev DG, Morokuma K, Farkas O, Schlegel HB. J Am Chem Soc. 2002;124:192–193. doi: 10.1021/ja016589z. [DOI] [PubMed] [Google Scholar]
- 45.Torrent M, Musaev DG, Basch H, Morokuma K. J Comput Chem. 2002;23:59–76. doi: 10.1002/jcc.1157. [DOI] [PubMed] [Google Scholar]
- 46.Han WG, Lovell T, Liu TQ, Noodleman L. Inorg Chem. 2003;42:2751–2758. doi: 10.1021/ic020465l. [DOI] [PubMed] [Google Scholar]
- 47.Liu TQ, Lovell T, Han WG, Noodleman L. Inorg Chem. 2003;42:5244–5251. doi: 10.1021/ic020640y. [DOI] [PubMed] [Google Scholar]
- 48.Siegbahn PEM. Q Rev Biophys. 2003;36:91–145. doi: 10.1017/s0033583502003827. [DOI] [PubMed] [Google Scholar]
- 49.Han WG, Lovell T, Liu TQ, Noodleman L. Inorg Chem. 2004;43:613–621. doi: 10.1021/ic0206443. [DOI] [PubMed] [Google Scholar]
- 50.Liu TQ, Lovell T, Han WG, Noodleman L. Inorg Chem. 2004;43:6858–6858. doi: 10.1021/ic0206443. [DOI] [PubMed] [Google Scholar]
- 51.Han WG, Liu TQ, Lovell T, Noodleman L. J Am Chem Soc. 2005;127:15778–15790. doi: 10.1021/ja050904q. [DOI] [PubMed] [Google Scholar]
- 52.Han WG, Liu TQ, Lovell T, Noodleman L. J Inorg Biochem. 2006;100:771–779. doi: 10.1016/j.jinorgbio.2006.01.032. [DOI] [PubMed] [Google Scholar]
- 53.Han WG, Liu TQ, Lovell T, Noodleman L. Inorg Chem. 2006;45:8533–8542. doi: 10.1021/ic060566+. [DOI] [PubMed] [Google Scholar]
- 54.Baldwin J, Krebs C, Ley BA, Edmondson DE, Huynh BH, Bollinger JM., Jr J Am Chem Soc. 2000;122:12195–12206. [Google Scholar]
- 55.Krebs C, Chen SX, Baldwin J, Ley BA, Patel U, Edmondson DE, Huynh BH, Bollinger JM., Jr J Am Chem Soc. 2000;122:12207–12219. [Google Scholar]
- 56.Saleh L, Krebs C, Ley BA, Naik S, Huynh BH, Bollinger JM., Jr Biochemistry. 2004;43:5953–5964. doi: 10.1021/bi036099e. [DOI] [PubMed] [Google Scholar]
- 57.Saleh L, Kelch BA, Pathickal BA, Baldwin J, Ley BA, Bollinger JM., Jr Biochemistry. 2004;43:5943–5952. doi: 10.1021/bi036098m. [DOI] [PubMed] [Google Scholar]
- 58.Parkin SE, Chen SX, Ley BA, Mangravite L, Edmondson DE, Huynh BH, Bollinger JM., Jr Biochemistry. 1998;37:1124–1130. doi: 10.1021/bi9723717. [DOI] [PubMed] [Google Scholar]
- 59.Saleh L, Bollinger JM., Jr Biochemistry. 2006;45:8823–8830. doi: 10.1021/bi060325d. [DOI] [PubMed] [Google Scholar]
- 60.Solomon EI, Pavel EG, Loeb KE, Campochiaro C. Coord Chem Rev. 1995;144:369–460. [Google Scholar]
- 61.Noodleman L, Case DA, Aizman A. J Am Chem Soc. 1988;110:1001–1005. [Google Scholar]
- 62.Noodleman L. J Chem Phys. 1981;74:5737–5743. [Google Scholar]
- 63.Noodleman L, Davidson ER. Chem Phys. 1986;109:131–143. [Google Scholar]
- 64.Baerends EJ, Ellis DE, Ros P. Chem Phys. 1973;2:41–51. [Google Scholar]
- 65.Velde GT, Baerends EJ. J Comput Phys. 1992;99:84–98. [Google Scholar]
- 66.Vosko SH, Wilk L, Nusair M. Can J Phys. 1980;58:1200–1211. [Google Scholar]
- 67.Becke AD. J Chem Phys. 1986;84:4524–4529. [Google Scholar]
- 68.Perdew JP. Phys Rev B. 1986;33:8822–8824. doi: 10.1103/physrevb.33.8822. [DOI] [PubMed] [Google Scholar]
- 69.(a) Gorelsky SI. AOMIX program, revision 6.04 ( http://www.sg-chem.net/); (b) Gorelsky SI, Lever ABP. J Organomet Chem. 2001;635:187–196. [Google Scholar]
- 70.Tenderholt AL. PyMOlyze. Version 1.04., http://pymolyze.sourceforge.net.
- 71.Frisch MJ, et al. Gaussian 03. Gaussian, Inc.; Wallingford CT: 2004. Revision C.02. [Google Scholar]
- 72.J ~ 0.1 cm-1
- 73.Solomon EI, Hanson MA. In: Inorganic Electronic Structure and Spectroscopy. 1. Solomon EI, Lever ABP, editors. Vol. 2. John Wiley & Sons; New York: 1999. pp. 1–129. [Google Scholar]
- 74.The high-spin FeIII d-d LF transitions are all spin-forbidden.
- 75.Brown CA, Remar GJ, Musselman RL, Solomon EI. Inorg Chem. 1995;34:688–717. [Google Scholar]
- 76.Jorgensen K. Oxidation Numbers and Oxidation States. Springer-Verlag; New York: 1969. [Google Scholar]
- 77.Brunold TC, Gamelin DR, Solomon EI. J Am Chem Soc. 2000;122:8511–8523. [Google Scholar]
- 78.Brunold TC, Gamelin DR, Stemmler TL, Mandal SK, Armstrong WH, Penner-Hahn JE, Solomon EI. J Am Chem Soc. 1998;120:8724–8738. [Google Scholar]
- 79.Gamelin DR, Kirk ML, Stemmler TL, Pal S, Armstrong WH, Penner-Hahn JE, Solomon EI. J Am Chem Soc. 1994;116:2392–2399. [Google Scholar]
- 80.Han WG, Liu TQ, Lovell T, Noodleman L. J Comput Chem. 2006;27:1292–1306. doi: 10.1002/jcc.20402. [DOI] [PubMed] [Google Scholar]
- 81.Stubna A, Jo DH, Costas M, Brenessel WW, Andres H, Bominaar EL, Munck E, Que L. Inorg Chem. 2004;43:3067–3079. doi: 10.1021/ic030296k. [DOI] [PubMed] [Google Scholar]
- 82.Hsu HF, Dong YH, Shu LJ, Young VG, Que L. J Am Chem Soc. 1999;121:5230–5237. [Google Scholar]
- 83.Wieghardt K, Pohl K, Gebert W. Angew Chem Int Edit. 1983;22:727–727. [Google Scholar]
- 84.Slep LD, Mijovilovich A, Meyer-Klaucke W, Weyhermuller T, Bill E, Bothe E, Neese F, Wieghardt K. J Am Chem Soc. 2003;125:15554–15570. doi: 10.1021/ja030377f. [DOI] [PubMed] [Google Scholar]
- 85.Rohde JU, In JH, Lim MH, Brennessel WW, Bukowski MR, Stubna A, Munck E, Nam W, Que L. Science. 2003;299:1037–1039. doi: 10.1126/science.299.5609.1037. [DOI] [PubMed] [Google Scholar]
- 86.Decker A, Clay MD, Solomon EI. J Inorg Biochem. 2006;100:697–706. doi: 10.1016/j.jinorgbio.2006.01.013. [DOI] [PubMed] [Google Scholar]
- 87.The high-spin S = 2 mononuclear FeIV=O structure used here is a six-coordinate structure (as in the activated non-heme iron enzymes), consisting of two amines which model histidines, one formate which models glutamate or aspartate, one hydroxide and one water.
- 88.While the bis-μ-oxo and μ-oxo/μ-hydroxo structures displayed dominant and clear FeIV d-d transitions in the TD-DFT and Slater transition state calculations, the mono-μ-oxo structure had larger spin-polarization effects that complicate the assignment of specific transitions. However, analysis of the individual molecular orbitals and transitions for the mono-μ-oxo structure allowed the identification of all four FeIV d-d transitions. In the cases where spin-polarization had mixed an FeIV d-orbital into several transitions, an average energy is given for these transitions, Table 3.
- 89.Brunold TC, Tamura N, Kitajima N, Moro-oka Y, Solomon EI. J Am Chem Soc. 1998;120:5674–5690. [Google Scholar]
Associated Data
This section collects any data citations, data availability statements, or supplementary materials included in this article.
Supplementary Materials
Supporting Information Available: Absorption and MCD spectra of decayed X, MCD spectra of X trapped using liquid N2 and isopentane, FeIV d-orbital energy level diagram for the three models with contours, DFT calculation coordinates for the three models and TD-DFT transition energies, oscillator strengths and M.O. transition assignment for all three models and the complete reference 71 citation. This material is available free of charge via the Internet at http://pubs.acs.org.


