Abstract
G protein-coupled receptors (GPCRs) are key players in cell communication. Several classes of such receptors have been identified. Although all GPCRs possess a heptahelical domain directly activating G proteins, important structural and sequence differences within receptors from different classes suggested distinct activation mechanisms. Here we show that highly conserved charged residues likely involved in an interaction network between transmembrane domains (TM) 3 and 6 at the cytoplasmic side of class C GPCRs are critical for activation of the GABAB receptor. Indeed, the loss of function resulting from the mutation of the conserved lysine residue into aspartate or glutamate in the TM3 of GABAB2 can be partly rescued by mutating the conserved acidic residue of TM6 into either lysine or arginine. In addition, mutation of the conserved lysine into an acidic residue leads to a non-functionnal receptor that displays a high agonist affinity. This is reminiscent to a similar ionic network that constitutes a lock stabilizing the inactive state of many class A rhodopsin-like GPCRs. These data reveal that despite their original structure class C GPCRs share with class A receptors at least some common structural feature controlling G-protein activation.
Keywords: Amino Acid Motifs; Amino Acid Sequence; Arginine; chemistry; Cell Line; Cell Membrane; metabolism; Cytoplasm; metabolism; Humans; Inositol Phosphates; chemistry; Lysine; chemistry; Models, Molecular; Molecular Sequence Data; Protein Structure, Tertiary; Receptors, G-Protein-Coupled; chemistry; physiology; Receptors, GABA-B; metabolism; Rhodopsin; chemistry
Keywords: GABAB, GPCR, activation
G-protein coupled receptors (GPCRs) are encoded by one of the most important gene families in mammalian genomes (1). These membrane proteins play a critical role in transducing extracellular signals into the cell, and constitute the major target for drug development. Although being important molecules, still little is known about their activation mechanism (2,3). All these receptors possess a heptahelical domain (HD), the structure of which has been solved for rhodopsin only (4). This available structure is in a fully inactive state, as it is stabilized by the covalently linked inverse agonist cis-retinal. Thus, our actual knowledge on the active conformation relies mostly on functional and biophysical analysis of a variety of mutated receptors and their coupling to G proteins and their effectors (2,3).
Four main classes of GPCRs have been defined in mammals based on sequence analysis ((1,5,6) and http://www.gpcr.org/7tm/), the rhodopsin-like class A receptors being the largest and the most studied one. Class A receptor activation is associated with a movement of TM6 relative to TM3, leading to the opening of a cavity between the intracellular loops 2 and 3 connecting TM3 to TM4, and TM5 to TM6, respectively (2,7). The inactive state is stabilized by a network of interactions between residues at the cytoplasmic end of the TMs (4). This network includes ionic interactions that involve the highly conserved class A residues D/ERY at the cytoplasmic end of TM3. In many class A GPCRs, the Arg of the D/ERY motif makes an ionic interaction with a conserved acidic residue (D/E) of TM6 (3). Mutation of these residues leads either to a loss or a gain of function, consistent with this motif being involved in a lock that can control the conformational state of class A GPCRs (3,8,9). Alternatively, the Arg of the D/ERY motif has also been proposed to play a direct role in receptor G-protein interaction and activation for some class A receptors (8).
The D/ERY motif is not found in the GPCRs from the other classes. This is the case for the class C receptors which are activated by the two main neurotransmitters, glutamate and γ-aminobutyrate (GABA), by Ca2+ ions, taste compounds and pheromones (10). The sequence divergence between the HDs of class A and class C GPCRs questioned whether both get activated the same way. In addition, class C receptor general functioning appears quite different from that of class A receptors despite their likely common dimeric organization (11). Whereas conformational changes within the HD of Class A GPCRs is regarded as the main step in receptor activation, activation of Class C receptors is assumed to result from a change in the relative position of the subunits in the dimer. Indeed, the crystal structure of the large dimeric extracellular domain (ECD) of mGlu1 with and without bound agonist, revealed a major change in their relative position resulting from agonist binding (12). Moreover, FRET analysis in living cells with CFP and YFP fused at various places in the intracellular segments of each of the subunits is consistent with a relative movement of the HDs during class C receptor dimer activation (13). However, a number of modeling and mutagenesis studies are consistent with the HDs of class C GPCRs being structurally similar to rhodopsin (10,14,15). Thus, besides the putative movement between the HDs (13), a change in the conformation of the HDs themselves is likely also involved, as indicated by the effect of allosteric regulators interacting directly in the HD (15–18). But are any of the structural requirements involved in such a conformational change similar in both class A and class C GPCRs?
In the present study, we aimed at identifying key residues involved in the activation of class C GPCRs. Using the GABAB receptor as a model system, we thus examined the functional consequences resulting from the mutation of such residues. This leads us to the observation that a network of interactions involving TM3 and TM6 plays a critical role in the activation process, illustrating some similarity in the structural determinants controlling G-protein activation by class A and class C GPCRs.
Experimental procedures
Materials
GABA was purchased from Sigma (L’Isle d’Abeau, France). 3H-CGP54626 purchased from Tocris (Tocris, Bristol, UK) had a specific activity of 40 Ci.mmol−1. CGP54626 was purchased from Tocris (Fisher-Bioblock, Illkrich, France). Fetal bovine serum (FBS), culture media and other solutions used for cell culture were from GIBCO-BRL-Life Technologies, Inc. (Cergy Pontoise, France). [3H]-myo-inositol (23.4 Ci/mol) was purchased from Perkin–Elmer Life Science (NEN) (Paris, France). All other reagents used were of molecular or analytical grade where appropriate.
Plasmids and site-directed mutagenesis
The plasmids encoding the wild-type and chimeric GABAB1a and GABAB2 subunits epitope tagged at their N-terminal ends (pRK-GABAB1-HA, pRK-GABAB2-cMyc), under the control of a CMV promoter, were previously described (19,20). Site-directed mutagenesis was performed on a pRK-GABAB1a-HA or a pRK- GABAB2-cMyc vector using a Quick-Change® strategy (Stratagene). Briefly, the mutations were generated by using two complementary 30- to 40-mer oligonucleotides designed to contain the desired mutation and the sequence of the constructs was confirmed by DNA sequencing (Genome Express, France).
Cell culture and transfection
Human embryonic kidney (HEK) 293 cells were cultured in Dulbecco’s modified Eagle’s medium supplemented with 10% FCS and transfected by electroporation as described elsewhere (17). Unless stated otherwise, 107 cells were transfected with plasmid DNA containing the coding sequence of the receptor subunits, and completed to a total amount of 10 μg plasmid DNA with pRK6 plasmid. For determination of inositol phosphate accumulation, the cells were also tranfected with the chimeric Gaqi9 G-protein which allows the coupling of the recombinant heteromeric GABAB receptor to PLC (20).
Measurement of inositol phosphate production
Determination of inositol phosphate (InP) accumulation in transfected cells was performed in 96-wells plates (0.2×10⁶ cells/well) after over-night labeling with 3H-myo-inositols (0.5μCi/well) as already described (21). The stimulation was conducted for 30 minutes in a medium containing 10mM LiCl and the indicated concentration of agonist or antagonist. The reaction was stopped by replacing the medium by 0.1M formic acid. Supernatants were recovered and InP were purified by ion exchange chromatography using DOWEX AG1-X8 resin (Biorad, Marnes-la-Coquette, France) in 96 well filter plates (Millipore, Bedford, MA). Total radioactivity remaining in the membrane fractions was counted after treatment of cells with a solution containing 10% triton X-100 and 0.1N NaOH. Radioactivity was quantified using Wallac 1450 MicroBeta liquid scintillation counter. Data were expressed as the amount of total InPs produced over the amount of radioactivity remaining in the membranes plus the produced InP, multiplied by 100. Unless stated otherwise, all data are means ± sem of at least 3 independent experiments. The dose-response curves were fitted using the GraphPad (San Diego) PRISM software and the following equation where the EC50 is the concentration of the compound necessary to obtain 50% of the maximal effect and nH is the Hill coefficient.
Anti HA tag ELISA for quantification of cell surface expression
Twenty four hours after transfection (107 cells, HA-tagged GABAB1 (2μg) and cMyc-tagged GABAB2 (2μg) subunits), cells were fixed with 4% paraformaldehyde and then blocked with PBS + 5% FBS. After 30 minutes reaction with primary antibody (monoclonal anti-HA clone 3F10 (Roche, Basel, Switzerland) at 0.5μg/mL) in the same buffer, the goat Anti-Rat antibody coupled to horseradish peroxidase (Jackson Immunoresearch, West Grove, PA) was applied for 30 minutes at 1μg/mL. After intense washes with PBS, secondary antibody was detected and quantified instantaneously by chemiluminescence using Supersignal® ELISA femto maximum sensitivity substrate (Pierce, Rockford, IL) and a Wallac Victor2 luminescence counter.
Ligand binding on intact HEK293 cells
Ligand binding experiments were performed on intact HEK293 cells. The cells were plated after electroporation the day before experiment. Thus, the cells on ice were washed with ice-cold binding buffer (20mM Tris-HL, pH7.4, 118mM NaCl, 1.2 mM KH2PO4, 1.2 mM MgSO4, 4.7 mM KCl, 1.8 mM CaCl2) and incubated in presence of 1.5 nM of 3H-CGP54626 with or without unlabeled ligand at the indicated concentration. The incubation was terminated by washing with ice-cold binding buffer. The cells were disrupted with 0.1nM NaOH (400mL) and the bound radioactivity was counted in a scintillation beta counter. Displacement curves were fitted with the GraphPad (San Diego) PRISM software, using the equation , where EC50 is the concentration of cold drug necessary to displace half of the specially bound 3H-CGP54626, and nH is the Hill number.
Structural Biology
Sequence alignment of Class C receptors was performed using Clustal W (22) and refined manually. Fold-compatibility for truncated sequences corresponding to the HD of various Class C receptors was searched using the meta-server @TOME ((23), and Ref therein). Sequence-structure alignments including various Class C receptors and the crystal structures of rhodopsin (PDB1LH9, PDB1U19 and PDB1GZM, (4,24,25)) were manually refined with the help of the program ViTO (26). Models of various receptors (mainly mGluRs, T1R2, T1R3, GABAB1 and GABAB2) were performed using SCWRL3.0 (27) and MODELLER7.7 (28). In absence of tools for structure evaluation of modelled membrane proteins, several rounds of alignment refinement/molecular modelling were performed. Visual inspection of the localization of hydrophobic and/or conserved residues relative to the membrane interface and protein core was performed for each TM helix and then for the whole HD. Strict conservation was computed for each sub-family of Class C receptors (e.g.: GABAB2) or for the whole superfamily using ViTO. Final three-dimensional models were built for using MODELLER 7.7 with the loop optimization procedure.
RESULTS
Identification of conserved residues at the cytoplasmic ends of TM3 and TM6 of class C GPCRs
Alignment of the sequences of class C receptor HDs revealed several highly conserved residues. Among these are two basic residues located at the cytoplasmic side of TM3, at positions close to that of the D/ERY motif in class A receptors (Fig. 1). A second highly conserved position is that of an acidic residue of the cytoplasmic end of TM6 (Fig. 1).
Fig. 1.
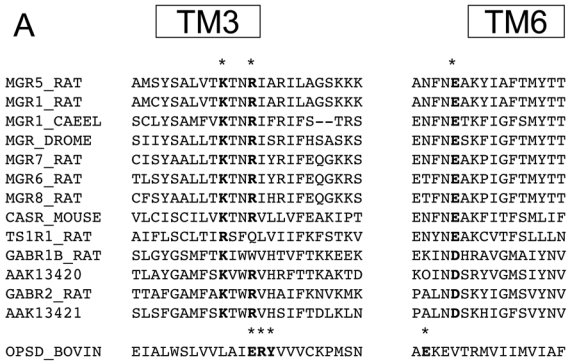
Alignment of the sequences of class C GPCRs. Three conserved residues at the cytoplasmic face of TM3 and TM6 were chosen, as their positions are close to the positions of the D/ERY and D/E motifs in TM3 and TM6 rhodopsin, respectively. The notation of most of the sequences are after the SwissProt data bank notation, with the following accession numbers: MGR5_RAT P31424, MGR1_RAT P23385, MGR1_CAEEL Q09630, MGR_DROME P91685, MGR7_RAT P35400, MGR6_RAT P35349, MGR8_RAT P70579, CASR_MOUSE Q9QY96, TS1R1_RAT Q9Z0R8, GABR1_RAT Q9Z0U4, GABR2_RAT O88871, and OPSD_BOVIN P02699. AAK13420 and AAK13421 sequence, that are GABAB subunits homologues from drosophila, are notated after their gene bank names.
In order to get some possible information on the functional role of these conserved charged residues, 3D models of class C HDs were generated based on rhodopsin structure (see http://www.infobiosud.cnrs.fr/bioserver/HDC/suppl.html). A fold-recognition approach using the meta server @TOME (http://bioserv.cnrs.fr) confirmed the expected compatibility of sequences from Class C receptors with the seven-helix bundle of rhodopsin and provided us with a structural alignment. However, due to the rather low level of sequence identity (~12%) this alignment needed to be refined and critically assessed. The alignment was refined taking into account: first the position of the highly conserved residues, considering these are likely buried in the core structure (Fig. 2A); second, the position of the hydrophobic residues likely exposed to the plasma membrane; third, amino acid hydrophobicity was also used to delimitate helix termini, and large sequence variation (in length and amino acid composition) was clustered in loops. The refinement of the combined alignment was performed by several rounds of manual editing, molecular modeling and structure analysis using the program ViTO on the @TOME meta-server. This strategy was first applied locally, i.e. on each TM separately, and then validated on the full model.
Fig. 2.
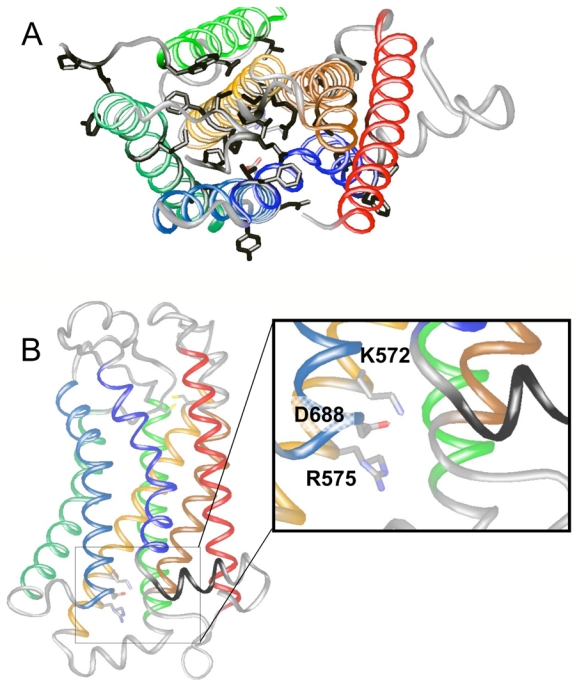
Molecular modeling of GABAB2. A. The side chains of the residues conserved in the GABAB subunits from different species (rat, human, coenorhabditis elegans, and drosophila melanogaster) are showed in black. The representation of the model is viewed from the extracellular side, with the helical TMs showed in ribbon representation. B. The residues K572 and R575 in TM3, and D688 in TM6, are shown in wireframe and in color according to the atom types. The two cysteins conserved in the class C receptors and corresponding to the conserved cysteins in class A receptors involved in a disulfide bridge at the extracellular face are also showed. The representation of the model is viewed from the side and shows the helical TMs in ribbon representation. Loops are shown in white/grey, while TMs are colored as following: TM1 in red, TM2 in brown, TM3 in orange, TM4 in green, TM5 in dark green, TM6 in cyan, and TM7 in dark blue. The figures have been made using the program ViTO.
As illustrated with the GABAB2 HD (Fig. 2), the final models obtained for various Class C GPCR HDs, revealed consistencies with a rhodopsin-like structure. For example, TM 1 showed only a thin patch of conserved residues in agreement with its thin interhelical surface. Also in agreement with TM3 being mostly buried in the core structure, this helix showed the same bias in amino acid composition (enrichment in Ser, Thr, Gly and Ala) in class A and class C GPCRs. Moreover, the conserved disulphide bridge that links TM3 to TM5 in class A receptor is predicted to be present in class C GPCRs.
The final model obtained is in agreement with those already reported (14,29–33). Indeed an identical alignment of TM1, TM3, TM6, and TM7 with rhodopsin was even published for the Calcium Sensing receptor (33). These models were validated by directed mutagenesis of allosteric ligand putative binding sites. Indeed, the HD of Class C receptors contains a binding site for allosteric modulators at positions similar to that of the binding site of small ligands interacting with class A receptors (14,29–33). We further checked that our structural alignment is compatible with these additional restraints by building models for the corresponding receptors (especially GABAB2, mGluR1, mGluR5, CaSR and T1R3) and assessing the positions of the residues proposed to line the binding pocket (data not shown).
Using this alignment and the GABAB2 model, we examined the predicted position of the highly conserved residues identified at the cytoplasmic face of TM3 and TM6 of class C GPCRs. The conserved arginine in TM3 (R575 in GABAB2) is shifted by one residue from the arginine of the D/ERY motif of class A receptors. However, it is optimally located near the solvent interface where the G proteins are expected to bind. Our model also places the conserved TM3 lysine (K572 in GABAB2) one helical turn above the former arginine in a buried and rather hydrophobic environment. Searching for negatively charged residues in the vicinity of this lysine highlighted solely the highly conserved aspartate of TM6 (D688 in GABAB2). Of interest, this aspartate residue is located one turn of alpha helix above the highly conserved acidic residue at the bottom of TM6 in class A receptors (E247 in Rhodopsin). As depicted in Fig. 2B, the 3D model of the class C GABAB2 HD is consistent with the conserved charged residues identified in TM3 and TM6 facing each other. This ménage-à-trois might be involved in a network of ionic interactions mimicking that observed in class A GPCRs involving the D/ERY motif.
Mutated GABAB subunits are correctly expressed at the cell surface
To test the possible involvement of the conserved basic and acidic residues, these were mutated such that the charge is suppressed (alanine), conserved or inverted. To perform this study, we used the GABAB receptor as a model system. This receptor is a heterodimer composed of two homologous proteins GABAB1 and GABAB2. Whereas the GABAB1 subunit is responsible for agonist binding (34,35), the GABAB2 subunit plays a pivotal role in G-protein activation (20,36–38). Of interest, one of the three conserved residues (arginine) is not conserved in the mammalian GABAB1 HD (Fig. 1). As such, analyzing the role of these conserved residues in this receptor heterodimer may also allow a better understanding of the specific role of each HDs in G-protein activation.
We first mutated these three conserved residues (K572, R575 and D688) in the GABAB2 subunit and co-expressed these with the wild-type GABAB1 subunit. As shown in Fig. 3A, the mutated GABAB2 subunits allow the correct surface targeting of the N-terminal HA-tagged GABAB1 subunit (between 77±1% and 125±11% of the wild-type GABAB receptor cell surface expression), as revealed by an ELISA assay performed on intact cells using anti-HA antibodies. Because it is well known that GABAB1 reaches the cell surface when associated with GABAB2 only (19,39–41), these data indicate that the mutations introduced in the GABAB2 HD affect neither GABAB2 expression, nor its ability to form heterodimeric complexes with GABAB1.
Fig. 3.
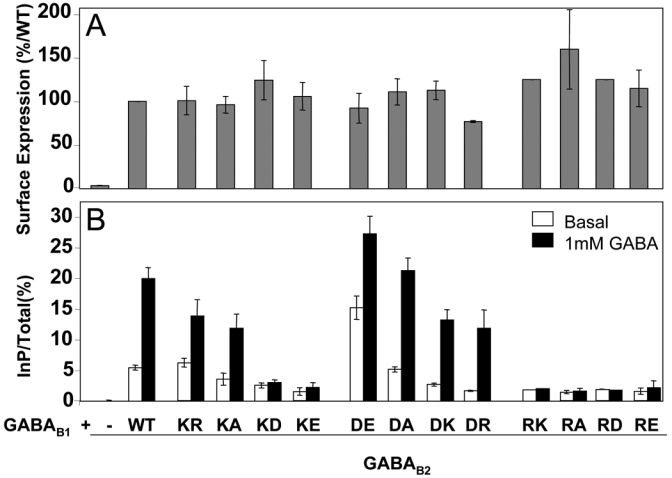
Expression at the cell surface and functional assay of the receptors containing a mutated GABAB2 subunit. A. The cell surface expression of the receptors was analyzed using an ELISA method on intact cells and by detecting the presence of the GABAB1 subunit tagged at its extracellular end by a HA epitope. As GABAB1 reaches the cell surface only when associated with GABAB2, the detection of the GABAB1 at the cell surface indicates that GABAB2 was folded and able to interact correctly with GABAB1 and to take it to the cell surface. The data are the means ± sem of at least three independent experiments performed in triplicates. B. In functional assays, the ligand-induced activity of the mutated receptors was assayed by quantifying the accumulating InP second messenger molecules formed upon activation of the receptors by GABA 1mM. To get coupled to the InP pathway, the GABAB receptor is expressed with the Gqi9 chimeric G protein (see Material and Methods). The data are the means ± sem of at least four independent experiments performed in triplicates.
Mutations of the corresponding residues in GABAB1 (K683, W686, D800) were also generated. These HA-tagged mutants were expressed between 33±3% and 107±28% of the wild-type GABAB receptor (Fig. 4A) when co-expressed with GABAB2. Again, these data indicate that the mutations introduced in the HD of GABAB1 do not restrict protein expression, nor the correct interaction of the mutant with GABAB2 since interaction is needed for these subunits to reach the cell surface.
Fig. 4.
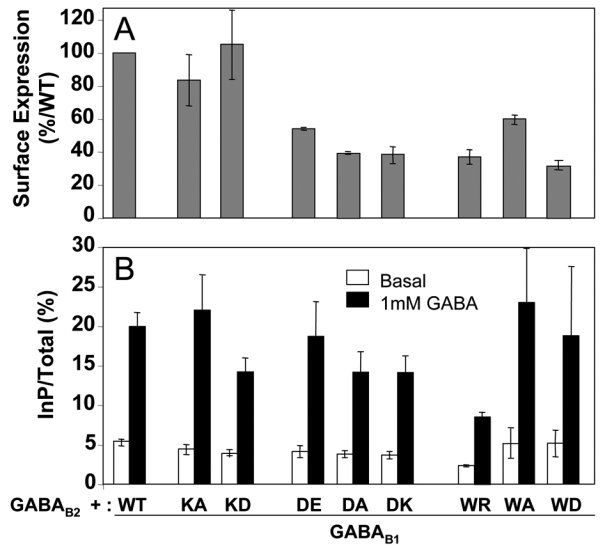
Expression at the cell surface and functional assay of the receptors containing a mutated GABAB1 subunit. A. The cell surface expression of the receptors was analyzed using an ELISA method on intact cells as described in figure 3. The data are the means ± sem of at least three independent experiments performed in triplicates. B. The ligand-induced activity of the mutated receptors was measured as described in figure 3. The data are the means ± sem of at least for independent experiments performed in triplicates.
As expected by the modular nature of the GABAB heterodimeric receptor, all these mutant dimers were found to bind GABA at the surface of intact cells, as revealed by displacement of bound [3H]-CGP54626 by 1 mM GABA (data not shown).
Mutation of the residues K572, R575 and D688 of GABAB2 led to different phenotypes
As shown in Fig. 3B, the mutations of the three residues K572, R575, and D688 in GABAB2, led to different effects on the activity of the GABAB receptor as measured with an InP accumulation assay. Since the GABAB receptor is coupled to Gi/o G proteins, the GABAB subunits were co-transfected with the chimeric G protein Gqi9 allowing it to activate phospholipase C (42). As previously reported, this approach allowed the measurement of both basal and agonist-induced activities of the receptor (Fig. 3B). As shown in Fig. 3B, the mutation of R575 into any of the tested residues (R575K, R575A, R575D, R575E) suppressed GABAB receptor activity (both basal and agonist-stimulated). In contrast, the mutation of D688 into either alanine (D688A), lysine (D688K), arginine (D688R), or glutamate (D688E) led to a functional receptor, the D688E mutant displaying a higher constitutive activity than the wild-type (209±24% of wt basal activity) and a slightly higher agonist potency (EC50 = 310±70 nM and 190±10 nM for the wild-type and the D688E mutant, respectively) (Fig. 7). The D688R and D688K mutants are less active, with both a lower agonist-induced response and a lower basal activity (Fig. 3B), and a GABA potency similar to or lower than that of the wild-type receptor (EC50 = 640±160 and 410±80 nM for the D688K and D688R mutant respectively (Fig. 7)).
Fig. 7.
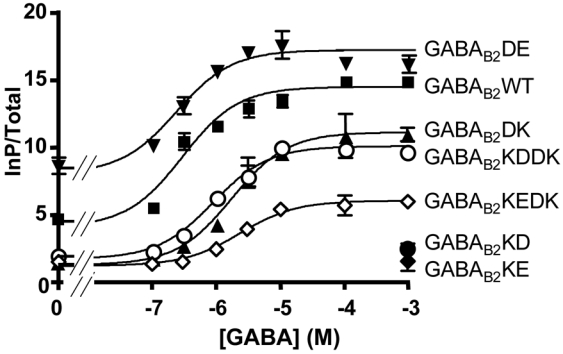
A. Dose-response curves of the receptor in a functional InP assay. The mutated receptor activity was measured in the presence of increasing concentrations of GABA. The indicated GABAB2 subunits were expressed together with the wild-type GABAB1 subunit and the Gqi9 chimeric G protein. See Material and Methods for details. This experiment is representative of three independent experiments performed in triplicates.
In respect to the K572, its mutation into an acidic residue (K572D and K572E) suppressed receptor activity (both basal and agonist-induced, Fig. 3B) despite the good expression level of these mutant subunits (124±22%, and 105±15% of wild-type expression, respectively, Fig. 3A) and their ability to bind GABA (Fig. 8). This indicates that a negative charge at this position prevents GABAB receptor function. The mutation of this residue into either alanine or arginine led to functional receptors with lower basal (K572A) and agonist-induced (K572A and K572R) activities than the wild-type combination.
Fig. 8.
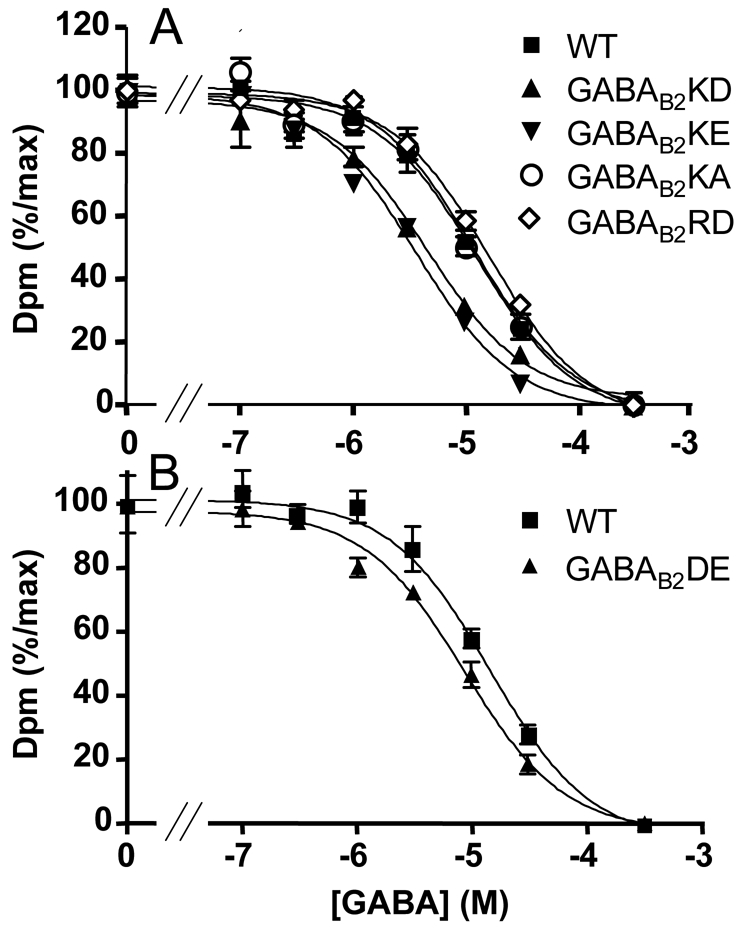
Displacement curves of the radioligand [3H]CGP54626 by increasing concentrations of GABA, on wild-type and mutated GABAB receptor. The indicated GABAB2 subunits were expressed together with the wild-type GABAB1 subunit. See Material and Methods for details. A. Displacement curves on the wild-type GABAB receptor and on receptors bearing the mutations K572D, E or A and R575D. This experiments is representative of three independent experiments performed in triplicates. B. Displacement curves on the wild-type GABAB receptor and on receptors bearing the mutation D688E. This experiment is representative of three independent experiments performed in triplicates.
The mutation of the corresponding residues in GABAB1 did not affect the functional properties of the GABAB receptor (Fig. 4B; GABA EC50 being 310±70, 490±60 and 640±100 nM for the wild-type, GB1K683D and GB1D800K mutants, respectively).
Inversion of the charge of D688 can rescue the function of the inactive K572D or K572E mutants
The proposed model for the HD of GABAB2 suggested that K572 and R575 of TM3 are facing D688 of TM6 suggesting the possible formation of an ionic interaction between TM3 and TM6. Therefore, we examined whether the mutation of D688 into either lysine or arginine could rescue the loss of function of the K572D, K572E, R575D or R575E mutants.
As shown in Fig. 5A, receptors carrying the double mutations K572D-D688K, K572E-D688K, K572D-D688R, and K572E-D688R were all expressed at the cell surface like the wild-type receptor. Of interest, these four mutants could activate Gqi9 upon stimulation with saturating concentrations of GABA, although the responses measured were low compared to those obtained with the wild-type receptor (Fig. 5B). The best responses were obtained with the K572D-D688K and the K572E-D688R mutants. Full dose-response curves of GABA further revealed that the lower response resulted from a lower coupling efficacy, rather than a large decrease in agonists potency (Fig. 7). Indeed, the potency of GABA on K572D-D688K mutated receptor was only 3 fold lower than that measured on the wild-type receptor (EC50 = 880±70 and 310±70 nM, respectively).
Fig. 5.
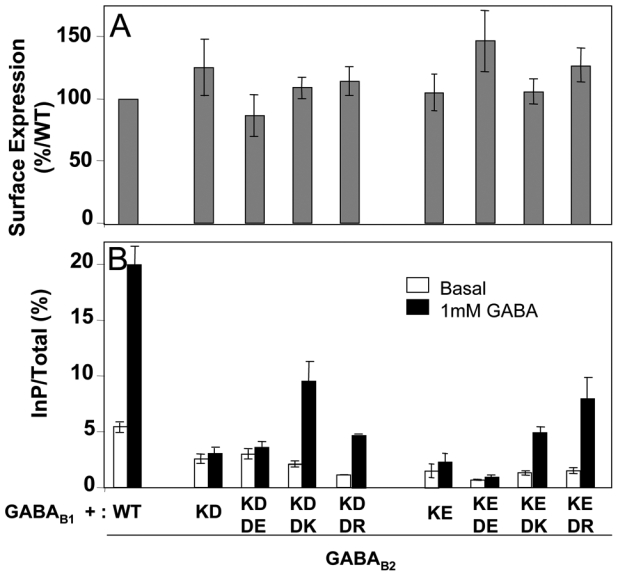
Expression at the cell surface and functional assay of the receptors containing the GABAB2 subunit bearing the double mutation of K572 and D688. A. The cell surface expression of the receptors was analyzed using an ELISA method on intact cells as described in figure 3. The data are the means ± sem of at least three independent experiments performed in triplicates. B. Functional responses of mutated receptors. The ligand-induced activity of the mutated receptors was measured as described in figure 3. The data are the means ± sem of at least three independent experiments performed in triplicates.
In contrast, mutating D688 into a basic residue did not restore function of the R575D and R575E mutants (Fig. 6B), even though these double mutants were all found at the cell surface (Fig. 6A).
Fig. 6.
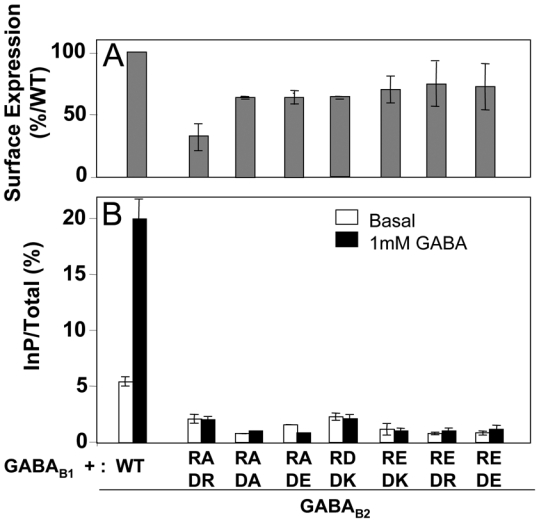
Expression at the cell surface and functional assay of the receptors containing the GABAB2 subunit bearing the double mutation of R575 and D688. A. The cell surface expression of the receptors was analyzed using an ELISA method on intact cells as described in figure 3. The data are the means ± sem of at least three independent experiments performed in triplicates. B. Functional responses of mutated receptors. The ligand-induced activity of the mutated receptors was measured as described in figure 3. The data are the means ± sem of at least three independent experiments performed in triplicates.
These data highlight that opposite charges at positions 572 of TM3 and 688 of TM6 of GABAB2 are important for G-protein activation by this receptor, although not absolutely required since the mutation of D688 into alanine, lysine or arginine does not prevent function.
The GABAB2 K572D/E mutants display a high agonist affinity
In some cases, mutation of the arginine residue of the D/ERY motif of class A GPCRs leads to constitutively active receptors, as observed with the α 1B adrenergic receptor receptors (43). Alternatively, such a mutation can result in a non-functional receptor that shares with constitutively active receptors high agonist affinity, such as for the Histamine H2 receptor (44). None of the mutations of K572 or R575 of the GABAB2 lead to constitutive activity. We therefore examined whether the mutation of these residues affects agonist affinity of the GABAB heterodimer. Binding experiments performed using the high affinity GABAB receptor antagonist [3H]-CGP54626 revealed that all mutants of K572 and R575 bind the corresponding non-radiolabeled antagonist CGP54626 with the same Ki as on the wild type receptor (Ki = 1.22±0.22 nM, 1.58±0.31 nM, 1.40±0.24 nM, and 1.57±0.23 nM for K572D, K572E, R575D, and wild-type receptors, respectively). Analysis of the affinity (Ki) of the agonist GABA revealed that the K572D and K572E displayed a higher agonist affinity than the wild-type receptor or the K572A mutant (Ki = 2.3±0.3 μM, 2.1±0.3 μM, 6.7±0.4 μM and 5.8±0.3 μM, respectively) (Fig. 8A). In contrast, the R575D mutant displayed the same affinity for GABA as the wild-type receptor (Ki = 6.8±0.8 μM) (Fig. 8A). The same analysis was also performed on the D688E mutant that displays a higher constitutive activity than the wild-type receptor. As shown in Fig. 8B, this constitutively active mutant also displays a higher affinity for GABA (Ki = 3.7±0.5 μM and 6.7±0.4 μM for the D688E mutant and the wild-type, respectively). As a control, the affinity of the antagonist CGP54626 was not altered by the mutation (1.28±0.37 nM and 1.57±0.23 nM, for D688E and wild-type, respectively). The increase in agonist affinity is thus consistent with the conformation of the K572D/E mutated GABAB2 HD resembling that of the active state.
DISCUSSION
In the present study we identified two basic residues located in the cytoplasmic end of TM3, and one acidic residue located in the cytoplasmic end of TM6 highly conserved among class C GPCRs. We show that these residues (K572, R575 and D688 in GABAB2) play an important role in GABAB receptor activation.
The most conserved residue of class A GPCRs is the arginine of the D/ERY motif at the cytoplasmic side of TM3. Indeed, among the 3% mammalian rhodopsin-like GPCRs that lack this residue, none have been shown to activate G-proteins (45). Moreover, for the receptors lacking this basic residue, introduction of an arginine enables them to activate G-proteins, as shown for example for the C5A binding protein C5L2 (46) or the olfactory receptor 912-93 (47). In the inactive state of rhodopsin, this arginine residue makes an ionic interaction with the preceding glutamate of the ERY motif, and makes hydrogen bonds with E247 of TM6 (conserved in many GPCRs) (4,25), and possibly T251 as shown in some models of rhodopsin (4). Disrupting this interaction network has been shown to either prevent G protein activation, or to stabilize the receptor in an active state. Indeed, protonation of the acidic residue of the ERY motif allows the arginine side chain to move and to make new contacts, and this could be a molecular step in the process leading to rhodopsin activation ((48) and reference therein). Moreover, neutralization of this acidic residue in many GPCRs results in their constitutive activation reinforcing the idea of its role in stabilizing the inactive state of the receptor (44,49–52). In contrast, mutation of the arginine residue leads to various phenotypes, either a loss (53–58), or a gain of function (43,59–61). In many cases, arginine mutations leading to loss of function are associated with a receptor conformation resembling that of the active state, as observed with the α1b adrenergic, the M1 muscarinic and the H2 histamine receptors (43,55,62,63). This may be the consequence of constitutive desensitization of the receptor as reported for a mutant of the V2 vasopressin receptor (64). Finally, the possible ionic interaction between this arginine and a conserved acidic residue of TM6 has been shown to maintain the β2 adrenergic, the α1b and the LH/hCG receptors in their inactive state (52,65–67). (52,65–67). The structure of an active state of rhodopsin has been solved recently and revealed only small conformational changes in the protein (68). However, it cannot be excluded that such limited conformational changes results from constraints from the crystal lattice, or from the absence of tranducin.. Using 3D modeling of rhodopsin-transducin complex, it has also been proposed that the arginine of the ERY motif directly contacts the G-protein (69), therefore playing a direct role in G-protein activation. Accordingly, two roles, not necessarily exclusive, have been proposed for the arginine of the D/ERY motif of class A GPCRs: 1) a stabilization of the inactive state through an ionic network involving TM6 residues, or 2) a direct role in G-protein interaction and activation.
Although the D/ERY motif is not found in class C GPCRs, two basic residues are highly conserved at an equivalent position (at the cytoplasmic end of TM3) in these receptors. Moreover, like arginine of the D/ERY motif, 3D models suggest that their side chains are directed towards or facing TM6 where a conserved acidic residue is located. Mutation of the more C-terminal basic residue R575 in GABAB2 resulted in a loss of function and suppression of the constitutive activity of the receptor, even though the cell surface expression of the mutants was normal. The loss of function of the R575D/E mutants cannot be restored by replacing D688 of TM6 by a basic residue. Finally, agonist affinity is not affected by such mutation, indicating that arginine mutation does not convert the receptor into an active-like conformation uncoupled to G-proteins. Accordingly, this arginine appears necessary for G-protein activation, but the exact reason for this is not clear. As in our GABAB2 model, the arginine residue R575 is oriented toward the G protein, it is possible that this arginine is required for the proper interaction with the G-protein as proposed for R135 of rhodopsin (69). In agreement with this possibility, arginine 575 points toward the cytoplasm, in a cavity between the intracellular loops 2 and 3 (Fig. 2B) known to contact the Gα protein in class C GPCRs (70–72). However, this arginine is not conserved in some class C GPCRs such as the taste TIRs and mGluS, despite their known capacity to activate G-proteins.
The other conserved basic residue in TM3 of class C GPCRs is a lysine that is located one turn of a helix above the arginine. Replacement of the lysine by an acidic residue resulted in a total loss of function that could be partly restored by mutating D688 of TM6 into arginine of lysine. This likely results from an ionic interaction between the two mutated residues. This is surprising when considering that the K572A and the four mutants of D688 are functional indicating that an ionic interaction between these two positions is not absolutely required for function. However, this does not exclude an ionic interaction between K572 and D688, since other interactions between TM3 and TM6 may still maintain the correct relative positioning of these helices in the absence of D688. Of interest, equivalent mutations of the corresponding acidic residue in TM6 in the calcium-sensing receptor lead to a non functional receptor (73,74). If K572 and D688 are facing each other, mutation of K572 into an acidic residue may result in a repulsion of TM3 and TM6, resulting in a change in conformation of the GABAB2 HD. Consistent with this proposal, K572D/E mutants display a higher affinity for GABA. Of interest, increasing the length of the acidic side chain of TM6 by replacing D688 by glutamate also increases agonist affinity, consistent with the high agonist affinity state resulting from a movement of TM6 relative to TM3. It is surprising that the mutation of D688 into a basic residue did not have the same effect despite the presence of positive charges in both TM3 and TM6. However, the length of the side chains of lysine and arginine is such that the repulsion of the charges may not necessarily affect the relative positions of the helices.
Whereas the higher agonist affinity state of the D688E and K572D/E mutants may possibly correspond to an active state, only the D688E mutant displays a higher constitutive activity, the K572D/E mutants being inactive. The loss of function of K572D/E does not result from a constitutive desensitization of the GABAB receptor, as reported for a mutant of the V2 vasopressin receptor (64), for several reasons. First, this mutant is still expressed normally at the cell surface, indicating that internalization cannot be responsible for the loss of function. Indeed, the GABAB receptor internalizes neither in HEK293 cells nor in neurons even after long term activation by agonist (75,76). Second, desensitization of the GABAB receptor has been observed only in the presence of GRK4 that is not expressed in HEK 293 cells (75). Moreover, the basal activity of a fully constitutively active GABAB receptor can easily be measured in these cells with our assay (77). Accordingly, the K572D/E mutants may be in a specific inactive conformation that is however associated with higher agonist affinity. Alternatively, this mutant may be in an active conformation, but unable to activate G-proteins. As shown above, R575 is crucial for G-protein activation by this receptor. This arginine may well interact with the acidic residue at position 572, one turn of α helice above, in the K572E mutant (Fig. 2 and 9), therefore preventing G-protein activation. In agreement with this proposal, the double mutation inverting the charges at the bottom of TM3 and TM6 (K572D/E and D688K/R) restores receptor function. In this mutant, the reintroduction of the ionic interaction between these TMs likely allows R575 to play its own role in G-protein activation (Fig. 9).
Fig. 9.
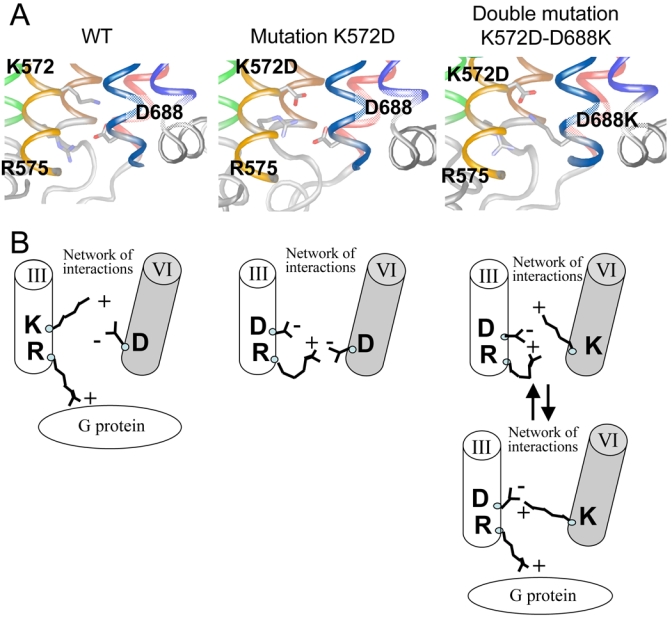
Putative functional role of the residues K572, R575, and D688 at the interface of the TM3 and TM6 of GABAB2. A. Three-dimensional model of the mutated GABAB2. For clarity, only the region of the mutated residues (K572, R575, and D688) is shown. The structure rendering and the color code used are as in Fig 2. B. Schematic representation of the putative effect of the mutation K572D and of the reversing effect of the double mutation K572D-D688K in GABAB2 deduced from the experimental data and the structural analysis.
Our data further illustrate the critical role of the GABAB2 HD in G-protein activation by the heterotrimeric GABAB receptor. Indeed, consistent with previous studies (36,38), single point mutations in the GABAB2 HD are sufficient to suppress G-protein activation by the heterodimer whereas the equivalent mutations in the GABAB1 HD have no effect. It is however interesting to note that both the lysine and the acidic residues of TM3 and 6 respectively, are conserved in GABAB1 (Fig. 1A). In contrast, the arginine residue, although conserved in the C. elegans and Drosophila GABAB1 subunit, is replaced by a tryptophane in vertebrates (Fig. 1A). However, replacement of this tryptophane by an arginine was not sufficient to allow this GABAB receptor subunit to activate G-proteins in the absence of GABAB2, or in the presence of a non-functional GABAB2 subunit (unpublished data). This is in agreement with the absence of function of the drosophila GABAB1 that still possesses the arginine (78), and further indicates that other specific constraints prevent GABAB1 subunit from activating G-proteins.
Taken together, these data highlight the importance of charged residues at the cytoplasmic ends of TM3 and TM6 of class C GPCRs in a dynamic network of interactions controlling activation of the receptor, as already established for many class A GPCRs. Indeed, each of the two conserved basic residues of class C TM3 plays one the proposed roles of the arginine of the D/ERY motif of class A GPCRs: the lysine residue being involved in an ionic interaction with TM6, while the arginine plays a direct role in G-protein activation. These data revealed that despite their modular structure and their constitutive dimeric organization, the HDs of class C GPCRs share more functional similarities with those of class A GPCRs than originally thought.
Acknowledgments
This work was supported by grants from the Centre National de la Recherche Scientifique (CNRS), Action Concertée Incitative ACI-BCMS (328, contract number 45 491 to JPP), the French Ministry of Research (ANR-05-NEUR-035), the European Community EEC STREP program GPCR from the 6thPCRDT (LSHB-CT-2003-503337 to JPP), and contracts with Addex Pharmaceuticals.
We would like to thank T. Durroux for helpful discussion and reading.
References
- 1.Bockaert J, Claeysen S, Becamel C, Pinloche S, Dumuis A. Int Rev Cytol. 2002;212:63–132. doi: 10.1016/s0074-7696(01)12004-8. [DOI] [PubMed] [Google Scholar]
- 2.Karnik SS, Gogonea C, Patil S, Saad Y, Takezako T. Trends Endocrinol Metab. 2003;14:431–437. doi: 10.1016/j.tem.2003.09.007. [DOI] [PubMed] [Google Scholar]
- 3.Gether U. Endocr Rev. 2000;21:90–113. doi: 10.1210/edrv.21.1.0390. [DOI] [PubMed] [Google Scholar]
- 4.Palczewski K, Kumasaka T, Hori T, Behnke CA, Motoshima H, Fox BA, Le Trong I, Teller DC, Okada T, Stenkamp RE, Yamamoto M, Miyano M. Science. 2000;289:739–745. doi: 10.1126/science.289.5480.739. [DOI] [PubMed] [Google Scholar]
- 5.Fredriksson R, Lagerstrom MC, Lundin LG, Schioth HB. Mol Pharmacol. 2003;63:1256–1272. doi: 10.1124/mol.63.6.1256. [DOI] [PubMed] [Google Scholar]
- 6.Foord SM, Bonner TI, Neubig RR, Rosser EM, Pin JP, Davenport AP, Spedding M, Harmar AJ. Pharmacol Rev. 2005;57:279–288. doi: 10.1124/pr.57.2.5. [DOI] [PubMed] [Google Scholar]
- 7.Lu ZL, Saldanha JW, Hulme EC. Trends Pharmacol Sci. 2002;23:140–146. doi: 10.1016/S0165-6147(00)01973-8. [DOI] [PubMed] [Google Scholar]
- 8.Flanagan CA. Mol Pharmacol. 2005;68:1–3. doi: 10.1124/mol.105.014183. [DOI] [PubMed] [Google Scholar]
- 9.Perez DM, Karnik SS. Pharmacol Rev. 2005;57:147–161. doi: 10.1124/pr.57.2.2. [DOI] [PubMed] [Google Scholar]
- 10.Pin JP, Galvez T, Prezeau L. Pharmacol Ther. 2003;98:325–354. doi: 10.1016/s0163-7258(03)00038-x. [DOI] [PubMed] [Google Scholar]
- 11.Pin JP, Kniazeff J, Goudet C, Bessis AS, Liu J, Galvez T, Acher F, Rondard P, Prezeau L. Biol Cell. 2004;96:335–342. doi: 10.1016/j.biolcel.2004.03.005. [DOI] [PubMed] [Google Scholar]
- 12.Pin JP, Kniazeff J, Liu J, Binet V, Goudet C, Rondard P, Prezeau L. Febs J. 2005;272:2947–2955. doi: 10.1111/j.1742-4658.2005.04728.x. [DOI] [PubMed] [Google Scholar]
- 13.Tateyama M, Abe H, Nakata H, Saito O, Kubo Y. Nat Struct Mol Biol. 2004;11:637–642. doi: 10.1038/nsmb770. [DOI] [PubMed] [Google Scholar]
- 14.Pagano A, Ruegg D, Litschig S, Stoehr N, Stierlin C, Heinrich M, Floersheim P, Prezeau L, Carroll F, Pin JP, Cambria A, Vranesic I, Flor PJ, Gasparini F, Kuhn R. J Biol Chem. 2000;275:33750–33758. doi: 10.1074/jbc.M006230200. [DOI] [PubMed] [Google Scholar]
- 15.Goudet C, Gaven F, Kniazeff J, Vol C, Liu J, Cohen-Gonsaud M, Acher F, Prezeau L, Pin JP. Proc Natl Acad Sci USA. 2004;101:378–383. doi: 10.1073/pnas.0304699101. [DOI] [PMC free article] [PubMed] [Google Scholar]
- 16.Goudet C, Binet V, Prezeau L, Pin JP. Drug Discovery Today: Therap Strategies. 2004;1:125–133. [Google Scholar]
- 17.Binet V, Brajon C, Le Corre L, Acher F, Pin JP, Prezeau L. J Biol Chem. 2004;279:29085–29091. doi: 10.1074/jbc.M400930200. [DOI] [PMC free article] [PubMed] [Google Scholar]
- 18.Ray K, Tisdale J, Dodd RH, Dauban P, Ruat M, Northup JK. J Biol Chem. 2005;280:37013–37020. doi: 10.1074/jbc.M506681200. [DOI] [PubMed] [Google Scholar]
- 19.Pagano A, Rovelli G, Mosbacher J, Lohmann T, Duthey B, Stauffer D, Ristig D, Schuler V, Heid J, Meigel I, Lampert C, Stein T, Prézeau L, Pin JP, Froestl W, Kuhn R, Kaupmann K, Bettler B. J Neurosci. 2001;21:1189–1202. doi: 10.1523/JNEUROSCI.21-04-01189.2001. [DOI] [PMC free article] [PubMed] [Google Scholar]
- 20.Galvez T, Duthey B, Kniazeff J, Blahos J, Rovelli G, Bettler B, Prezeau L, Pin JP. Embo J. 2001;20:2152–2159. doi: 10.1093/emboj/20.9.2152. [DOI] [PMC free article] [PubMed] [Google Scholar]
- 21.Liu J, Maurel D, Etzol S, Brabet I, Pin JP, Rondard P. J Biol Chem. 2004;279:15824–15830. doi: 10.1074/jbc.M313639200. [DOI] [PubMed] [Google Scholar]
- 22.Higgins D, Thompson J, Gibson T, Thompson JD, Higgins DG, Gibson TJ. Nucleic Acids Res. 1994:4673–4680. doi: 10.1093/nar/22.22.4673. [DOI] [PMC free article] [PubMed] [Google Scholar]
- 23.Douguet D, Labesse G. Bioinformatics. 2001;17:752–753. doi: 10.1093/bioinformatics/17.8.752. [DOI] [PubMed] [Google Scholar]
- 24.Okada T, Sugihara M, Bondar AN, Elstner M, Entel P, Buss V. J Mol Biol. 2004;342:571–583. doi: 10.1016/j.jmb.2004.07.044. [DOI] [PubMed] [Google Scholar]
- 25.Li J, Edwards PC, Burghammer M, Villa C, Schertler GF. J Mol Biol. 2004;343:1409–1438. doi: 10.1016/j.jmb.2004.08.090. [DOI] [PubMed] [Google Scholar]
- 26.Catherinot V, Labesse G. Bioinformatics. 2004;20:3694–3696. doi: 10.1093/bioinformatics/bth429. [DOI] [PubMed] [Google Scholar]
- 27.Canutescu A, Shelenkov A, Dunbrack RJ. Protein Sci. 2003;12:2001–2014. doi: 10.1110/ps.03154503. [DOI] [PMC free article] [PubMed] [Google Scholar]
- 28.Sali A, Blundell TL. J Mol Biol. 1993;234:779–815. doi: 10.1006/jmbi.1993.1626. [DOI] [PubMed] [Google Scholar]
- 29.Jiang P, Cui M, Zhao B, Liu Z, Snyder LA, Benard LM, Osman R, Margolskee RF, Max M. J Biol Chem. 2005;280:15238–15246. doi: 10.1074/jbc.M414287200. [DOI] [PubMed] [Google Scholar]
- 30.Miedlich SU, Gama L, Seuwen K, Wolf RM, Breitwieser GE. J Biol Chem. 2004;279:7254–7263. doi: 10.1074/jbc.M307191200. [DOI] [PubMed] [Google Scholar]
- 31.Malherbe P, Kratochwil N, Knoflach F, Zenner MT, Kew JN, Kratzeisen C, Maerki HP, Adam G, Mutel V. J Biol Chem. 2003;278:8340–8347. doi: 10.1074/jbc.M211759200. [DOI] [PubMed] [Google Scholar]
- 32.Malherbe P, Kratochwil N, Zenner MT, Piussi J, Diener C, Kratzeisen C, Fischer C, Porter RH. Mol Pharmacol. 2003;64:823–832. doi: 10.1124/mol.64.4.823. [DOI] [PubMed] [Google Scholar]
- 33.Petrel C, Kessler A, Maslah F, Dauban P, Dodd RH, Rognan D, Ruat M. J Biol Chem. 2003;278:49487–49494. doi: 10.1074/jbc.M308010200. [DOI] [PubMed] [Google Scholar]
- 34.Kniazeff J, Galvez T, Labesse G, Pin JP. J Neurosci. 2002;22:7352–7361. doi: 10.1523/JNEUROSCI.22-17-07352.2002. [DOI] [PMC free article] [PubMed] [Google Scholar]
- 35.Galvez T, Parmentier ML, Joly C, Malitschek B, Kaupmann K, Kuhn R, Bittiger H, Froestl W, Bettler B, Pin JP. J Biol Chem. 1999;274:13362–13369. doi: 10.1074/jbc.274.19.13362. [DOI] [PubMed] [Google Scholar]
- 36.Duthey B, Caudron S, Perroy J, Bettler B, Fagni L, Pin JP, Prezeau L. J Biol Chem. 2002;277:3236–3241. doi: 10.1074/jbc.M108900200. [DOI] [PMC free article] [PubMed] [Google Scholar]
- 37.Margeta-Mitrovic M, Jan YN, Jan LY. Proc Natl Acad Sci U S A. 2001;98:14649–14654. doi: 10.1073/pnas.251554498. [DOI] [PMC free article] [PubMed] [Google Scholar]
- 38.Robbins MJ, Calver AR, Filippov AK, Hirst WD, Russell RB, Wood MD, Nasir S, Couve A, Brown DA, Moss SJ, Pangalos MN. J Neurosci. 2001;21:8043–8052. doi: 10.1523/JNEUROSCI.21-20-08043.2001. [DOI] [PMC free article] [PubMed] [Google Scholar]
- 39.Brock C, Boudier L, Maurel D, Blahos J, Pin JP. Mol Biol Cell. 2005;16:5572–5578. doi: 10.1091/mbc.E05-05-0400. [DOI] [PMC free article] [PubMed] [Google Scholar]
- 40.Couve A, Filippov AK, Connolly CN, Bettler B, Brown DA, Moss SJ. J Biol Chem. 1998;273:26361–26367. doi: 10.1074/jbc.273.41.26361. [DOI] [PubMed] [Google Scholar]
- 41.Margeta-Mitrovic M, Jan YN, Jan LY. Neuron. 2000;27:97–106. doi: 10.1016/s0896-6273(00)00012-x. [DOI] [PubMed] [Google Scholar]
- 42.Gomeza J, Mary S, Brabet I, Parmentier ML, Restituito S, Bockaert J, Pin JP. Mol Pharmacol. 1996;50:923–930. [PubMed] [Google Scholar]
- 43.Scheer A, Costa T, Fanelli F, De Benedetti PG, Mhaouty-Kodja S, Abuin L, Nenniger-Tosato M, Cotecchia S. Mol Pharmacol. 2000;57:219–231. [PubMed] [Google Scholar]
- 44.Alewijnse AE, Timmerman H, Jacobs EH, Smit MJ, Roovers E, Cotecchia S, Leurs R. Mol Pharmacol. 2000;57:890–898. [PubMed] [Google Scholar]
- 45.Rosenkilde MM, Kledal TN, Schwartz TW. Mol Pharmacol. 2005;68:11–19. doi: 10.1124/mol.105.011239. [DOI] [PubMed] [Google Scholar]
- 46.Okinaga S, Slattery D, Humbles A, Zsengeller Z, Morteau O, Kinrade MB, Brodbeck RM, Krause JE, Choe HR, Gerard NP, Gerard C. Biochemistry. 2003;42:9406–9415. doi: 10.1021/bi034489v. [DOI] [PubMed] [Google Scholar]
- 47.Gaillard I, Rouquier S, Chavanieu A, Mollard P, Giorgi D. Hum Mol Genet. 2004;13:771–780. doi: 10.1093/hmg/ddh086. [DOI] [PubMed] [Google Scholar]
- 48.Menon S, Han M, Sakmar T. Pharmacol Review. 2001;81:1659–1688. doi: 10.1152/physrev.2001.81.4.1659. [DOI] [PubMed] [Google Scholar]
- 49.Capra V, Veltri A, Foglia C, Crimaldi L, Habib A, Parenti M, Rovati GE. Mol Pharmacol. 2004;66:880–889. doi: 10.1124/mol.104.001487. [DOI] [PubMed] [Google Scholar]
- 50.Scheer A, Cotecchia S. J Recept Signal Transduct Res. 1997;17:57–73. doi: 10.3109/10799899709036594. [DOI] [PubMed] [Google Scholar]
- 51.Rasmussen SG, Jensen AD, Liapakis G, Ghanouni P, Javitch JA, Gether U. Mol Pharmacol. 1999;56:175–184. doi: 10.1124/mol.56.1.175. [DOI] [PubMed] [Google Scholar]
- 52.Ballesteros JA, Shi L, Javitch JA. Mol Pharmacol. 2001;60:1–19. [PubMed] [Google Scholar]
- 53.Rosenthal W, Antaramian A, Gilbert S, Birnbaumer M. J Biol Chem. 1993;268:13030–13033. [PubMed] [Google Scholar]
- 54.Acharya S, Karnik SS. J Biol Chem. 1996;271:25406–25411. doi: 10.1074/jbc.271.41.25406. [DOI] [PubMed] [Google Scholar]
- 55.Scheer A, Fanelli F, Costa T, De Benedetti PG, Cotecchia S. Embo J. 1996;15:3566–3578. [PMC free article] [PubMed] [Google Scholar]
- 56.Lu ZL, Curtis CA, Jones PG, Pavia J, Hulme EC. Mol Pharmacol. 1997;51:234–241. doi: 10.1124/mol.51.2.234. [DOI] [PubMed] [Google Scholar]
- 57.Gruijthuijsen YK, Beuken EV, Smit MJ, Leurs R, Bruggeman CA, Vink C. J Gen Virol. 2004;85:897–909. doi: 10.1099/vir.0.19709-0. [DOI] [PubMed] [Google Scholar]
- 58.Wess J. Pharmacol Ther. 1998;80:231–264. doi: 10.1016/s0163-7258(98)00030-8. [DOI] [PubMed] [Google Scholar]
- 59.Seibold A, Dagarag M, Birnbaumer M. Receptors Channels. 1998;5:375–385. [PubMed] [Google Scholar]
- 60.Fanelli F, Menziani C, Scheer A, Cotecchia S, De Benedetti PG. Proteins. 1999;37:145–156. [PubMed] [Google Scholar]
- 61.Chen A, Gao ZG, Barak D, Liang BT, Jacobson KA. Biochem Biophys Res Commun. 2001;284:596–601. doi: 10.1006/bbrc.2001.5027. [DOI] [PMC free article] [PubMed] [Google Scholar]
- 62.Wilbanks AM, Laporte SA, Bohn LM, Barak LS, Caron MG. Biochemistry. 2002;41:11981–11989. doi: 10.1021/bi020275m. [DOI] [PubMed] [Google Scholar]
- 63.Jones PG, Curtis CA, Hulme EC. Eur J Pharmacol. 1995;288:251–257. doi: 10.1016/0922-4106(95)90036-5. [DOI] [PubMed] [Google Scholar]
- 64.Barak LS, Oakley RH, Laporte SA, Caron MG. Proc Natl Acad Sci U S A. 2001;98:93–98. doi: 10.1073/pnas.011303698. [DOI] [PMC free article] [PubMed] [Google Scholar]
- 65.Greasley PJ, Fanelli F, Rossier O, Abuin L, Cotecchia S. Mol Pharmacol. 2002;61:1025–1032. doi: 10.1124/mol.61.5.1025. [DOI] [PubMed] [Google Scholar]
- 66.Shenker A, Laue L, Kosug S, Merendino JJ, Minegishi T, Cutler JB. Nature. 1993;365:652–654. doi: 10.1038/365652a0. [DOI] [PubMed] [Google Scholar]
- 67.Yano K, Saji M, Hidaka A, Moriya N, Okuno A, Kohn LD, Cutler GB., Jr J Clin Endocrinol Metab. 1995;80:1162–1168. doi: 10.1210/jcem.80.4.7714085. [DOI] [PubMed] [Google Scholar]
- 68.Salom D, Lodowski DT, Stenkamp RE, Trong IL, Golczak M, Jastrzebska B, Harris T, Ballesteros JA, Palczewski K. Proc Natl Acad Sci U S A. 2006;103:16123–16128. doi: 10.1073/pnas.0608022103. [DOI] [PMC free article] [PubMed] [Google Scholar]
- 69.Filipek S, Krzysko KA, Fotiadis D, Liang Y, Saperstein DA, Engel A, Palczewski K. Photochem Photobiol Sci. 2004;3:628–638. doi: 10.1039/b315661c. [DOI] [PubMed] [Google Scholar]
- 70.Pin J-P, Joly C, Heinemann SF, Bockaert J. EMBO J. 1994;13-2:342–348. doi: 10.1002/j.1460-2075.1994.tb06267.x. [DOI] [PMC free article] [PubMed] [Google Scholar]
- 71.Havlickova M, Blahos J, Brabet I, Liu J, Hruskova B, Prezeau L, Pin JP. J Biol Chem. 2003;278:35063–35070. doi: 10.1074/jbc.M306555200. [DOI] [PubMed] [Google Scholar]
- 72.Gomeza J, Joly C, Kuhn R, Knopfel T, Bockaert J, Pin JP. J Biol Chem. 1996;271:2199–2205. doi: 10.1074/jbc.271.4.2199. [DOI] [PubMed] [Google Scholar]
- 73.Francesconi A, Duvoisin RM. J Biol Chem. 1998;273:5615–5624. doi: 10.1074/jbc.273.10.5615. [DOI] [PubMed] [Google Scholar]
- 74.Chang W, Chen TH, Pratt S, Shoback D. J Biol Chem. 2000;275:19955–19963. doi: 10.1074/jbc.M909613199. [DOI] [PubMed] [Google Scholar]
- 75.Perroy J, Adam L, Qanbar R, Chenier S, Bouvier M. Embo J. 2003;22:3816–3824. doi: 10.1093/emboj/cdg383. [DOI] [PMC free article] [PubMed] [Google Scholar]
- 76.Couve A, Restituito S, Brandon JM, Charles KJ, Bawagan H, Freeman KB, Pangalos MN, Calver AR, Moss SJ. J Biol Chem. 2004;279:13934–13943. doi: 10.1074/jbc.M311737200. [DOI] [PubMed] [Google Scholar]
- 77.Kniazeff J, Saintot PP, Goudet C, Liu J, Charnet A, Guillon G, Pin JP. J Neuroscience. 2004;24:370–377. doi: 10.1523/JNEUROSCI.3141-03.2004. [DOI] [PMC free article] [PubMed] [Google Scholar]
- 78.Mezler M, Muller T, Raming K. Eur J Neurosci. 2001;13:477–486. doi: 10.1046/j.1460-9568.2001.01410.x. [DOI] [PubMed] [Google Scholar]


