

Abstract
Environmental and nutritional conditions that optimize the yield of hydrogen (H2) from water using a two-step photosynthesis/fermentation (P/F) process are reported for the hypercarbonate-requiring cyanobacterium “Arthrospira maxima.” Our observations lead to four main conclusions broadly applicable to fermentative H2 production by bacteria: (i) anaerobic H2 production in the dark from whole cells catalyzed by a bidirectional [NiFe] hydrogenase is demonstrated to occur in two temporal phases involving two distinct metabolic processes that are linked to prior light-dependent production of NADPH (photosynthetic) and dark/anaerobic production of NADH (fermentative), respectively; (ii) H2 evolution from these reductants represents a major pathway for energy production (ATP) during fermentation by regenerating NAD+ essential for glycolysis of glycogen and catabolism of other substrates; (iii) nitrate removal during fermentative H2 evolution is shown to produce an immediate and large stimulation of H2, as nitrate is a competing substrate for consumption of NAD(P)H, which is distinct from its slower effect of stimulating glycogen accumulation; (iv) environmental and nutritional conditions that increase anaerobic ATP production, prior glycogen accumulation (in the light), and the intracellular reduction potential (NADH/NAD+ ratio) are shown to be the key variables for elevating H2 evolution. Optimization of these conditions and culture age increases the H2 yield from a single P/F cycle using concentrated cells to 36 ml of H2/g (dry weight) and a maximum 18% H2 in the headspace. H2 yield was found to be limited by the hydrogenase-mediated H2 uptake reaction.
Growth of aquatic microbial oxygenic phototrophs as renewable feedstocks for energy production has great potential for offsetting global dependence on fossil fuels (16). One strategy for utilizing these organisms for energy is to exploit their ability to produce hydrogen from water and sunlight, a topic of worldwide research (7, 34, 37). However, this potential is currently limited by low conversion efficiency. Cyanobacteria comprise a diverse class of prokaryotic oxygenic phototrophs that oxidize water and have been widely studied for their plant-like photosynthesis. More than 500 genera have been classified, and tens of thousands of metabolically distinct strains are in culture collections. Since the first reports of hydrogen evolution from green algae (21) and photosynthetic bacteria (22), only a comparatively small number of strains have been studied in some detail (10, 17, 33). Many but not all cyanobacteria have the genes needed for metabolizing hydrogen gas (39, 43, 44). Based on total genomes available for cyanobacteria it is thought that approximately half of cyanobacteria have the hox genes, which encode a bidirectional hydrogenase, while half do not and that occurrence of hox genes cannot be explained phylogenetically (31). Nevertheless, the vast majority of microorganisms that do have genes that encode hydrogen-metabolizing enzymes have not been studied closely for their ability to make hydrogen.
Cyanobacteria may produce hydrogen either as a by-product of nitrogen fixation using nitrogenase or by a reversible NAD(P)H-dependent NiFe hydrogenase. Even among those cyanobacteria that have been studied explicitly for their ability to make hydrogen, relatively little is known about the various metabolic pathways that influence hydrogen rates and yields. Anaerobic fermentation of photosynthetically stored carbon intermediates is one of the metabolic pathways for hydrogen production in the dark, but relatively little is known about it in Cyanobacteria (38). NAD(P)H-dependent NiFe hydrogenases evolve hydrogen reversibly under dark anaerobic conditions that lead to fermentation in cyanobacteria.
“Arthrospira maxima” is a species of filamentous cyanobacteria that thrives under extreme environmental conditions in alkaline soda lakes (pH 9.5 to 11) at high concentrations of sodium (0.4 to 1.4 M). Noninvasive fluorescence measurements on intact filaments show that A. maxima possesses high quantum efficiency of PSII and the fastest in vivo water-oxidizing complex of all oxygenic phototrophs examined to date (∼5-fold faster than algae and plants and even some other cyanobacteria) (1). A. maxima filaments have no heterocysts and do not fix N2. Likewise, there are no nif (nitrogenase-encoding) genes in its genome, and the organism does not have hup genes encoding an uptake hydrogenase (D. A. Bryant, personal communication). However, the reversible NiFe hydrogenase encoded by hoxHYEFU is present (46) (D. A. Bryant, personal communication), enabling this organism to evolve hydrogen gas.
Arthrospira species are robust cyanobacteria that grow to high cell densities at high rates. Arthrospira fusiformis (Spirulina platensis), isolated from Lake Chitu (Ethiopia), was reported to grow at a specific rate of 1.78 day−1 and attained a maximum quantum yield for growth ranging from 2.8 to 9.4% solar-to-biomass energy conversion when grown in modified Zarrouk's medium under solar irradiation (27).
Arthrospira maxima is an attractive candidate to serve as a cell factory for large-scale hydrogen production because (i) Arthrospira species have high biomass productivity and technology has been developed for mass production; (ii) in the wild it propagates with minimal parasitic microbial contamination, owing to its ecological niche in concentrated carbonate alkaline media; (iii) its long filaments (∼1 mm) are buoyant and amenable to easy harvesting and media transfer.
Autofermentative hydrogen evolution has been reported for Spirulina platensis (4, 36). Spirulina platensis has been reported to produce hydrogen, ethanol, and low-molecular-weight organic acids autofermentatively under dark anaerobic conditions and is enhanced by nitrate (NO3−) depletion (4). Those authors suggested that fermentation in Arthrospira was dependent on the anaerobic degradation of internal glycogen via pyruvate and noted that NO3− deprivation increased photosynthetic accumulation of glycogen in this strain to 50% of the cell dry weight. In another study of A. maxima, growth in elevated salt concentrations (0.25 to 1.0 M NaCl) increased total accumulation of sugars (osmolytes) up to fourfold (45).
Herein we report a study of the rate and yield of fermentative hydrogen production by A. maxima and how it is influenced by a range of user-controllable environmental factors. We apply a powerful new electrochemical cell for quantitative detection of dissolved hydrogen that has vastly increased sensitivity (1 nM), microvolume sample (8 μl), and time resolution (100 ms) compared to commercial methods in common use. We observe for the first time two resolved temporal phases of H2 production in the dark which are shown to originate from reductants produced by photosynthetic activity (NADPH) and fermentation (NADH). We show that the phases and yield vary significantly depending upon the activity and regulation of intracellular metabolism under anaerobic conditions and a range of environmental conditions and show that the environmental conditions and medium components that improve autofermentative hydrogen evolution are not the same as those which yield optimal photoautotrophic growth. This difference has been overlooked for other cyanobacteria in general. Large improvements in the yield of hydrogen production are demonstrated, and the remaining barriers to metabolic control are discussed.
MATERIALS AND METHODS
Arthrospira (Spirulina) maxima (CS-328) was obtained from the Tasmanian CSIRO Collection of Living Microalgae and was grown at 30°C in batch culture in 2.8-liter Fernbach flasks containing 600 ml standard Zarrouk's medium (initial pH 9.5) supplemented with 1 μM Ni2+ and 0 to 200 mM additional NaHCO3 (total NaHCO3 concentration 200 to 400 mM) (1, 11, 12). Cultures were illuminated by cool fluorescent lamps in 12-h light/dark cycles. The intensity dependence is described in the Results section, below.
Gas evolved into the sealed headspace above cultures was measured by a calibrated gas chromatograph equipped with a 13X molecular sieve column with argon carrier gas and a thermal conductivity detector (Gow-Mac); 10-ml cell suspensions in glass vials (30 ml of headspace) or 40-ml cell suspensions in glass bottles (210 ml of headspace) were sealed with Teflon-coated septa and purged with argon gas; 200-μl aliquots of headspace gas were sampled with a gas-tight syringe (Hamilton).
Dry weights of cells were determined by measuring the masses of known volumes of cultures dried at 75°C until constant mass, minus the mass of dried cell-free spent medium. This was done by separating cells from spent medium by flotation and separately measuring the mass of dried cells and that of spent medium.
Glycogen content of cells before and after fermentation was determined by a method similar to that described by others (18). Briefly, approximately 70 mg of cell dry weight material was boiled in 1 ml of 48% aqueous KOH for 2 hours and then incubated overnight at 70°C. Full solubilization of glycogen was assumed based on glycogen solubility in aqueous KOH and the results of others (28). This solution was serially diluted about 70-fold in 48% aqueous KOH. Glycogen was precipitated from 60 μl of the dilute solution by addition of 400 μl cold ethanol, set on ice for 10 min, and centrifuged at 10,000 × g for 5 minutes. The supernatant was discarded, and the pellet was washed with cold ethanol, dried under air at 70°C, and suspended in 1 ml of 200 mM sodium acetate buffer (pH 4.75) containing 2.7 units amyloglucosidase and 2.1 units amylase (Sigma). This solution was incubated at 37°C overnight, after which glucose concentrations were determined with a glucose assay kit that relies on glucose oxidase, peroxidase, and o-dianisidine (Sigma) and light absorption at 520 nm. Glycogen recovery by this method with known quantities of bovine glycogen (Sigma) was greater than 95%.
Chlorophyll a variable fluorescence yield, which is proportional to PSII quantum efficiency, was measured with a home-built laser-based fast repetition rate fluorometer as described elsewhere (1, 11).
Cultures were examined before and following autofermentation for contaminant microbial growth using optical microscopy.
H2 rate electrode and microcells.
An ultrasensitive membrane-covered electrode (Clark type) and electronic circuit for measuring dissolved H2 were fabricated and used for these studies. The electrochemical system is based upon a similar device fabricated for O2 detection (2). H2 concentrations as low as 1 × 10⁻⁹ M are detectable with a time resolution of 0.1 s. The sample chamber (Teflon) has a volume of 8 μl and accommodates either whole-cell suspensions or cell isolates. It uses a working electrode made of a Pt-Ir alloy (75:25%) poised at +220 mV. The large surface area of the electrode (12.6 mm2) and ultrathin membrane (∼600 nm; high density polyethylene) allow for fast diffusion and consumption of dissolved hydrogen. Consequently, this system measures the H2 production rate, unlike conventional Clark electrodes. This rate is orders of magnitude above hydrogen production from our samples, such that the response current from the electrode is a linear measure of the hydrogen evolution rate. Using Faraday's second law, the output signal after amplification is proportional to the evolution rate, as follows: 1.00 V = 78 μmol H2/liter of culture/h. This calibration decreases with time by a factor of 2 to 3 and then stabilizes. We denote this as our first-generation H2 rate electrode (13).
To improve electrode linearization at high H2 evolution rates, we used a Nafion-coated screen (20 μm) to conduct protons from the electrode surface to bulk electrolyte solution. Additional deposition of a Pd black film (25) on the Pt-Ir electrode improved stability but decreased sensitivity and rate response and therefore was used for measurements requiring absolute calibration stability. For studies involving illumination, we fabricated an LED flasher (optical power, 200 μE m−2 s−1; wavelength, 640 nm). A multifunctional data acquisition card (DAC; PCI-6036E; National Instruments, Inc.) was used to drive this flasher with a wide range of light pulses ranging from 2 μs to 500 μs. A second flasher was fabricated using a red LED (wavelength, 640 nm; Luxeon Star, Inc.) which delivers 3 W optical power using a 1-A current driver controlled by the analog output from the same DAC. Flash durations of the Luxeon flasher vary from 10 ms to 99 s.
For the experiment shown in Fig. 3 (top), dissolved hydrogen was measured using a similarly constructed prototype electrode and interfaced with a Hansatech Oxygraph power supply (Hansatech Instruments Ltd.) modified to work at reverse polarity, 400 mV. Hydrogen rate measurements for this device are in relative units, with a significantly poorer signal-to-noise ratio than our electrode system.
FIG. 3.

In vitro hydrogenase activities of cells after 0, 3.2, and 20.7 h of incubation under dark anaerobic conditions in sealed glass vials prepared in triplicate (bottom) during concurrent measurement of hydrogen rate kinetics of a sample prepared in parallel on a rate electrode (top). Signal to noise of this measurement is significantly lower than in all other figures because a different device was used for these measurements (see Materials and Methods). These cells were grown on a 12-h light/dark cycle under 40 μE/m2/s light for 25 days to a cell density of 0.83 g (dry weight)/liter and a chlorophyll content of 13.5 mg/liter.
In vitro hydrogenase assays.
Methyl viologen assays were performed under conditions similar to those described elsewhere (47) with modifications. Cells were harvested from batch cultures in early stationary phase (cell density, ∼35 mg chlorophyll a or ∼1.5 g [dry weight] per liter of culture) and lysed anaerobically with glass beads in 500 mM HEPES buffer, pH 6.8, with 3 mM MgCl2. To this mixture, final concentrations of the following were added: 6 mM methyl viologen, 9 mM sodium dithionite, and 0.1% Triton X-100. Gas-phase hydrogen was sampled from these sealed glass vials for gas chromatography.
All figures presented are from representative single measurements of replicated experiments unless otherwise noted.
RESULTS
Rate of dark H2 accumulation from batch cultures in closed reactor headspace.
Batch liquid cultures of Arthrospira maxima placed in the dark under an anoxic atmosphere make hydrogen gas. When studying hydrogen evolution in this process we noticed that, independent of cell density and incubation time, the headspace above sealed cultures could vary significantly from a few parts per thousand to several percent. The most reproducible factor for hydrogen production appeared to be culture age. As will be described below, we noticed that cultures that could be kept at high densities for long periods of time (over 60 days) produced the highest partial pressure of hydrogen under dark anaerobic conditions.
Figure 1 shows dark H2 accumulation in the headspace of glass bottles under 105 pascals of argon from cells that were concentrated by flotation to 15.1 g (dry weight)/liter and incubated at 30 or 35°C. By cycling the cells on a diurnal light cycle over the course of a few months before autofermentation, the cells become “conditioned” for higher rates of fermentative H2 production. Using this conditioning approach, H2 yields in the headspace increased up to 36 ml H2/g initial dry weight (or 550 ml H2/liter culture) in 10 days at 35°C, corresponding to over 10% H2 in the headspace. Slightly lower hydrogen partial pressure was obtained when cells were incubated at 30°C. The maximum hydrogen evolution rates (from days 2 to 4) from these data are 4.5 and 7.1 ml H2/g (initial dry weight)/day for cells fermented at 30 and 35°C, respectively.
FIG. 1.

Kinetics of autofermentative H2 production in the dark at 30 and 35°C by Arthrospira maxima in closed glass bottles by gas chromatography. The culture was 21 days old, grown for 12 days in stage 1 followed by conditioning (stage 2) for 9 days as described in the text. Cells were then concentrated by flotation to a final cell density of 15.1 g (dry weight)/liter of culture. The sample volume in the bottle is 40 ml, the headspace volume is 210 ml, and the sampling volume by gas chromatography is 200 μl. Dry weight and glycogen content of these cells were determined before and after fermentation (see Table 2).
Other data that we have collected have shown rates as high as 13.3 ml H2/gram (dry weight)/day for cells fermented at 35°C with shaking. The range of hydrogen rates and yields we have observed from measurements of hydrogen in the headspace above dense sealed cultures is summarized in Table 1. The key factors for maximizing autofermentative hydrogen production from cultures appear to be (i) remaining oxygen concentration, (ii) age of culture and accumulated level of glycogen, (iii) nitrate concentration in the medium, (iv) temperature, (v) agitation (during growth and during fermentation), and (vi) the volumetric ratio of headspace volume to culture volume in sealed bottles.
TABLE 1.
Rates and yields of hydrogen production from high-density Arthrospira maxima cultures under autofermentationa
| Fermentation temp (°C) | H2 yield (ml H2/g [initial dry wt]) | % H2 in headspace | Max H2 rate (ml H2/g [dry wt]/day) |
|---|---|---|---|
| 30b | 25-30 | 6-10 | 4.5-5.2 |
| 35c | 30-36 | 6-18 | 6.5-13.3 |
There was no correlation between the hydrogen yield in the headspace and the hydrogen evolution rate among trials.
Range of values from approximately 20 different experimental trials.
Range of values from three different experimental trials.
Our maximum observed concentration of H2 in the headspace of fermenting cells is 18% (Table 1), and this upper limit could not be surpassed by addition of fermentable substrates such as glucose or pyruvate. These additions significantly boost the initial H2 rate by 10 and 25 times, respectively, if given to autofermenting cultures at the beginning of anaerobiosis (see Fig. S1 in the supplemental material). This observation establishes that both substrates can pass the cell wall and that the H2 production rate is initially limited by substrate conversion to NADH and not hydrogenase activity. Further, if cells are fermented under 20% exogenous H2 in the headspace, hydrogen levels do not increase after several days (see Fig. S2 in the supplemental material).
Biomass consumption during autofermentation.
Dry weight and glycogen content of cells were measured for the experiment shown in Fig. 1; these data are tabulated in Table 2. Cells were initially at a density of 15.1 g (dry weight)/liter of culture with 15% glycogen content but catabolized 4.0 or 4.2 g/liter of biomass after 10 days of fermentation at 30 or 35°C, respectively. Nearly all glycogen was catabolized, but this equates to only 2.1 g/liter of the biomass consumed, indicating that the cells catabolized other substrates as well. Determining the identity of these substrates is necessary in order to report the stoichiometry of moles hydrogen evolved per mole of substrate and will be reported in a future study. However, we can conclude that 112.5 or 131.0 ml H2 was evolved per gram of substrate catabolized at 30 or 35°C. If all of the biomass consumed was in the form of glucose, the stoichiometry would equate to 0.9 or 1.05 mol H2 per mole hexose equivalent consumed, while if all H2 came exclusively from the glycogen fraction that was catabolized the stoichiometry would equate to 1.7 or 2.1 mol H2 per mole of hexose equivalent consumed, respectively (out of a theoretical maximum of 12 H2 per hexose equivalent).
TABLE 2.
Conversion of biomass and glycogen to H2 via autofermentation by Arthrospira maximaa
| Temp fermented (°C) | Dry wt of cells (g)/liter
|
Biomass consumed (g/liter) | H2 produced/biomass consumed (ml/g) | Glycogen content of cells (g [dry wt]/liter)
|
Glycogen consumed (g/liter) | ||
|---|---|---|---|---|---|---|---|
| Initial | Final | Initial | Final | ||||
| 30 | 15.1 | 11.1 | 4.0 | 112.5 | 2.3 ± 0.2 (15.0% ± 1.5%) | 0.18 ± 0.03 (1.6% ± 0.3%) | 2.1 ± 0.2 |
| 35 | 15.1 | 10.9 | 4.2 | 131.0 | 2.3 ± 0.2 (15.0% ± 1.5%) | 0.19 ± 0.02 (1.7% ± 0.2%) | 2.1 ± 0.2 |
Hydrogen evolution for this trial is shown in Fig. 1. Data are for one set of samples measured in triplicate.
Two-stage growth of cells for biomass accumulation.
Our studies show that maintenance of optimal physiological conditions for photoautotrophic growth of Arthrospira does not produce cultures that are highly active in fermentative H2 production. We explored the effects of several different growth conditions and found that growth under high light (260 μE/m2/s) and 1% CO2 bubbling yields a high biomass accumulation rate but low H2 production rate. To overcome this obstacle, we noted that the ages of Arthrospira cultures lead to significant differences in the rate profile for H2 production in the dark (Fig. 2). We describe next a two-stage growth cycle for optimal production of high cell density cultures, which may then be fermented with high hydrogen yields. We should note that we use the terminology “stage 1” and “stage 2” to describe the following two growth conditions. This is different from the terminology we will use to describe the two phases of hydrogen evolution seen under anaerobic conditions, which will be described subsequently.
FIG. 2.

Kinetics of the autofermentative H2 production rate in the dark by Arthrospira batch cultures 5, 10, and 30 days old. Cultures showed two distinct kinetic phases of H2 production, which we have termed phase 1 and phase 2. Phase 1 increases with the age of batch culture. At 5 and 10 days the kinetics have lag times prior to production of hydrogen of about 22 and 12 min, respectively. Phase 1 and phase 2 are merged together in the 30-day-old culture.
Growth stage 1: accumulation of biomass.
Cells were grown in “high light” (260 μE m−2 s−1) for 10 to 15 days after inoculation to steady-state concentrations. NaHCO3 at 200 to 400 mM buffers the starting pH of the medium to 9.8 and provides inorganic carbon, leading to 1 to 3 g (dry weight)/liter of culture. Typically, no bubbling or agitation was used. The use of a day/night (12 h/12 h) cycle extended the duration of culture viability during stage 2 compared to continuous illumination and was thus used. Stage 1 exhibits a rapid phase of cell growth and reaches maximum cell density at its end (10 to 15 days). Cells in stage 1 have a relatively high quantum efficiency of PSII (Fv/Fm = 0.48 to 0.52). For most experiments, cells were harvested after their growth under these stage 1 conditions.
Growth stage 2: steady-state growth phase and conditioning.
For experiments in Fig. 1 and 2, cells were “conditioned” for extended life of the culture and higher hydrogen production. Following the 10 to 15 days of stage 1 growth, cells were switched to moderate light intensity equal to 70 μE m−2 s−1 with shaking on an orbital shaker. The pH of the growth medium increased to 10.2 to 10.5 at the end of stage 1 as HCO3− concentrations in the media naturally decreased due to CO2 fixation and gas escape. In stage 2 the quantum efficiency of PSII drops to Fv/Fm of 0.38 to 0.42, which is significantly lower than younger cells in stage 1. This conditioning of cells in stage 2 may last up to 20 to 90 days without loss of viability. However, cells grown at higher light intensities in stage 1 have reduced viability in stage 2. The use of a diurnal-like light/dark illumination cycle (12 h/12 h) appears to condition the cells for the highest rate of dark H2 production. Fast activation of hydrogen production is then possible upon anaerobiosis (Fig. 2).
Temporal phases 1 and 2 of dark H2 production are products of metabolic events.
Figure 2 illustrates representative experimental data of dark H2 evolution rates from cell suspensions of Arthrospira maxima from 5-, 10-, and 30-day-old cultures (middle of stage 1, end of stage 1, and middle of stage 2 growth, respectively). Samples in the microvolume fermentation cell become anaerobic by respiratory consumption of residual O2 in the dark, as was confirmed separately using a Clark electrode to monitor O2 concentration (data not shown). O2 is fully consumed (<5 nM) within 2 to 3 min, whereupon H2 production starts. No further adaptation period is necessary, indicating that hydrogenase is active in photoautotrophically growing batch cultures in the presence of air and does not require an extended period of dark anaerobiosis for induction. Cells taken from cultures growing in early or late log phase exhibit two temporal phases of hydrogen evolution which are very repeatable. Within 2 to 3 min of the onset of O2 consumption, hydrogen evolution is observed; this is herein denoted as “phase 1.” The phase 1 hydrogen evolution decreases in rate within 2 to 3 h and typically lasts 3 to 4 h. Phase 1 is followed by a time window during which no detectable hydrogen is evolved. This “inactive” window lasts several hours but is then followed by a second phase of hydrogen evolution (termed phase 2) that begins anywhere from 8 to 18 h after anaerobic induction, depending upon the illumination history and age of the sample. Older cultures (after 10 to 20 days of stage 2 conditioning) produce H2 continuously as a result of the merging of phases 1 and 2, as the onset of phase 2 occurs earlier.
The evolution rate profile of dark H2 production by Arthrospira maxima has both sharp spikes and smooth peaks with distinctive kinetic profiles. For example, phase 1 may show up to three satellite peaks (Fig. 2; see also Fig. 4 and 6, below). As will be explained, these phases of H2 evolution reflect different metabolic states of cells resulting in distinct kinetic profiles. The number of spikes and their dynamics vary with both culture age and physiological conditions. The origin of the satellite H2 peaks has not been investigated in detail, but we hypothesize these reflect other electron reservoirs that come into redox equilibrium with NAD(P)H.
FIG. 4.

(A) Effect of light intensity during photoautotrophic growth upon the subsequent dark anaerobic H2 production rate; (B) effect of light during the H2 measurement. The high-light kinetic H2 production was obtained for A. maxima samples grown at a light intensity of 260 μE m−2 s−1; the low-light kinetic data present H2 production for the same culture 4 days later at a light intensity of 70 μE m−2 s−1. For illumination during measurements (B), the LED red light source (640 nm) was used with a duty cycle of 10% (light/dark periods of 10 s/90 s) with a peak intensity of 200 μE m−2 s−1, giving an average light intensity of 20 μE m−2 s−1.
FIG. 6.
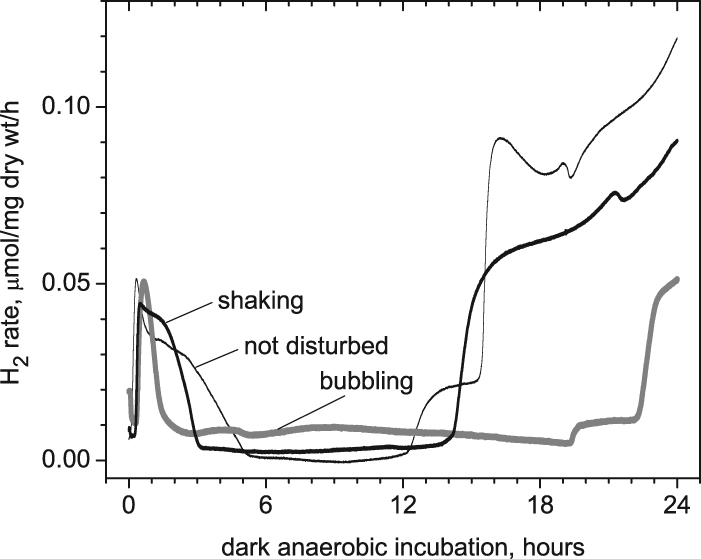
Effect of aeration method of Arthrospira maxima cultures during the photoautotrophic growth cycle prior to dark autofermentative H2 production. Cell concentrations were similar in cultures subjected to various agitation methods and grown for 10 to 12 days under stage 1 conditions. Undisturbed cells have an extended phase 1 H2 evolution kinetics and significantly more hydrogen from phase 2. Cultures bubbled with air give a shorter phase 1 and significantly delayed phase 2.
Figure 3 shows measurements of the in vitro hydrogenase activity taken from cells under aerobic conditions and after dark anaerobic induction for 3 and 20 h, as shown in Fig. 3 (bottom), with concurrent measurement of the hydrogen evolution rate (top) of a sample prepared in parallel.
A variety of experiments that test the effects of various physiological conditions on hydrogen production were next performed using a home-built rate electrode in order to find and understand the factors that increase hydrogen production from cells and to predict methods for increasing hydrogen rates and yields.
A. maxima cultures grown under high-oxygenation conditions (high surface area/low depth of the culture, intensive air bubbling, or 24-h illumination at a high light intensity, 260 μE m−2 s−1) exhibit complete loss of phase 1 hydrogen (data not shown). Conversely, young cultures (stage 1 growth up to 12 days old) exhibit increased phase 1 hydrogen when purged with nitrogen (6 to 24 h of purging prior to the onset of autofermentation), while phase 2 hydrogen is unaffected. Young cells that exhibit phase 1 hydrogen production, when sampled later in their photosynthetic growth cycle, always produce phase 1 hydrogen, even if high oxygenation conditions are applied. These studies reveal that phase 1 hydrogen yield is closely correlated with low respiration capacity. We interpret this as evidence that blockage of metabolic reductants that feed into respiration when O2 is available (for ATP production) are channeled into hydrogenase-dependent hydrogen evolution under anaerobiosis.
Effect of light.
Figure 4A shows that Arthrospira cultures grown under high light conditions (PFD = 260 μE m−2 s−1) result in low phase 1 dark anaerobic H2 production. Moving this same culture of cells to low light conditions (PFD = 70 μE m−2 s−1) for 4 days activates phase 1 hydrogen production. For the given representative data, both high-light and low-light samples had almost identical PSII quantum efficiencies (Fv/Fm = 0.47) and Kok parameters for their oxygen evolution cycle (miss and double-hit parameters of PSII-WOC), as measured by variable fluorescence (data not shown).
If cells are placed under dark anaerobic conditions for induction of fermentative hydrogen production, the integral H2 evolution from both phases is almost completely inhibited by direct low-level illumination (Fig. 4B), using an average light intensity of 20 μE m−2 s−1 (light duration of 10 s, dark period of 90 s). Note that the kinetic response of the rate of hydrogen production to the light pulses reveals immediate photo-induced “spikes” of hydrogen evolution (<0.1 s) superimposed on a slower loss of H2 production, reflecting a slower inactivation. This inactivation is, however, reversible, with full recovery of the dark H2 signal restored upon removal of light. The light response shall be detailed later in a separate study.
In Fig. 5 we show the effect of dark aerobic incubation time on the kinetics of anaerobic hydrogen production. Cells grown for 10 days were either placed directly under dark anaerobic conditions on the electrode (control) or were first placed in the dark for 3.5 h in the presence of air, allowing them to respire but not to engage in photosynthesis. Complete elimination of phase 1 hydrogen was observed after 3.5 h of dark aerobic incubation. The onset of phase 2 hydrogen was also delayed slightly, beginning after approximately 2 h in the control and 2.5 h in the sample that was allowed to respire for 3.5 h.
FIG. 5.

Effect of dark aerobic preincubation on dark anaerobic hydrogen production. Aerobic dark incubation for 3.5 h after illumination eliminates phase 1 hydrogen production, but not phase 2 hydrogen production. Cells were grown under standard conditions for 15 days (10 days at stage 1 and 5 days of conditioning in stage 2). Subsequently, cells were exposed to light (70 μE/m2/s) for 10 h and then placed on an electrode and covered with a glass slide for immediate anaerobiosis or first placed in aerobic darkness for 3.5 h, followed by dark anaerobic measurements of hydrogen evolution.
Effects of mechanical disturbance.
The temporal response of H2 evolution observed during the dark autofermentative phase depends on the kind of agitation used during the photoautotrophic growth. Figure 6 shows that nondisturbed Arthrospira cultures produced more dark H2 in both phase 1 (wider) and phase 2 (higher) than did shaken cultures, while air-purged cultures produced the least H2. We postulate that the type of agitation used during the light stage controls the degree of oxygenation by controlling how thoroughly the intracellular volume exchanges photosynthetic O2 with the medium, as well as the local concentration of necessary nutrients for anabolism. Using a magnetic stirrer and Teflon-covered magnetic bars results in visible fragmentation of Arthrospira trichoms, which further decreases the production of dark H2.
Effect of nitrogen purging.
To test our hypothesis about the importance of intracellular anoxic conditions, we tested the consequences of nitrogen gas purging to achieve a lower dissolved oxygen concentration during growth of Arthrospira cultures. In Fig. 7 we present data from young (8-day-old) cultures purged with nitrogen gas in the headspace, showing that removing dissolved O2 has no immediate response on the subsequent autofermentative H2 production (see the 6-h curve). However, prolonged purging (24-h curve) significantly activated phase 1 and did not change phase 2 appreciably. After 48 h of purging, phase 1 H2 was considerably enhanced by more than 20-fold relative to the 6-h results and was slower to evolve, while the onset of phase 2 was shifted from 8 h to 21 h.
FIG. 7.
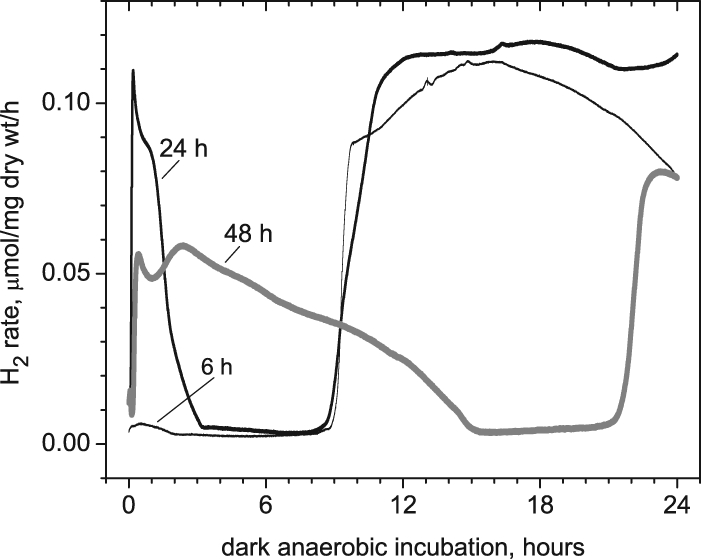
Effect on the dark autofermentative H2 production rate of prior continuous N2 purging in the headspace of Arthrospira maxima cultures during photoautotrophic growth for 8 days (stage 1 growth).
Effect of HCO3−.
Figure 8 shows the effects on dark hydrogen production of changing the available NaHCO3 concentration during the photoautotrophic growth stage. All samples were grown in light in 125 mM NaHCO3 for 10 days. NaHCO3 was subsequently added to the growth medium in concentrations of 0, 75, 275, or 475 mM, and cells were left under stage 1 photoautotrophic conditions for another 6 days. Cells were then harvested and measured on the rate electrode. Figure 8 shows that in all four samples phase 1 hydrogen yield was systematically suppressed at higher bicarbonate concentrations, while the onset of phase 2 hydrogen appeared successively sooner at 20, 14, and 8 h for 75, 275, and 475 mM NaHCO3, respectively. The H2 yield (area over 24 h) increased with added bicarbonate and was 1.2-, 2.5-, and 2.5-fold higher (for 75, 275, and 475 mM) than cells with no additional NaHCO3.
FIG. 8.
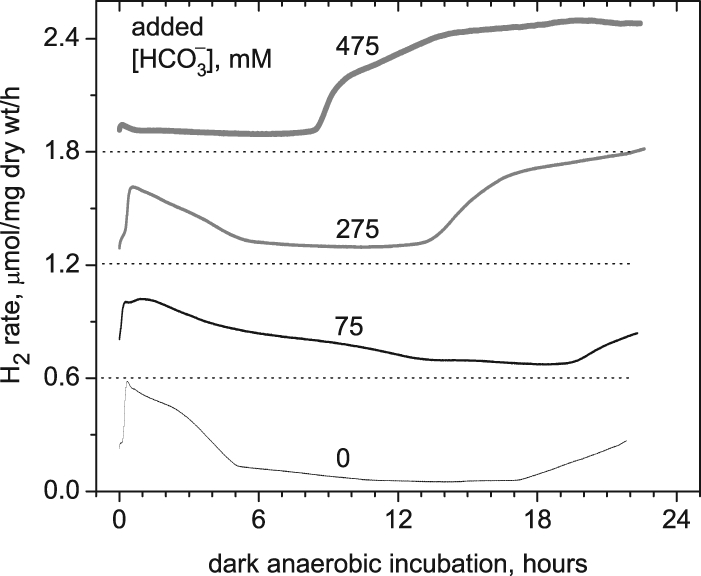
Effect of HCO3− concentration in Zarrouk medium on dark H2 production rate. The initial culture was grown for 10 days with 125 mM HCO3−. After that, NaHCO3 was added to the samples at concentrations of 0, 75, 275, and 475 mM. These cultures were allowed to acclimate for 6 additional days under stage 1 photoautotrophic conditions before autofermentative H2 measurements were performed in the dark. After acclimation to different HCO3− concentrations, the pH values were 10.7 ± 0.1 for all samples.
These results are supported by other measurements of H2 gas in the headspace above cell suspensions in sealed glass vials where H2 accumulation was allowed to occur after growth in 125 mM NaHCO3: when 0, 75, 275, or 475 mM NaHCO3 was added to the medium, the percent H2 in the headspace was 3.0, 2.9, 6.2, and 2.0, respectively (results of a single trial). With an intermediate [HCO3−] of 275 mM added to the growth medium, a significant (twofold) increase of H2 yield was observed in headspace measurements, in agreement with the observations on the hydrogen rate electrode. However, unlike the rate electrode results, when H2 accumulation was allowed to occur at 475 mM added NaHCO3, the H2 yield was suppressed by 33% relative to no addition and suppressed threefold relative to the peak yield.
Effect of NO3− depletion.
The immediate effect of NO3− depletion on the dark H2 production rate by Arthrospira maxima is shown in Fig. 9. Transfer of cells growing photoautotrophically in NO3− medium for 10 days (initially 30 mM) to identical Zarrouk medium lacking only NO3− produces an immediate 4.2-fold stimulation of the H2 yield over the first 24 h. This initial rate accelerates 3.3-fold faster than the control rate in the first 30 min and is limited by the time required to achieve anaerobiosis (measured separately via a Clark O2 electrode). The effect of removing nitrate on H2 production is both immediate and reversible. Restoration of NO3− to the medium during the fermentative phase immediately suppresses H2 production. The kinetics of disappearance of the stimulated H2 production rate upon readdition of nitrate are instantaneous.
FIG. 9.

Effect of NO3− depletion on the autofermentative H2 production rate in the dark. Photoautotrophically grown cells under normal stage 1 conditions were transferred to nitrate-depleted medium. Traces are labeled 1, 3, or 6 days of illumination following removal of nitrate. The initial culture was grown for 10 days in 30 mM NO3−. After that, Arthrospira cells were transferred to NO3−-free Zarrouk medium and illuminated at an intensity of 260 μE m−2 s−1 (12 h/12 h day to night cycle).
We emphasize that this instantaneous nitrate effect is different than the broadly reported observation that nitrogen starvation during photoautotrophic growth (often coupled to loss of phycobilin content) leads to increased glycogen accumulation and therefore higher fermentative hydrogen yields in cyanobacteria (4, 30, 41). In fact, longer incubation with NO3−-depleted medium of our cultures reduced H2 production (Fig. 9, 3 and 6 days) because of the loss of cell viability. When these cells were slowly fed low levels of nitrate to maintain cell viability and prevent lysis during this dark anaerobic incubation, we confirmed the increase in fermentative hydrogen production described in these reports, and this correlated with higher levels of glycogen accumulation (data not shown). We also confirmed that glycogen content increases under photoautotrophic growth upon nitrate depletion.
Effect of pH.
The autofermentative H2 production in the dark by Arthrospira strongly depends on the external pH of the buffer in which cells are resuspended for measurements, with lower pH stimulating phase 2 hydrogen (Fig. 10). At pH 7.0 phase 1 has a much higher amplitude and is wider compared to the physiological pH 10.2. At these alkaline conditions, phase 1 was extended in time and merged with phase 2.
FIG. 10.

Effects of pH of the autofermentation medium during measurement of H2 production in the dark by Arthrospira. Cells were grown under normal stage 1 conditions for 10 days (starting pH, 9.8). For pH adjustment of the medium, solid morpholineethanesulfonic acid or 6 N HCl was added in a sufficient quantity to bring the pH to 7.0 or 8.0, respectively.
By contrast, growth of Arthrospira at a lower pH than 9.5 to 10 reduces the biomass yield, and this works opposite to the favorable effect of lower pH on the H2 yield. If cells are grown at pH 6, the hydrogen from these cells is significantly lower (see Fig. S3 in the supplemental material). If Arthrospira cells are grown and fermented at the same pH, then pH 8.0 appears to be the best compromise for achieving better hydrogen yield with adequate biomass yield.
DISCUSSION
The use of cyanobacteria to produce biomass as a precursor to liquid fuels and hydrogen gas has been pursued as a potential future technology for offsetting dependence on fossil fuels. Current use of this technology for hydrogen production is limited by the low solar-to-hydrogen energy conversion efficiency and the slow achievable rates of conversion under autofermentation conditions. Practical developments are thus focused on finding ways to improve both of these limitations.
By growing cells in nickel-sufficient medium (12) via a two-stage illumination process involving rapid growth in high light (actually ca. 25% of full solar intensity) followed by subsequent low-light conditioning, we were able to obtain cultures with significantly higher hydrogen production yields. Conditioned cells concentrated to densities of 15.1 g (dry weight)/liter and placed under dark anaerobic conditions produced as much as 36 ml H2/g (initial dry weight) (or 550 ml of H2/liter) in 10 days (Fig. 1), corresponding to 10% H2 in the headspace. In some experiments concentrated cell suspensions produce as much as 18% H2 in the headspace (Table 1). We believe this partial pressure is limiting, as addition of exogenous fermentable substrates to cultures also has the same upper limit. This means that removal of H2 from the fermenting culture is a key requirement for achieving the maximum conversion yield. It would be insightful to examine in future experiments whether the relative fluxes to other fermentative end products (ethanol, lactate, acetate, and formate) are redirected after attaining maximum hydrogen partial pressure in the headspace and if this maximum partial pressure could be surpassed with environmental stimuli or mutagenesis techniques that eliminate these competing pathways.
Another consideration is the total amount of biomass which can be converted to hydrogen and other fermentation products. Our results show that a single autofermentation cycle which produces 90% of the maximum H2 yield requires the conversion of 26% of the starting cell dry weight, not all of which is fermented glycogen. The products include both volatile and liquid products of the autofermentation process, which include carbon dioxide, lactate, ethanol, acetate, and formate, as has been observed by us with Arthrospira maxima (unpublished results) and has been reported by others with Arthrospira platensis (4). Pathways that reoxidize NADH, such as lactic acid, formate, and ethanol production, compete with hydrogen evolution and lower the molecular ratio of hydrogen per hexose equivalent.
For practical applications in fuel production, increasing the molar ratio of hydrogen production will be needed, and an acceleration of the rate of H2 production to match the diurnal cycle will also be needed. These topics are under investigation.
Our ultrasensitive electrode for measuring dissolved H2 (13) has allowed measurement of the detailed kinetic profile of autofermentative hydrogen evolution in the dark, revealing two temporal phases and a satellite substructure resolved in Arthrospira maxima. We have confirmed this attribute to be general in two other genera of cyanobacteria (Synechococcus and Cyanothece) (unpublished results). This observation is a novel feature of microbial hydrogen evolution not previously recognized. The absence of both the uptake hydrogenase and nitrogenase genes from the genome of A. maxima and the presence of a single hox gene cluster offers the simplest native configuration and allows us to interpret the kinetic data in terms of a single class of bidirectional hydrogenases. The perturbations examined herein indicate that these two phases of H2 production have distinct metabolic origins and appear to correlate with the process of oxidation of intracellular NADPH produced in prior photosynthetic metabolism (phase 1) and NADH produced by fermentative metabolism (phase 2), respectively, as described below. Because both of these H carriers have standard electrochemical potentials that are 100 mV below that required to equal the standard potential for proton reduction to H2, the thermodynamics requires a ∼1,000-fold excess of reduced-to-oxidized NAD(P)H and NAD(P)+ to achieve isoenergetic conversion to H2. Thus, the temporal response of H2 production observed in our data must reflect the unfavorable competition for reductant flow into more favorable energy sinks.
Redox cycling of both types of pyridine nucleotides provides the basis for ATP regeneration in microorganisms. Our results support a role for hydrogenase-dependent autofermentative H2 production primarily in sustaining intracellular energy production in cyanobacteria under dark anaerobic conditions. This idea has been one of two other postulated functions for the bidirectional hydrogenase in cyanobacteria, including as an electron valve for relieving intracellular reductive stress (6) and for the uptake of hydrogen-reducing equivalents produced by other microorganisms (26).
ATP regeneration by algae and cyanobacteria can be powered by three distinct types of metabolism: (i) photosynthesis-driven phosphorylation (photophosphorylation), (ii) respiration of exogenous substrates or photosynthesis products, like glycogen and osmolytes (via H carriers, primarily NADPH, NADH, and succinate) using O2 (35), and (iii) by anaerobic fermentation (via substrate level phosphorylation) (32, 38). While photosynthesis and respiration appear to be universal energy metabolisms found within all of the diverse genera of cyanobacteria, indeed all oxygenic phototrophs, fermentation has not been found universally in cyanobacteria, but it also has been much less studied (38). Which of these distinct energy metabolisms is present in cyanobacteria depends upon their physiological needs and ecological habitat.
Survival in the wild by Arthrospira maxima requires a high demand for ATP. This hypercarbonate-requiring strain must constantly pump out high levels of Na+, which is cotransported with (bi)carbonate as the CO2 source for carboxylation and which is present in high levels (<1.2 M) in its natural habitat (11). Cells do so via an ATP-requiring Na+ pump (8). Arthrospira filaments are motile, which also requires ATP hydrolysis to produce the force needed for motion. These functions do not stop in darkness, e.g., during diurnal cycling when photophosphorylation stops, nor during periods of anaerobiosis, which occurs routinely at night in the unstirred aquifers of their natural habitat. The resulting absence of O2-dependent respiratory ATP regeneration with its high-yielding ATP/electron conversion requires the existence of an efficient backup system(s) for ATP generation in Arthrospira. Cyanobacteria that live in such environments must therefore exploit effective fermentative pathways (38).
Our data reveal that physiological perturbations to fermenting cultures have pronounced and different effects on the two temporal phases of hydrogen evolution. The time profile of dark H2 production rate exhibits strong surges: it can reach high rates within 30 min of anaerobiosis and decrease to almost zero in a couple hours. Because the in vitro hydrogenase activity measured anaerobically (with the methyl viologen assay) using extracts from lysed cells does not change significantly during the transition from aerobic to anaerobic culturing over 20 h (Fig. 3B), it is clear that the rapid variation of H2 rate seen in vivo is not due to different expression levels of active enzyme but rather must be due to the dynamics of substrate availability [NAD(P)H and/or protons] or other regulatory control of the hydrogenase protein that does not influence the methyl viologen assay.
A schematic for the identification of the nature of these metabolic transitions is shown in Fig. 11. Some elements of this scheme have been proposed by others (3). Figures 4 to 9 lead us to conclude that there are two temporally separated pools of reducing equivalents (NADH and NADPH) that are precursors to hydrogen production. Photosynthesis creates a large amount of reductant in the form of NADPH, which is consumed primarily by respiration to produce ATP, by carbon fixation to produce sugars, and by nitrogen assimilation to produce protein (via ferredoxins). In the presence of oxygen, the NADPH/NADP+ ratio does not steadily increase, as there is constant reoxidation of NADPH via respiration. In the absence of oxygen, nitrate assimilation and carbon fixation still oxidize the NADPH pool, but respiration is unavailable. Consequently, a higher NADPH/NADP+ ratio accumulates, allowing for hydrogen production either by direct reoxidation of NADPH via the diaphorase moiety of hydrogenase or through NADPH/NAD+ trans-oxido-reductases, which first generate NADH which is subsequently reoxidized by the diaphorase moiety on hydrogenase. This dark oxidation of light-induced reductant, transiently generated by photosynthesis, is our proposal for the source of phase 1 hydrogen. Once this reductant pool is depleted below the thermodynamically required excess, hydrogen evolution wanes, leading to a period of time following phase 1 when minimal hydrogen evolution is observed.
FIG. 11.

Origin of reduction equivalents for phase 1 and phase 2 hydrogen production. Electrons derived from water are used to reduce ferredoxin (Fd) and subsequently NADPH. NADPH equivalents contribute to phase 1 hydrogen or are oxidized by competing pathways, such as carbon fixation (to make glyceraldehyde-3-phosphate [GAP] and biosynthetic precursors), respiration (oxidative phosphorylation), or nitrate assimilation via ferredoxin (to make protein). In the absence of oxygen, stored energy compounds made by carbon fixation (such as osmolytes and glycogen) can be fermented to produce ATP for the cell and subsequently make NADH, which can be reoxidized to NAD+ through production of organic acids and alcohols, through nitrate assmilation via ferredoxin, or to produce phase 2 hydrogen.
We propose that phase 2 hydrogen evolution originates from NADH equivalents generated via catabolism of accumulated sugars (glycogen, osmolytes, and biomass). Catabolism of sugars is driven by the need for ATP, which is generated by substrate-level phosphorylation of ADP via the Embden-Meyerhof-Parnas pathway (glycolysis). The resulting NADH must be reoxidized to allow continued regeneration of NAD+. NAD+ may be regenerated by reduction of glycolytically produced pyruvate to form ethanol or lactic acid. Alternatively, NADH can also reduce protons via hydrogenase, resulting in phase 2 hydrogen. The data in Fig. 4 to 9 support this model entirely (Fig. 11), as will be discussed next.
Both the light intensity and O2 partial pressure are critical physiological parameters that influence hydrogen production in cyanobacteria in multiple ways. It is known that creating a low intracellular O2 concentration is essential for activity of the NAD(P)H-dependent hydrogenases, which are reversibly suppressed directly by O2 produced by PSII (23). The intracellular redox level of cyanobacteria in the dark is set by the prior level of photosynthetic metabolism (NADPH and PQH2 regeneration), competition between oxidative breakdown of glycogen (yielding NADH and NADPH), and respiration on O2 (consuming both). Anaerobiosis leads directly to an increase in the NADPH/NADP+ ratio (E0, −320 mV) and the NADH/NAD+ ratio (E0, −320 mV). Both reduced pyridine nucleotides may equilibrate independently with the PQ pool by exchange of hydrides mediated enzymatically by the NDH-1 and NDH-2 enzymes (35). The redox state of the PQ pool also serves as an effective regulator of redox-responsive gene expression (19).
Using different light intensities during the photoautotrophic growth stage greatly alters the subsequent dark anaerobic hydrogen evolution activity for both phase 1 and phase 2 hydrogen, as shown in Fig. 4A. Phase 1 hydrogen evolution has a 2.5- to 3-fold-lower H2 yield from cells grown at 3.7-fold-higher light intensity than these same cells adapted to lower light flux (70 μE m−2 s−1). Under these higher light conditions, the cells are known to produce more NADPH and glycogen by photosynthesis (40), yet less phase 1 hydrogen evolves, suggesting an upregulation of processes that consume NADPH (such as carbon fixation, nitrogen assimilation, and/or respiration [Fig. 11]). Meanwhile, phase 2 hydrogen evolution is dramatically higher for high-light-grown cultures. We propose that this is the result of fermentation of the elevated glycogen content or other energy storage compounds, such as osmolytes produced during the photosynthetic growth phase. However, it is important to note that while high-light-grown cells produce more phase 2 H2, we observed that cell lysis during prolonged fermentation cycles was greater as well, thereby reducing cell longevity and compromising overall H2 yields over the cell life cycle.
By contrast, low-level illumination during the anaerobic stage using brief pulses of red light spaced by longer dark periods (200 μE m−2 s−1 during the light period), as shown in Fig. 4B, produced a pronounced suppression of phase 1 hydrogen yield, plus a small positive transient photo-H2 response. The customary interpretation of this loss of activity is O2 poisoning of hydrogenase (14). We know that oxygen does play a role in reversibly inactivating the [NiFe] hydrogenase found in Arthrospira, but it also leads to consumption of the NADPH pool by respiration. By oxidizing this pool, less NADPH is available for reduction of protons (Fig. 11). In future work, wavelength-selective excitation of the individual photosystems would help provide a means for untangling how electrons from PSI and PSII may contribute or suppress H2 production.
Two effects are observed when cells are left under dark aerobic conditions before subsequent anaerobiosis, as illustrated in Fig. 5: (i) phase 1 hydrogen evolution is eliminated, and (ii) the onset of phase 2 hydrogen evolution is delayed upon increased aerobic mixing in the dark by air bubbling. Both of these observations can be explained by the redirection of reducing equivalents into oxidative phosphorylation in the presence of oxygen. By placing cells under dark aerobic conditions, cells are allowed to respire while photosynthesis is stopped. Likewise, NADPH will no longer be produced photosynthetically but will continue to feed into respiration to produce ATP and lower the NADPH/NADP+ ratio in the cell. The lowered NADPH/NADP+ ratio eliminates the potential for phase 1 hydrogen upon anaerobiosis. Once this pool is drained, the cell will maintain ATP production by catabolizing internal energy stores (e.g., glycogen and osmolytes), also feeding electrons from this process (in the form of NADH) into oxidative phosphorylation. This process can produce 10 times the amount of ATP per glucose than does fermentation, allowing the cell to build up a reserve of ATP. Once cells go anaerobic, they are reliant on substrate-level phosphorylation for ATP production. Cells that are allowed to respire for longer periods of time before anaerobiosis will have a larger pool of ATP and can thus delay the fermentative accumulation of NADH that leads to phase 2 hydrogen.
The yield of phase 1 hydrogen (area under the curves in Fig. 6) decreases when the photosynthetically growing cells are more effectively aerated by air bubbling > shaking in air > unstirred/standing in air. The areas under the curves for phase 1 H2 in Fig. 6 are 15, 40, and 59 μmol/mg (dry weight), respectively, over the 24-h period. We interpret this as support that photosynthetically regenerated NADPH, which is consumed by aerobic respiration, is less available in well-aerated samples, resulting in lower H2 yields in the anaerobic phase 1.
Note also in Fig. 6 that phase 2 H2 is significantly delayed by 5 to 9 h in cultures that are maximally aerated by air bubbling, relative to less-well-aerated cultures. Again, since more complete mixing in air is known to drive respiration faster, it oxidizes a greater fraction of NADPH and therefore yields more ATP than less-well-aerated cultures. With more ATP in storage this means there is less need for ATP generation by fermentation of glycogen in the ensuing dark anaerobic period, resulting in an appreciable delay of the onset of phase 2 hydrogen.
In further support of this interpretation, phase 1 hydrogen evolution increases after prolonged nitrogen gas purging during the prior photoautotrophic stage (Fig. 7). Under these conditions we expect that the intracellular oxygen concentration of young cells is appreciably lowered under nitrogen-purging conditions, leading to much lower flux of reductant into respiration and consequently partial reduction of the PQ pool. According to our hypothesis, this elevated micro-oxic state during photosynthesis should lead to a buildup of NADPH formed via classical linear electron transport of PSII to PSI, which is actually stimulated by the overreduced state of the PQ pool (35). A reduced PQ pool is also known to downregulate cyclic electron flow around PSI, thereby further reducing the conversion of NADPH reductant into ATP production by the classical proton gradient mechanism of photophosphorylation (15). Our interpretation leads to the conclusion that phase 1 hydrogen arises entirely from NADPH produced during the photosynthetic stage, while phase 2 hydrogen has a different metabolic origin. The onset time for the rise of phase 2 hydrogen production depends upon the energy demand on the cells and thus changes with environmental stimuli and physiological status (e.g., age, light intensity, etc.). One example of this is seen in the reciprocal relationship between phase 2 hydrogen production and the concentration of nitrate in the fermentative medium, as will be presented in a future manuscript.
The two major substrates for growth of A. maxima are carbonate and nitrate. Both are assimilated by reactions that require ATP and are converted by intracellular reductants, and both exhibit strong effects on hydrogen evolution. Figure 1 predicts that perturbations in the availabilities of carbonate and nitrate should affect both phase 1 and phase 2 hydrogen production.
Bicarbonate is an important anion that modulates electron transport in photosystem II between QA and QB (9) and is involved in donor side reactions of PSII (11, 29, 42). It is also, of course, the hydrated form of CO2 used by cells for the Calvin-Benson-Bassham cycle, and in Arthrospira HCO3− is the dominant form of inorganic carbon that can enter the cell (8, 11). Figure 8 shows the major importance of increasing sodium bicarbonate concentration on accelerating the onset and increasing the yield of phase 2 hydrogen. This strong correlation clearly shows that the precursors necessary to make phase 2 H2 during fermentation are more quickly and extensively available at increasing levels of sodium bicarbonate. We conclude that the higher demand for ATP necessary to maintain intracellular osmotic balance, via ATP-dependent pumping of sodium, triggers the earlier and deeper demand for anaerobic ATP production by glycogen breakdown. The resulting acceleration and increase in NADH production is then directly coupled to H2 production. On the other hand, increased availability of carbonate to the cell decreases phase 1 hydrogen. This is expected as increasing levels of CO2 to the cell accelerate carbon fixation, a major sink for NADPH.
Nitrate is the sole nitrogen source available in Zarrouk medium for growth of Arthrospira maxima cells (which lack nitrogenase). Nitrate depletion produces an immediate and rapid increase in the hydrogen evolution rate and a merging of phase 1 and phase 2 hydrogen toward continuous production (Fig. 9). This initial rate acceleration and yield stimulation are the largest effects of any physiological perturbation we have reported in this work. This reveals that nitrate reduction competes directly with proton reduction for consumption of NAD(P)H. Nitrate is coupled into cellular metabolism by a series of enzymatically catalyzed reduction steps that oxidize ferredoxin (the cognate electron donor to cyanobacterial nitrate reductase) (20), which ultimately drains electrons from NADH and NADPH via specific ferredoxin-NAD(P)H oxidoreductases. While the availability of nitrate is essential for biomass accumulation, it strongly limits hydrogen evolution. The competition with nitrate for hydrogen production has been previously reported for Synechocystis sp. strain PCC 6803 (24) and in the green alga Chlamydomonas reinhartii (5). We expect that older cultures grown in batch mode will have naturally depleted nitrate from cellular uptake. This explains the merging of phase 1 and phase 2 seen in 30-day-old cultures in Fig. 2. It will be useful to learn if nitrate reduction is coupled to ATP production under anaerobic conditions, as we suspect, or if it is simply an electron sink. We are currently investigating this question as well as determining the fate of ammonia after nitrate reduction, in particular, whether ammonia is incorporated into protein synthesis during anaerobiosis or simply excreted to the medium.
Figure 11 explains phase 1 and phase 2 hydrogen evolution in terms of available NAD(P)H for reducing protons, but obviously proton availability to hydrogenases will also affect hydrogen evolution rates. Placing fermenting cells under more acidic conditions stimulates phase 2 hydrogen evolution but decreases phase 1. A quantitative interpretation of these data in terms of proton availability is complex with whole cells and will be deferred to future work. However, we note that while A. maxima cells grow best at pH 9.8, hydrogen evolution is best stimulated at lower pH. This is another example of conditions which are optimal for autofermentative hydrogen evolution but not for photoautotrophic growth.
Overall, our observations lead to four main conclusions: (i) anaerobic hydrogen production in the dark by nondiazotrophic cyanobacteria involves two distinct metabolic processes that are linked to photosynthetic production of NADPH and fermentative production of NADH, respectively; (ii) hydrogen evolution is a major pathway for energy production during fermentation, which responds to environmental and nutritional perturbations in a predictable way consistent with a role as a terminal electron acceptor during anaerobic metabolism; this role enables hydrogenase to regenerate the NAD+ essential to maintaining the flux of reductant from glycogen via glycolysis and other substrates of catabolism (Fig. 11); (iii) nitrate is a significant electron sink for intracellular reducing equivalents that compete with hydrogen evolution; removal of nitrate from fermenting cells leads to a large increase in hydrogen evolution and a merging of phase 1 and phase 2; (iv) physiological and nutritional conditions that are optimal for photoautotrophic growth are often nonoptimal for hydrogen evolution (12); notably, factors that increase ATP production (sodium extrusion to maintain osmotic balance) and elevate intracellular reduction potential (NADH/NAD+ level) favor H2 evolution. The accumulation of stored carbohydrates for fermentation is clearly the main approach for optimizing dark H2 yield, together with conditions that optimize cell growth and then conditioning for reliance on fermentation, which are equally important for cyanobacterial hydrogen production.
Comparison of the yield and rate of H2 production by A. maxima (Table 1) versus other oxygenic phototrophs provides a useful benchmark for future improvements. The National Renewable Energy Laboratory group reports a photo-hydrogen rate under sulfur-deprivation conditions for Chlamydomonas reinhardtii of 60 ml H2/g (initial dry weight)/day (batch mode) (M. Seibert, personal communication), assuming 1 g (dry weight)/liter of culture, which is significantly higher than what we see with batch-mode cultures of A. maxima. The autofermentatiave rate reported for A. platensis under comparable cell densities and conditions is not available. However, the authors did report the value corresponding to 5.4 ml H2/g (initial dry weight)/day at 30°C under stress conditions that all favor H2 production relative to our experiments: a forced nitrate deprivation, dilute ionic strength (20 mM), phosphate buffer (pH 7.0), and lower cell density (8.7 g/liter) (4). In future work we shall address the very large stimulation in H2 yields which can be observed by the application of various environmental and nutritional stresses.
Supplementary Material
Acknowledgments
We express special thanks to coworkers Kelsey McNeely and Derrick Kolling, to our collaborators Donald A. Bryant at Penn State University and Matthew Posewitz at Colorado School of Mines for their advice, and to Oliver Lenz from Humbholt University for useful comments on the manuscript. We also thank Mike Seibert at the National Renewable Energy Laboratory for sharing his results on hydrogen yields from sulfur-deprived cultures of C. reinhardtii.
This research was supported by the Air Force Office of Scientific Research (MURI grant FA9550-05-1-0365).
Footnotes
Published ahead of print on 1 August 2008.
Supplemental material for this article may be found at http://aem.asm.org/.
REFERENCES
- 1.Ananyev, G., and G. C. Dismukes. 2005. How fast can photosystem II split water? Kinetic performance at high and low frequencies. Photosynth. Res. 84:355-365. [DOI] [PubMed] [Google Scholar]
- 2.Ananyev, G. M., and G. C. Dismukes. 1996. Assembly of the tetra-Mn site of photosynthetic water oxidation by photoactivation: Mn stoichiometry and detection of a new intermediate. Biochemistry 35:4102-4109. [DOI] [PubMed] [Google Scholar]
- 3.Antal, T. K., and P. Lindblad. 2005. Production of H2 by sulphur-deprived cells of the unicellular cyanobacteria Gloeocapsa alpicola and Synechocystis sp. PCC 6803 during dark incubation with methane or at various extracellular pH. J. Appl. Microbiol. 98:114-120. [DOI] [PubMed] [Google Scholar]
- 4.Aoyama, K., I. Uemura, J. Miyake, and Y. Asada. 1997. Fermentative metabolism to produce hydrogen gas and organic compounds in a cyanobacterium, Spirulina platensis. J. Ferment. Bioeng. 83:17-20. [Google Scholar]
- 5.Aparicio, P. J., M. P. Azuara, A. Ballesteros, and V. M. Fernandez. 1985. Effects of light intensity and oxidized nitrogen sources on hydrogen production by Chlamydomonas reinhardii. Plant Physiol. 78:803-806. [DOI] [PMC free article] [PubMed] [Google Scholar]
- 6.Appel, J., S. Phunpruch, K. Steinmuller, and R. Schulz. 2000. The bidirectional hydrogenase of Synechocystis sp. PCC 6803 works as an electron valve during photosynthesis. Arch. Microbiol. 173:333-338. [DOI] [PubMed] [Google Scholar]
- 7.Benemann, J. R. 2000. Hydrogen production by microalgae. J. Appl. Phycol. 12:291-300. [Google Scholar]
- 8.Berry, S., Y. V. Bolychevtseva, M. Rogner, and N. V. Karapetyan. 2003. Photosynthetic and respiratory electron transport in the alkaliphilic cyanobacterium Arthrospira (Spirulina) platensis. Photosynth. Res. 78:67-76. [DOI] [PubMed] [Google Scholar]
- 9.Blubaugh, D. J., and Govindjee. 1988. The molecular mechanism of the bicarbonate effect at the plastoquinone reductase site of photosynthesis. Photosynth. Res. 19:85-128. [DOI] [PubMed] [Google Scholar]
- 10.Boichenko, V. A., E. Greenbaum, and M. Seibert. 2004. Hydrogen production by photosynthetic microorganisms, p. 397-452. In M. D. Archer and J. Barber (ed.), Photoconversion of solar energy: molecular to global photosynthesis, vol. 2. Imperial College Press, London, England. [Google Scholar]
- 11.Carrieri, D., G. Ananyev, T. Brown, and G. C. Dismukes. 2007. In vivo bicarbonate requirement for water oxidation by photosystem II in the hypercarbonate-requiring cyanobacterium Arthrospira maxima. J. Inorg. Biochem. 101:1865-1874. [DOI] [PubMed] [Google Scholar]
- 12.Carrieri, D., G. Ananyev, A. M. Garcia Costas, D. A. Bryant, and G. C. Dismukes. 2008. Renewable hydrogen production by cyanobacteria: nickel requirements for optimal hydrogenase activity. Int. J. Hydrogen Energy 33:2014-2022. [Google Scholar]
- 13.Carrieri, D., D. Kolling, G. Ananyev, and G. C. Dismukes. 2006. Prospecting for biohydrogen fuel. Ind. Biotechnol. 2:133-137. [Google Scholar]
- 14.Cournac, L., G. Guedeney, G. Peltier, and P. M. Vignais. 2004. Sustained photoevolution of molecular hydrogen in a mutant of Synechocystis sp. strain PCC 6803 deficient in the type I NADPH-dehydrogenase complex. J. Bacteriol. 186:1737-1746. [DOI] [PMC free article] [PubMed] [Google Scholar]
- 15.Cournac, L., F. Mus, L. Bernard, G. Guedeney, P. Vignais, and G. Peltier. 2002. Limiting steps of hydrogen production in Chlamydomonas reinhardtii and Synechocystis PCC 6803 as analysed by light-induced gas exchange transients. Int. J. Hydrogen Energy 27:1229-1237. [Google Scholar]
- 16.Dismukes, G. C., D. Carrieri, N. Bennette, G. M. Ananyev, and M. C. Posewitz. 2008. Aquatic phototrophs: efficient alternatives to land-based crops for biofuels. Curr. Opin. Biotechnol. 19:235-240. [DOI] [PubMed] [Google Scholar]
- 17.Dutta, D., D. De, S. Chaudhuri, and S. K. Bhattacharya. 2005. Hydrogen production by Cyanobacteria. Microb. Cell Fact. 4:36. [DOI] [PMC free article] [PubMed] [Google Scholar]
- 18.Ernst, A., H. Kirschenlohr, J. Diez, and P. Boger. 1984. Glycogen-content and nitrogenase activity in Anabaena variabilis. Arch. Microbiol. 140:120-125. [Google Scholar]
- 19.Falkowski, P. G., and J. A. Raven. 1997. Aquatic photosynthesis. Blackwell, Malden, United Kingdom.
- 20.Flores, E., J. E. Frias, L. M. Rubio, and A. Herrero. 2005. Photosynthetic nitrate assimilation in cyanobacteria. Photosynth. Res. 83:117-133. [DOI] [PubMed] [Google Scholar]
- 21.Gaffron, H., and J. Rubin. 1942. Fermentative and photochemical production of hydrogen in algae. J. Gen. Physiol. 26:219-240. [DOI] [PMC free article] [PubMed] [Google Scholar]
- 22.Gest, H., and M. D. Kamen. 1949. Photoproduction of molecular hydrogen by Rhodospirillum rubrum. Science 109:558-559. [DOI] [PubMed] [Google Scholar]
- 23.Ghirardi, M. L., M. C. Posewitz, P. C. Maness, A. Dubini, J. P. Yu, and M. Seibert. 2007. Hydrogenases and hydrogen photoproduction in oxygenic photosynthetic organisms. Annu. Rev. Plant Biol. 58:71-91. [DOI] [PubMed] [Google Scholar]
- 24.Gutthann, F., M. Egert, A. Marques, and J. Appel. 2007. Inhibition of respiration and nitrate assimilation enhances photohydrogen evolution under low oxygen concentrations in Synechocystis sp. PCC 6803. Biochim. Biophys. Acta 1767:161-169. [DOI] [PubMed] [Google Scholar]
- 25.Harrison, D. K., and M. Kessler. 1989. A multiwire hydrogen electrode for in vivo use. Phys. Med. Biol. 34:1397-1412. [DOI] [PubMed] [Google Scholar]
- 26.Houchins, J. 1984. The physiology and biochemistry of hydrogen metabolism in cyanobacteria. Biochim. Biophys. Acta 768:227-255. [Google Scholar]
- 27.Kebede, E., and G. Ahlgren. 1996. Optimum growth conditions and light utilization efficiency of Spirulina platensis (equals Arthrospira fusiformis) (Cyanophyta) from Lake Chitu, Ethiopia. Hydrobiologia 332:99-109. [Google Scholar]
- 28.Kerly, M. 1930. The solubility of glycogen. Biochem. J. 24:67-76. [DOI] [PMC free article] [PubMed] [Google Scholar]
- 29.Klimov, V. V., and S. V. Baranov. 2001. Bicarbonate requirement for the water-oxidizing complex of photosystem II. Biochim. Biophys. Acta Bioenerg. 1503:187-196. [DOI] [PubMed] [Google Scholar]
- 30.Kumazawa, S., and A. Mitsui. 1981. Characterization and optimization of hydrogen photoproduction by a salt-water blue-green alga, Oscillatoria sp. Miami BG7. I. Enhancement through limiting the supply of nitrogen nutrients. Int. J. Hydrogen Energy 6:339-348. [Google Scholar]
- 31.Ludwig, M., R. Schulz-Friedrich, and J. Appel. 2006. Occurrence of hydrogenases in cyanobacteria and anoxygenic photosynthetic bacteria: implications for the phylogenetic origin of cyanobacterial and algal hydrogenases. J. Mol. Evol. 63:758-768. [DOI] [PubMed] [Google Scholar]
- 32.Mahro, B., A. C. Kiisel, and L. H. Grimme. 1986. The significance of hydrogenase activity for the energy metabolism of green algae: anaerobiosis favours ATP synthesis in cells of Chlorella with active hydrogenase. Arch. Microbiol. 144:91-95. [Google Scholar]
- 33.Mitsui, A., E. J. Phlips, S. Kumazawa, K. J. Reddy, S. Ramachandran, T. Matsunaga, L. Haynes, and H. Ikemoto. 1983. Progress in research toward outdoor biological hydrogen-production using solar-energy, sea-water, and marine photosynthetic microorganisms. Ann. N. Y. Acad. Sci. 413:514-530. [Google Scholar]
- 34.Mussgnug, J. H., S. Thomas-Hall, J. Rupprecht, A. Foo, V. Klassen, A. McDowall, P. M. Schenk, O. Kruse, and B. Hankamer. 2007. Engineering photosynthetic light capture: impacts on improved solar energy to biomass conversion. Plant Biotechnol. J. 5:802-814. [DOI] [PubMed] [Google Scholar]
- 35.Peschek, G. A., C. Obinger, and M. Paumann. 2004. The respiratory chain of blue-green algae (cyanobacteria). Physiol. Plant. 120:358-369. [DOI] [PubMed] [Google Scholar]
- 36.Rocheleau, R., and J. R. Benemann. 2000. Biohydrogen production, final summary report, 1996-2000. Report to the U.S. Department of Energy. Hawaii Natural Energy Institute, University of Hawaii, Manoa. http://www.hnei.hawaii.edu/HNEI2001H2Rptfinal.pdf.
- 37.Rupprecht, J., B. Hankamer, J. H. Mussgnug, G. Ananyev, C. Dismukes, and O. Kruse. 2006. Perspectives and advances of biological H2 production in microorganisms. Appl. Microbiol. Biotechnol. 72:442-449. [DOI] [PubMed] [Google Scholar]
- 38.Stal, L. J., and R. Moezelaar. 1997. Fermentation in cyanobacteria. FEMS Microbiol. Rev. 21:179-211. [Google Scholar]
- 39.Tamagnini, P., R. Axelsson, P. Lindberg, F. Oxelfelt, R. Wunschiers, and P. Lindblad. 2002. Hydrogenases and hydrogen metabolism of Cyanobacteria. Microbiol. Mol. Biol. Rev. 66:1-20. [DOI] [PMC free article] [PubMed] [Google Scholar]
- 40.Tomaselli, L., G. Boldrini, and M. C. Margheri. 1997. Physiological behaviour of Arthrospira (Spirulina) maxima during acclimation to changes in irradiance. J. Appl. Phycol. 9:37-43. [Google Scholar]
- 41.Troshina, O., L. Serebryakova, M. Sheremetieva, and P. Lindblad. 2002. Production of H2 by the unicellular cyanobacterium Gloeocapsa alpicola CALU 743 during fermentation. Int. J. Hydrogen Energy 27:1283-1289. [Google Scholar]
- 42.van Rensen, J. J. S. 2002. Role of bicarbonate at the acceptor side of photosystem II. Photosynth. Res. 73:185-192. [DOI] [PubMed] [Google Scholar]
- 43.Vignais, P. M., and B. Billoud. 2007. Occurrence, classification, and biological function of hydrogenases: an overview. Chem. Rev. 107:4206-4272. [DOI] [PubMed] [Google Scholar]
- 44.Vignais, P. M., B. Billoud, and J. Meyer. 2001. Classification and phylogeny of hydrogenases. FEMS Microbiol. Rev. 25:455-501. [DOI] [PubMed] [Google Scholar]
- 45.Vonshak, A., R. Guy, and M. Guy. 1988. The response of the filamentous cyanobacterium Spirulina platensis to salt stress. Arch. Microbiol. 150:417-420. [Google Scholar]
- 46.Zhang, X., X. Zhang, Y. Shiraiwa, Y. Mao, Z. Sui, and J. Liu. 2005. Cloning and characterization of hoxH genes from Arthrospira and Spirulina and application in phylogenetic study. Mar. Biotechnol. 7:287-296. [DOI] [PubMed] [Google Scholar]
- 47.Zorin, N. A. 1986. Redox properties and active-center of phototrophic bacteria hydrogenases. Biochimie 68:97-101. [DOI] [PubMed] [Google Scholar]
Associated Data
This section collects any data citations, data availability statements, or supplementary materials included in this article.