Abstract
Chemoreceptor arrays are macromolecular complexes that form extended assemblies primarily at the poles of bacterial cells and mediate chemotaxis signal transduction, ultimately controlling cellular motility. We have used cryo-electron tomography to determine the spatial distribution and molecular architecture of signaling molecules that comprise chemoreceptor arrays in wild-type Caulobacter crescentus cells. We demonstrate that chemoreceptors are organized as trimers of receptor dimers, forming partially ordered hexagonally packed arrays of signaling complexes in the cytoplasmic membrane. This novel organization at the threshold between order and disorder suggests how chemoreceptors and associated molecules are arranged in signaling assemblies to respond dynamically in the activation and adaptation steps of bacterial chemotaxis.
Two key multiprotein complexes are essential for mediating bacterial chemotaxis: the chemosensory apparatus, which receives and transmits environmental cues, and the motility system that mediates cellular movement (23). Methyl-accepting chemotaxis proteins (MCPs), or chemoreceptors, form the basis of the signaling apparatus and direct cell movement by regulating the histidine autokinase CheA, which ultimately modulates the direction of flagellum rotation. Chemoreceptors and CheA form a ternary complex with the adaptor protein CheW, which together provide a signaling scaffold that plays a crucial role in signal processing in bacterial chemotaxis (12, 13, 27). In the dimorphic gram-negative Caulobacter crescentus, the chemosensory apparatus and sole flagellum are localized to a single pole of the highly motile swarmer cell type (2, 7), while both complexes are completely absent from nonmotile stalked cells (1, 10, 19).
We previously identified chemoreceptor arrays at the polar region of intact wild-type Escherichia coli and Bdellovibrio bacteriovorus cells by using low-dose cryo-electron microscopy (5, 27). In these organisms, arrays were characterized in an edge-on orientation by striations orthogonal to the cytoplasmic membrane that corresponded to chemoreceptors, and by a line of density near the cell poles, which was designated as the signaling scaffold composed of CheA and CheW. The presence of both chemoreceptors and CheA within the arrays was confirmed by immuno-electron microscopy (27). Here, we extend these studies to another gram-negative bacterium and describe the partially ordered hexagonal arrangement of chemotaxis signaling complexes at the flagellated pole in Caulobacter swarmer cells.
MATERIALS AND METHODS
Bacterial strains and culture conditions.
C. crescentus strain CB15N was cultured in peptone-yeast extract (PYE) medium (0.2% Bacto peptone, 0.1% yeast extract, 0.03% MgSO47H2O, and 0.007% CaCl2·2H2O) (8) at 30°C and 250 rpm.
Specimen preparation, data collection, and image analysis.
Chemoreceptor arrays were observed in over 65 individual Caulobacter swarmer cells that were separated from the stalked cell population by using a modified synchronization protocol. Briefly, a sample of late-log-phase (optical density at 600 nm of less than ∼0.6) Caulobacter culture was divided into aliquots in Eppendorf tubes and centrifuged at 8,000 rpm for ∼1 min. Supernatants were discarded, and the cells were washed twice in M2 salts medium, pelleted, and resuspended in ∼700 μl of fresh M2 medium, and an equal volume of Percoll (Sigma-Aldrich Co., St. Louis, MO) was added. Samples were centrifuged for 20 min at 10,500 rpm, and cells separated into an upper stalked cell band, which was discarded, and a second swarmer cell band that was collected and washed twice in fresh PYE medium to remove residual Percoll prior to sample preparation. From these enriched motile populations, three-dimensional tomographic volumes, or tomograms, were generated for 12 swarmer cells, each exhibiting a single chemoreceptor array and single polar flagellum. Caulobacter cells (5 μl) at an optical density at 600 nm of ∼0.5 nm were withdrawn directly from the PYE medium, mixed with 10- or 15-nm gold particles, and placed on glow-discharged Quantifoil MultiA grids (Micro Tools GmbH, Germany). The grids were blotted and plunge-frozen in liquid ethane maintained at ca. −180°C. For two-dimensional cryo-projection images and cryo-electron tomography, grids containing plunge-frozen cells were placed in cartridges and loaded into the cryo-transfer system of a Polara G2 microscope (FEI Corp., Oregon). The microscope was equipped with a field emission gun operating at 300 kV, and a 2K×2K charge-coupled device camera at the end of a GIF 2000 (Gatan, Inc., California) energy filtering system. Typically, low-dose tomographic tilt series (0.45 to 0.75 e−/Å2 per image) were collected over an angular range of ±70 ° in 1° intervals by using a linear tilt scheme at effective magnifications of ×18,000 (pixel size, 7.5 Å) and underfocus values ranging from 4 to 6 μm. Fiducial marker-based alignments were performed on full-resolution images, and three-dimensional reconstructions computed by weighted back projection of aligned images that were binned 4×4. Alignments and reconstructions were performed using the IMOD (15) software package, both IMOD and the Amira software suite were used for segmentations, and density maps were rendered in Chimera (18).
Alignment of C. crescentus and Escherichia coli C-terminal amino acid sequences.
For each chemoreceptor sequence, the N-terminal amino acid residues that proceeded from the start of the HAMP domain (as determined by domain assignments in the MiST database [22]) were deleted to facilitate the alignment of the C-terminal portions of each chemoreceptor. The remaining cytoplasmic residues from each chemoreceptor sequence were aligned, not only to illustrate the known sequence conservation between chemoreceptors of different species but also to demonstrate that several Caulobacter chemoreceptors contain a significantly increased number of C-terminal residues (see Fig. 2C, MCPs A, C, E, J, and N). Sequences were aligned by using the clustawl alignments in a CLC sequence viewer (CLC bio, Cambridge, MA).
FIG. 2.
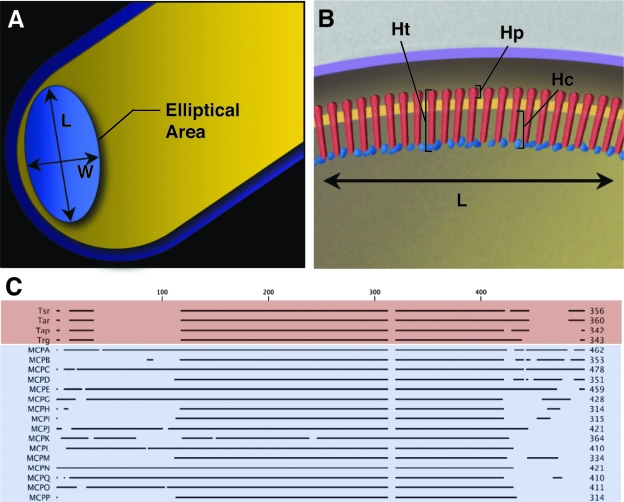
Measurements of chemoreceptor arrays from Caulobacter cells. Chemoreceptor arrays were manually segmented from tomographic volumes of the polar regions of intact frozen-hydrated Caulobacter cells by using the Amira visualization software suite, and array dimensions were measured. (A) Schematic representation of the polar region of a Caulobacter cell demonstrating measurements of array length, width, and elliptical area (area = L/2 × W/2 × π). (B) Schematic representation of a chemosensory array with chemoreceptors indicated in red and signaling molecules indicated in blue. The schematic shows the dimensions of the total array height (Ht), the periplasmic array height (Hp), and the cytoplasmic array height (Hc) that were measured from two-dimensional projection images and three-dimensional tomograms. (C) Sequence comparison of the cytoplasmic amino acids residues of chemoreceptors from E. coli (red) and Caulobacter (blue).
Tomographic averaging.
Although the packing arrangements of molecules corresponding to the scaffolding portion of the chemoreceptor array were prominently observed directly from tomographic slices, densities corresponding to chemoreceptors were less well ordered. Thus, to further probe the molecular architecture of Caulobacter chemoreceptor arrays, we combined three-dimensional alignment procedures similar to those used in single particle analysis with image averaging methods comparable to those used in two-dimensional electron crystallography. From the tomographic volumes described above, 1,200 subvolumes (50 × 50 × 150 in pixels; 7.5 Å/pixel) were extracted from the ordered regions of the Caulobacter tomograms to create a stack of subvolumes. The subvolumes were classified by using the local-maximum clustering method (25), and the major clusters were averaged to create an initial template for further alignment and averaging. The subvolumes were aligned against the initial template by using the grid-threading Monte Carlo searching algorithm (26). The aligned subvolumes were then averaged with a weight factor depending on the correlation coefficient between a subvolume and the template:
 |
Here, w(i) is the weight of subvolume i, and Ci is the correlation between it and the template. C and δC are the average and the standard deviation of correlation coefficients of all subvolumes, respectively. a and b are two parameters that define the dependence of the weight on the correlation coefficient distribution. In the present study we used a = 2 and b = 0. This weighted average enhanced the contribution of “like” images while reducing the contribution of “nonlike” images. Using the averaged volumes as templates, further alignment and weighted averaging were performed until no significant change was observed in the alignments and average results. The atomic models of trimeric E. coli chemoreceptors was adapted from dimeric receptor models (14, 24) and were manually placed into the density map and locally fit using the Chimera (18) software package.
RESULTS AND DISCUSSION
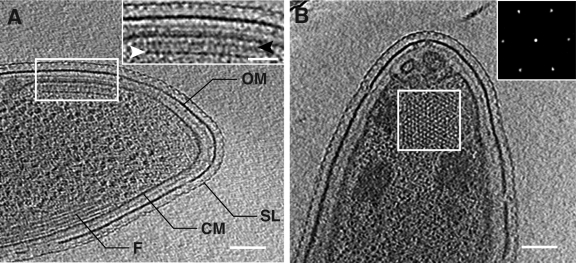
Receptor arrays were observed at the flagellated pole in both edge-on (Fig. 1A) and face-on (Fig. 1B) orientations (also see the movies in the supplemental material). Measurements from tomographic volumes of Caulobacter cells (see Fig. 2A and B for nomenclature) revealed that chemoreceptor arrays were generally circular or elliptical in shape, with mean dimensions of 170.5 ± 25.2 nm in length, along the longitudinal axis of the cell, and 96.0 ± 28.8 nm wide, corresponding to an average elliptical area of 13,087.2 ± 4,618.8 nm2 (n = 12). The relative consistency of Caulobacter array size is in marked contrast to the larger variability we have observed in E. coli (27). In all cells examined, arrays were positioned on the convex side of the cell pole, and the spatial relationship between the chemoreceptor array and the single polar flagellum, as measured from the flagellum rotors to the approximate center of the chemoreceptor arrays, was relatively constant, with a mean distance of 290.8 ± 36.5 nm. The overall height of the arrays measured from the chemoreceptor density observed in the periplasm to the cytoplasmic edge of the signaling scaffold was 46.7 ± 0.9 nm, suggesting that chemoreceptors in Caulobacter are longer than those in E. coli (24). This increase is consistent with sequence comparisons of chemoreceptors from both organisms, which indicate that a significant proportion of Caulobacter chemoreceptors contain an increased number of amino acid residues in their C-terminal region than those found in E. coli (Fig. 2C). Arrays imaged in the edge-on orientation also displayed a second layer of density ca. 8 to 10 nm below the cytoplasmic membrane (Fig. 1A, inset), which roughly corresponds to the predicted interaction sites for CheR and CheB, enzymes involved in regulating chemoreceptor methylation (12).
FIG. 1.
Direct visualization of Caulobacter chemoreceptor arrays. (A) Tomographic slice (∼5 nm) generated from the polar region of an intact Caulobacter swarmer cell demonstrating a continuous surface layer (SL), outer membrane (OM), cytoplasmic membrane (CM), and cytoplasmic filaments (F). (Inset) An expanded view of the array in an edge-on orientation highlighting the chemoreceptors and signaling scaffold (white arrowhead) and additional cytoplasmic density below the cytoplasmic membrane at the proposed CheR/B interaction sites (black arrowhead). (B) In the face-on orientation, chemoreceptor arrays are characterized by a distinct, partially ordered pattern ∼32 nm below the cytoplasmic membrane that corresponds to the signaling scaffold. (Inset) The power spectrum of this region clearly demonstrates the ∼12-nm hexagonal spacing. The scale bars in panels A and B are 100 nm; the panel A inset scale bar is 50 nm.
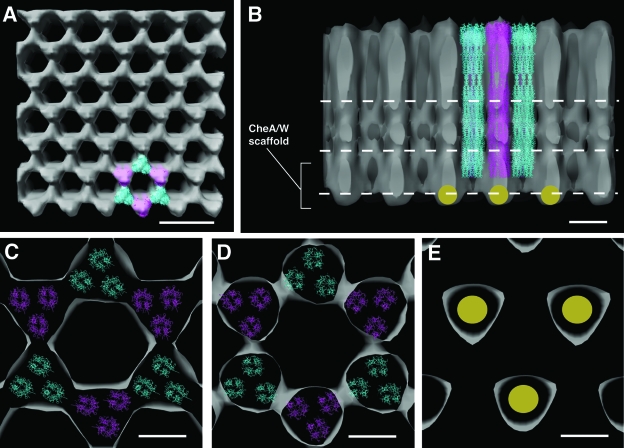
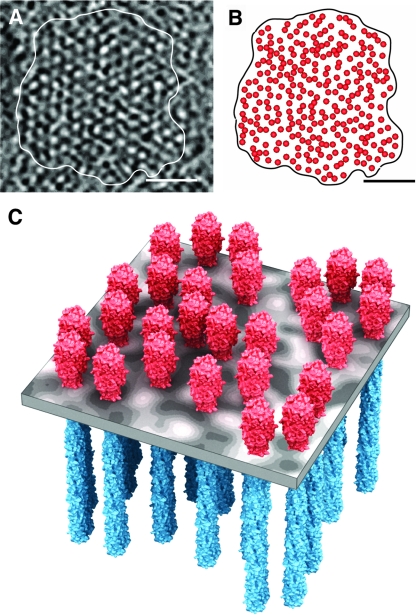
When imaged in the face-on orientation, Caulobacter chemoreceptor arrays displayed an approximately hexagonal packing arrangement within the elliptical boundaries of the array (Fig. 1B), with an apparent periodicity of ∼12 nm (Fig. 1B, inset). Using the densities at the vertex of each lattice point, we carried out three-dimensional averaging from this single cell tomogram to determine the structure of the repeating signaling unit and the general architecture of the Caulobacter chemoreceptor array. The averaged density of the idealized hexagonal packing allowed visualization of the density contributions of individual repeating units in top and vertical sectional views (Fig. 3A and B). A trimer of receptor dimers was modeled easily into each repeating unit (see Materials and Methods). In this packing arrangement, six chemoreceptor trimers (representing 18 individual dimers) were arranged ∼7.5 nm apart and, based on this organization, we estimate that an average Caulobacter chemoreceptor array would contain ∼490 trimers, or ∼1470 chemoreceptor homodimers, fewer than the estimated number of receptors in an average E. coli cell (12, 16, 27). Cross-sectional slices at different heights in the density map (as indicated in Fig. 3B) indicate that interactions may occur between sets of trimers at different points along the cytoplasmic region of the chemoreceptors (Fig. 3C and D), suggesting that interactions at the trimer-trimer interface may also be involved in the formation of the hexagonal units. Interestingly, a cross-sectional view at a height corresponding to the cytoplasmic end of the chemoreceptor array (Fig. 3E) demonstrated additional density at every alternate lattice point, corresponding to the likely position of the scaffold of signaling molecules (CheA and CheW) associated with the receptors. The density map is not at a resolution sufficient to determine the orientation or stoichiometery of these signaling molecules, and therefore this density is shown schematically (Fig. 3B and E, gold circles). Based on a molecular interpretation where the extra density was assigned to signaling molecules, the architecture of the hexagonal chemoreceptor array unit resulted in an average of three CheA dimers for six “trimers-of-dimers” for a perfect and fully occupied lattice. This is different from the biochemically determined stoichiometries for the E. coli chemotaxis receptor assembly, where one receptor trimer-of-dimers is thought to interact with one CheA dimer and two CheW molecules (16). We speculate that one possible reason for this difference may be that different numbers of signaling proteins may be involved in array formation; the Caulobacter genome codes for 18 MCPs, 2 CheAs and 3 CheWs, versus the 4 MCPs and single copies of CheA and CheW in E. coli. Our findings also strongly support the growing numbers of in vivo (3, 20, 21) and in vitro (4) experiments, which suggest that trimers of chemoreceptor dimers, along with CheA and CheW, form a core signaling unit. Although symmetrization and averaging of the density map allowed for the determination of the overall packing of the chemoreceptor array, a closer inspection of the raw density map revealed the local disorder in array packing (Fig. 4A). Specifically, the density maps corresponding to hexagonal units were observed to be discontinuous, occasionally missing vertices and variable intertrimer spacing (Fig. 4B). Thus, our studies demonstrate that within the context of an approximate hexagonal lattice, chemoreceptors display local disorder.
FIG. 3.
Averaged packing arrangement of trimeric receptors in Caulobacter chemoreceptor arrays. (A) Averaged density map of a chemoreceptor array demonstrating idealized hexagonal packing, with trimeric chemoreceptors model structures (cyan and magenta) docked into a single hexagonal unit. (B) Edge-on perspective of the array showing one-half of the hexagonal unit described in panel A, with continuous receptor densities emanating from the signaling scaffold. The gold circles represent the extra density attributed to molecules within the signaling scaffold and have been placed surrounding the single hexagonal unit in which chemoreceptor trimer models have been docked. The three white dashed lines represent the heights at which cross-sectional cuts were made in the density map to obtain panels C through E, from top to bottom, respectively. (C and D) Cross-sectional views through the array at the receptor level demonstrate the trimer-of-dimer organization of chemoreceptors and suggest multiple interactions between adjacent trimers. (E) Cross-sectional view from below the level of chemoreceptor shows the extra density directly below every other receptor trimer (magenta). The scale bars in panels A and B are 20 and 10 nm, respectively, and the scale bars in panels C to E are 5 nm.
FIG. 4.
Partially ordered organization of chemoreceptor trimers-of-dimers in Caulobacter cells. (A) Tomographic slice (∼2.5 nm) of a subregion of the same chemoreceptor array presented in Fig. 1B. (B) Schematic representation of the in-plane clustering of the signaling scaffold and (C) model derived from a subset of the tomographic data in panels A and B demonstrating the organization of chemoreceptors trimers-of-dimers that combine with signaling molecules to form a quasihexagonal signaling array in the cytoplasmic membrane. The scale bars in panels A and B are 50 nm.
Quantitative models, based primarily on experimental response measurements derived from E. coli cells, describe the high-performance features of bacterial chemotaxis and predict that chemoreceptors form allosteric arrays with as many as several dozen signaling units acting cooperatively via clustered neighborhoods of strongly coupled receptors (9, 11, 12, 17). The model we present here for native Caulobacter chemoreceptor arrays confirms this expectation and demonstrates how chemoreceptors can achieve local clustering while positioned in the context of a partially ordered, hexagonally packed lattice (Fig. 4C). We propose that this disorder allows for a dynamic organization of the array, which potentially accommodates diversity in chemoreceptor scaffold architecture. The loose packing, taken together with the ∼9-nm-wide central openings in the hexagonal unit, may also provide a mechanism for the access of cytoplasmic enzymes such as CheR and CheB that are necessary for chemoreceptor modification.
A recent study by Briegel et al. described the organization of Caulobacter chemoreceptor arrays as an ordered and continuous hexagonal lattice, based on the analysis of tomograms generated from edge-on views and with imposed hexagonal symmetry (6). In contrast, our results from both edge-on and face-on tomograms show that intrinsic disorder exists in the packing of chemoreceptors within the array (Fig. 4), which is averaged out when hexagonal symmetry is enforced (Fig. 3). The lack of continuous order is likely to be critical for chemotaxis signaling, since this type of flexibility may allow chemoreceptor arrays to uniquely adapt to changing chemical environments and might provide a mechanism for the incorporation of newly synthesized array components while maintaining the overall hexagonal packing arrangement. Our tomographic studies thus provide a new understanding of both the general architecture of Caulobacter chemoreceptor arrays and insights into the specific hexagonal units that comprise the array. The essence of the structural organization of this elegant macromolecular sensory apparatus appears to be a lateral organizational scheme that maintains order on a global scale coupled with local variability to facilitate fine-tuning of the chemotaxis response.
Supplementary Material
Acknowledgments
We thank Z. Gitai for kindly providing C. crescentus strain CB15N and helpful advice, E. Sockett for insightful comments, and E. Tyler and A. Hoofring for expert assistance with preparation of the figures.
This study was supported by funds from the intramural program of the National Cancer Institute to S.S.
C.M.K. and S.S. designed the experiments; C.M.K. and X.W. performed the experiments; C.M.K., X.W., and S.S. analyzed the data; and C.M.K. and S.S. wrote the manuscript.
Footnotes
Published ahead of print on 8 August 2008.
Supplemental material for this article may be found at http://jb.asm.org/.
REFERENCES
- 1.Alley, M. R., S. L. Gomes, W. Alexander, and L. Shapiro. 1991. Genetic analysis of a temporally transcribed chemotaxis gene cluster in Caulobacter crescentus. Genetics 129333-341. [DOI] [PMC free article] [PubMed] [Google Scholar]
- 2.Alley, M. R., J. R. Maddock, and L. Shapiro. 1992. Polar localization of a bacterial chemoreceptor. Genes Dev. 6825-836. [DOI] [PubMed] [Google Scholar]
- 3.Ames, P., C. A. Studdert, R. H. Reiser, and J. S. Parkinson. 2002. Collaborative signaling by mixed chemoreceptor teams in Escherichia coli. Proc. Natl. Acad. Sci. USA 997060-7065. [DOI] [PMC free article] [PubMed] [Google Scholar]
- 4.Boldog, T., S. Grimme, M. Li, S. G. Sligar, and G. L. Hazelbauer. 2006. Nanodiscs separate chemoreceptor oligomeric states and reveal their signaling properties. Proc. Natl. Acad. Sci. USA 10311509-11514. [DOI] [PMC free article] [PubMed] [Google Scholar]
- 5.Borgnia, M. J., S. Subramaniam, and J. L. Milne. 2008. Three-dimensional imaging of the highly bent architecture of Bdellovibrio bacteriovorus by using cryo-electron tomography. J. Bacteriol. 1902588-2596. [DOI] [PMC free article] [PubMed] [Google Scholar]
- 6.Briegel, A., H. J. Ding, Z. Li, J. Werner, Z. Gitai, D. P. Dias, R. B. Jensen, and G. J. Jensen. 2008. Location and architecture of the Caulobacter crescentus chemoreceptor array. Mol. Microbiol. 6930-41. [DOI] [PMC free article] [PubMed] [Google Scholar]
- 7.Collier, J., and L. Shapiro. 2007. Spatial complexity and control of a bacterial cell cycle. Curr. Opin. Biotechnol. 18333-340. [DOI] [PMC free article] [PubMed] [Google Scholar]
- 8.Ely, B. 1991. Genetics of Caulobacter crescentus. Methods Enzymol. 204:372-384. [DOI] [PubMed] [Google Scholar]
- 9.Endres, R. G., J. J. Falke, and N. S. Wingreen. 2007. Chemotaxis receptor complexes: from signaling to assembly. PLoS Comput. Biol. 3e150. [DOI] [PMC free article] [PubMed] [Google Scholar]
- 10.Gomes, S. L., and L. Shapiro. 1984. Differential expression and positioning of chemotaxis methylation proteins in Caulobacter. J. Mol. Biol. 178551-568. [DOI] [PubMed] [Google Scholar]
- 11.Hansen, C. H., R. G. Endres, and N. S. Wingreen. 2008. Chemotaxis in Escherichia coli: a molecular model for robust precise adaptation. PLoS Comput. Biol. 4e1. [DOI] [PMC free article] [PubMed] [Google Scholar]
- 12.Hazelbauer, G. L., J. J. Falke, and J. S. Parkinson. 2008. Bacterial chemoreceptors: high-performance signaling in networked arrays. Trends Biochem. Sci. 339-19. [DOI] [PMC free article] [PubMed] [Google Scholar]
- 13.Kentner, D., and V. Sourjik. 2006. Spatial organization of the bacterial chemotaxis system. Curr. Opin. Microbiol. 9619-624. [DOI] [PubMed] [Google Scholar]
- 14.Kim, S. H., W. Wang, and K. K. Kim. 2002. Dynamic and clustering model of bacterial chemotaxis receptors: structural basis for signaling and high sensitivity. Proc. Natl. Acad. Sci. USA 9911611-11615. [DOI] [PMC free article] [PubMed] [Google Scholar]
- 15.Kremer, J. R., D. N. Mastronarde, and J. R. McIntosh. 1996. Computer visualization of three-dimensional image data using IMOD. J. Struct. Biol. 11671-76. [DOI] [PubMed] [Google Scholar]
- 16.Li, M., and G. L. Hazelbauer. 2004. Cellular stoichiometry of the components of the chemotaxis signaling complex. J. Bacteriol. 1863687-3694. [DOI] [PMC free article] [PubMed] [Google Scholar]
- 17.Mello, B. A., and Y. Tu. 2007. Effects of adaptation in maintaining high sensitivity over a wide range of backgrounds for Escherichia coli chemotaxis. Biophys. J. 922329-2337. [DOI] [PMC free article] [PubMed] [Google Scholar]
- 18.Pettersen, E. F., T. D. Goddard, C. C. Huang, G. S. Couch, D. M. Greenblatt, E. C. Meng, and T. E. Ferrin. 2004. UCSF Chimera: a visualization system for exploratory research and analysis. J. Comput. Chem. 251605-1612. [DOI] [PubMed] [Google Scholar]
- 19.Shaw, P., S. L. Gomes, K. Sweeney, B. Ely, and L. Shapiro. 1983. Methylation involved in chemotaxis is regulated during Caulobacter differentiation. Proc. Natl. Acad. Sci. USA 805261-5265. [PMC free article] [PubMed] [Google Scholar]
- 20.Studdert, C. A., and J. S. Parkinson. 2007. In vivo crosslinking methods for analyzing the assembly and architecture of chemoreceptor arrays. Methods Enzymol. 423414-431. [DOI] [PubMed] [Google Scholar]
- 21.Studdert, C. A., and J. S. Parkinson. 2005. Insights into the organization and dynamics of bacterial chemoreceptor clusters through in vivo cross-linking studies. Proc. Natl. Acad. Sci. USA 10215623-15628. [DOI] [PMC free article] [PubMed] [Google Scholar]
- 22.Ulrich, L. E., and I. B. Zhulin. 2007. MiST: a microbial signal transduction database. Nucleic Acids Res. 35D386-D390. [DOI] [PMC free article] [PubMed] [Google Scholar]
- 23.Wadhams, G. H., and J. P. Armitage. 2004. Making sense of it all: bacterial chemotaxis. Nat. Rev. Mol. Cell. Biol. 51024-1037. [DOI] [PubMed] [Google Scholar]
- 24.Weis, R. M., T. Hirai, A. Chalah, M. Kessel, P. J. Peters, and S. Subramaniam. 2003. Electron microscopic analysis of membrane assemblies formed by the bacterial chemotaxis receptor Tsr. J. Bacteriol. 1853636-3643. [DOI] [PMC free article] [PubMed] [Google Scholar]
- 25.Wu, X., Y. Chen, B. R. Brooks, and Y. A. Su. 2004. The local maximum clustering method and its application in microarray gene expression data analysis. EURASIP J. Appl. Signal Processing 200453-63. [Google Scholar]
- 26.Wu, X., J. L. Milne, M. J. Borgnia, A. V. Rostapshov, S. Subramaniam, and B. R. Brooks. 2003. A core-weighted fitting method for docking atomic structures into low-resolution maps: application to cryo-electron microscopy. J. Struct. Biol. 14163-76. [DOI] [PMC free article] [PubMed] [Google Scholar]
- 27.Zhang, P., C. M. Khursigara, L. M. Hartnell, and S. Subramaniam. 2007. Direct visualization of Escherichia coli chemotaxis receptor arrays using cryo-electron microscopy. Proc. Natl. Acad. Sci. USA 1043777-3781. [DOI] [PMC free article] [PubMed] [Google Scholar]
Associated Data
This section collects any data citations, data availability statements, or supplementary materials included in this article.


