

Abstract
Background
The transmission potential of primary pneumonic plague, caused by Yersinia pestis, is one of the key epidemiological determinants of a potential biological weapon, and requires clarification and time dependent interpretation.
Method
This study estimated the reproduction number and its time dependent change through investigations of outbreaks in Mukden, China (1946), and Madagascar (1957). Reconstruction of an epidemic tree, which shows who infected whom, from the observed dates of onset was performed using the serial interval. Furthermore, a likelihood based approach was used for the time inhomogeneous evaluation of the outbreaks for which there was scarcity of cases.
Results
According to the estimates, the basic reproduction number, R0, was on the order of 2.8 to 3.5, which is higher than previous estimates. The lower 95% confidence intervals of R0 exceeded unity. The effective reproduction number declined below unity after control measures were introduced in Mukden, and before the official implementation in Madagascar.
Conclusion
While the time course of the latter outbreak could be explained by intrinsic factors and stochasticity in this remote and scarcely populated area, the former in Mukden suggests the possible continued chains of transmission in highly populated areas. Using the proposed methods, the who infected whom information permitted the evaluation of the time inhomogeneous transmission potential in relation to public health measures. The study also tackles the problem of statistical estimation of R0 based on similar information, which was previously performed simply by counting the number of secondary transmissions regardless of time.
Keywords: Yersinia pestis , maximum likelihood estimates, outbreaks, pneumonic plague, statistical distribution
Plague has one of the earliest histories of use as a biological weapon; the Japanese army attempted to drop plague infected fleas over populated areas during the second world war,1,2 and scientists in the former Soviet Union were incriminated of creating an aerosolised form during the cold war era and manufacturing large quantities of allegedly engineered multidrug resistant strains.3,4 Although primary pneumonic plague (PPP) is highly fatal and its aetiological agent, Yersinia pestis, is easily accessible,5 epidemiological studies and investigations of intervention strategies are rather limited compared with smallpox. Besides zoonotic infection, which is mainly maintained by wild rodents and fleas as the natural cycle of transmission, intentional release of aerosolised Y pestis resulting in person to person transmission is the most plausible bioterrorism threat.3 The proportion of PPP associated case fatalities can reach almost 100% without appropriate antibiotic treatment within 24 hours after onset of illness.6 Despite the recent decline in the annual incidence,7 sporadic outbreaks such as the one recently seen in the Democratic Republic of Congo are still a threat.8 Human susceptibility to plague is thought to be universal and the effectiveness of existing vaccines has not been proved.9 Thus, given the availability of the pathogen, the actual history of its use as a biological weapon, and its potential for huge disasters, epidemiological investigation of PPP is of outstanding importance for response planning of effective control measures.
The most important epidemiological measure of infectious diseases, the basic reproduction number, R0, is defined as the average number of secondary cases arising from the introduction of a single primary case into an otherwise fully susceptible population, and thereby summarises the transmission potential.10,11 Explanation of the time course of an epidemic requires further clarifications that can be achieved by estimating effective reproduction number, R(t), defined as the actual average number of secondary cases per primary case at time t (for t>0)10,11,12,13 and is typically <R0. Precise estimates of R(t) are of importance for outbreak evaluation and management; R(t) shows time dependent variation with the decline in susceptible people (intrinsic factors) and with the implementation of control measures (extrinsic factors). It is possible to estimate R(t) directly by closely monitoring the network of transmission; that is, by determining who infected whom.12 Moreover, a recently proposed method using serial intervals, the time intervals between infection of one person and infection of others by this person (or the time from symptom onset in an index case to symptom onset in secondary cases), permits reasonable estimates of R(t) when such information is unavailable, but where an independent source of infection is assumed.12,14 The notations “generation time” or “generation interval” have also been used to suggest serial intervals in other studies.12,13 However, the estimation procedures of R0 and R(t) from outbreaks where the network of transmission is only partly known are yet to be developed. This is of practical importance as we usually have only partial information on who infected whom. The purpose of this study is to estimate R0 and R(t), based on fully or partly known transmission network (who infected whom). We use serial intervals to reconstruct epidemic trees and propose an evaluation method based on the transmission network, tackling previous technical problems in interpreting the transmission potential.
Methods
Description of the outbreaks
In this paper, we evaluate historical records of PPP outbreaks in Madagascar in 195715 and Mukden (presently Shenyang), China, in 1946,16 respectively, to estimate R(t) and to interpret the time course of a PPP outbreak. These two outbreaks were selected for investigation because (1) the total number of cases was the largest among the previously reported outbreaks of PPP, (2) the networks of transmission were at least partly known, and (3) the time of starting control measures was well reported. Each outbreak began with introduction of one index case who incubated the disease during a trip from an infected to an uninfected area.15,16 A total of 41 and 43 cases diagnosed as having PPP or harbouring Y pestis in their throats appeared over periods of 33 and 34 days in Madagascar and Mukden, respectively. The two historical outbreaks differ by the underlying population density, the transmission network and by the time of introducing control measures. The dates of onset were closely monitored for all known cases in both outbreaks. Control measures were instituted on the 32nd and 12th day after onset of the index case in Madagascar and Mukden, respectively. Control measures mainly included contact tracing, quarantine, and isolation, in addition to precautionary measures (for example, wearing masks), chemoprophylaxis with sulfadiazine, and specific control measures against bubonic plague (vaccination, rodent traps, and so on).
In Madagascar, all data of who infected whom were obtained (fig 1A); however, in Mukden the source of infection of nine persons was unknown or limited (fig 1B). At the time of the outbreak, Mukden had just been released from occupation of Manchukuo by the Japanese Empire, and politically was under the control of the Russian military residing with Chinese nationals as well as demilitarised Japanese nationals.17 In Mukden, the chains of transmission were seen in different households and political areas, and thus all cases with unknown source of infection have supplied us with suspected candidates for the source and place of infection. Four persons infected with Y pestis after introduction of chemoprophylaxis were included with the date of bacteriological confirmation; these dates of onset were excluded when estimating the serial interval.

Figure 1 Courses of outbreaks of primary pneumonic plague in (A) Madagascar (1957) and (B) Mukden, China (1946) (restructured by the authors). Dates of onset are represented by squares on a daily time scale. Outlined squares with a question mark represent the nine persons in Mukden for whom information on the source of infection was unknown or limited. The four persons reported in Mukden on the 33rd and 34th day were bacteriologically confirmed, but remained asymptomatic. Vertical dashed lines in both outbreaks denote the time when control measures started. Data above the horizontal dotted line in Mukden denote infections within areas inhabited by Japanese nationals. Separate households or buildings in Mukden are grouped in boxes.
Statistical distribution of the serial interval
The serial interval was used to reconstruct the epidemic tree in Mukden. Because of limited numbers of known transmission network, the statistical distribution of the interval was obtained by combining data from both outbreaks. For the same reason, time dependent variation in the serial interval18 was ignored. The data were fitted to a gamma distribution by using a maximum likelihood estimation method. The gamma distribution is denoted by f(t|α,β) where α and 1/β are the shape and scale parameters, respectively. A quantile plot was drawn to visually assess the validity of fitting the distribution to the observed data; through the use of the quantile, a division of a distribution into equal ordered subgroups, gamma quantile plots allow us to evaluate the fit of the gamma distribution to the observed data.
Reconstruction of epidemic tree in Mukden
When the source of infection was known from contact tracing, the given source of infection was always assumed as the primary case. Otherwise, three different algorithms were used to reconstruct the epidemic tree in Mukden, extending previous methods.12 As the probable sources or places of infection were given even among unknown transmission networks, we performed resampling experiments of the primary cases, selecting them from possible lists of candidates or from those in probable areas or households. The following experiments were performed: (1) using the serial interval, the most probable primary case was selected deterministically based on the probability for the actual interval from onset to onset (this is termed the highest probability algorithm throughout this paper); (2) assuming a primary case, j, sampled from a candidate list, independently infected a secondary case, i, the probability of transmission was directly extracted from the probability density function of the serial interval (for details, see appendix 1; this is termed the serial interval based algorithm throughout this paper); and (3) primary cases were sampled from the candidate lists with equal probability (the equal probability algorithm). As the second and third methods choose the sources of infection randomly from the candidate lists, 100 epidemic trees were reconstructed using the bootstrap method.19
A likelihood based approach for the estimation of R(t)
Using the theoretical transmission networks of the two outbreaks, numbers of secondary transmissions per case per day could be counted directly. However, as it is hard to interpret R(t) when data are scarce and the time scale is in the order of days, we analyse the generalised time dependent transmission potential by using a likelihood based approach. Choosing the simplest pattern of the decline in R(t), we assumed the exponential loss over time (the outbreak dies out over time, or self limiting). The variability of the number of secondary cases was assumed to follow a geometric distribution. Details for the maximum likelihood methods are given in appendix 2.
Results
The serial interval distribution was obtained based on all known sources of infection from both outbreaks (n = 72; fig 2A). The distribution showed a mean and standard deviation of 5.1 and 2.3 days, and skewness and kurtosis were 2.3 and 11.2, respectively. The maximum likelihood estimates for the shape and scale parameters of the gamma distribution were 5.4 and 0.9, respectively. A quantile plot, the vertical axis of which is represented by gamma quantiles, is shown in fig 2B. Most of the data points and the quantiles for the hypothesised gamma distribution were relatively close. Only one case of 72 lies out of the 95% confidence limits.

Figure 2 Distribution of the combined serial intervals of known transmissions of primary pneumonic plague in Madagascar (1957; n = 40) and Mukden (1946; n = 32). (A) Observed distribution and fitted gamma distribution, and (B) gamma quantile plot of the serial intervals. The diagonal reference line shows the line of fit and the two dashed lines denote confidence limits of 95% equal precision bounds with a = 0.001 and b = 0.99 (see Meeker and Escobar38).
Time dependent numbers of secondary transmissions per case from the known network in Madagascar and the reconstructed network in Mukden, determined with the highest probability algorithm, are given in figure 3A and B. Although these show some individual variations, the numbers of secondary transmissions decreased over time. Figure 3C and D show the time course of R(t). In both outbreaks, the expected values declined below unity (where R(t)<1 denotes the eventual termination of the epidemic) at between 15 and 20 days after the introduction of the index case. In Madagascar, R(t) lowered unity before the introduction of control measures. The upper 95% confidence limit (CI) exceeded one during the entire time period of both outbreaks.

Figure 3 The number of secondary transmissions per case according to the date of onset in (A) Madagascar (1957) and (B) Mukden (1946). The plotted dots in (B) were obtained using the highest probability algorithm. (C) and (D) show the estimated effective reproduction numbers, R(t), with corresponding upper 95% confidence intervals (CI) in Madagascar and Mukden, respectively. The horizontal dotted lines show R(t) = 1 and the vertical dashed lines show the time when control measures were started.
Table 1 shows the obtained estimates of key parameters for both outbreaks. The maximum likelihood estimate of R0 was 2.99 (95% CI: 1.11, 8.77) in Madagascar. In Mukden, the estimated R0 was 2.80 (1.15, 7.40), 2.96 (1.21, 7.90), and 3.45 (1.36, 9.70) obtained with the highest probability, serial interval based and equal probability algorithm, respectively. The χ2 goodness of fit test with 4 degrees of freedom showed no significant deviations between observed and expected values in all settings (see table 1). In Mukden, the serial interval based algorithm gave the best fit among the three different reconstruction methods (χ2 = 1.53, p = 0.82).
Table 1 Parameter estimates with 95% confidence intervals (based on the profile likelihood) for two outbreaks of primary pneumonic plague in Madagascar (1957) and Mukden (1946), respectively†.
| Estimate | 95% confidence interval | ||
|---|---|---|---|
| Madagascar (1957) | R0* | 2.99 | 1.11, 8.77 |
| δ‡ | 0.0615 | 0.0127, 0.1140 | |
| Mukden (1946) | |||
| The highest probability algorithm | R0 | 2.80 | 1.15, 7.40 |
| δ | 0.0767 | 0.0198, 0.1411 | |
| The serial interval based algorithm | R0 | 2.96 | 1.21, 7.90 |
| δ | 0.0812 | 0.0234, 0.1471 | |
| The equal probability algorithm | R0 | 3.45 | 1.36, 9.70 |
| δ | 0.0950 | 0.0335, 0.1667 |
†The χ2 goodness of fit test statistics with 4 degrees of freedom (0 to 4 and more than 4 secondary transmissions) were 1.39 (p = 0.85) in Madagascar, and 7.14 (p = 0.13), 1.53 (p = 0.82), and 1.90 (p = 0.75) in Mukden according to the highest probability, the serial interval based and the equal probability algorithm, respectively. The numbers of more than four secondary transmissions were combined to meet Cochran's rule37 because of expected frequencies of less than 1.0. *The basic reproduction number. ‡Decline of the reproduction number (per day).
Discussion
As most pneumonic plague outbreaks were accompanied by difficulties in interpreting the infectivity (because they occurred in rural areas),20,21 there have been confusions as well as extensive discussions concerning the transmissibility of PPP.22,23,24,25,26 It has been suggested that close contacts play a central part in PPP outbreaks20,21,27; the size of an epidemic is also suggested to increase in highly populated areas based on experimental studies.22,23 This study proposed a method for the time inhomogeneous evaluation of the transmission potential based on who infected whom information. The distribution of the serial interval was conveniently applied to the reconstruction of epidemic trees. In the outbreak in Mukden, where there was a limited number of cases and the transmission network was only partly known, the proposed method made it possible to interpret the time course of R(t) without unrealistic assumptions. R(t) was shown approximately to experience a constant exponential decay, and its expected value decreased below unity during the mid‐term of both outbreaks studied. The pattern of decay of R(t) was almost identical in both outbreaks. The value of R(t) reached unity before control measures were started in Madagascar, showing the contribution of intrinsic factors and stochastic effects. In Mukden, the outbreak continued even after the implementation of control measures and R(t) remained above one for a short period; the high population density in this area, which could have increased the chance of exposure, may have contributed to this finding. Thus, our findings enabled us to relate the transmission potential to public health measures. The method of estimating R(t) based on direct calculations from constructed epidemic trees are not our original idea. It was firstly proposed for application with foot and mouth disease.12 We extended the reconstruction of epidemic trees applying the recently proposed idea of using serial intervals,13 and obtained the maximum likelihood estimates of R0 and time dependent loss rate of R(t). Although the sample size for the estimation of the serial interval was small (and maximum likelihood estimates are sometimes biased for small samples), and despite the presence of an outlier (fig 2A) that may show rare infection from a dead body, the distribution of serial intervals was sufficiently characterised, enabling us to use it for sampling the source of infection from a limited number of candidates.
What this paper adds
The serial interval can reasonably be used to estimate the effective reproduction number even when the network of transmission (who infected whom) is only partly known.
Transmission network helps time inhomogeneous evaluations.
In a recent study by Gani and Leach that investigated eight historical PPP records, R0 of 1.3 (variance = 3.1) was estimated, taking into account only the skewness of the distribution.28 Whereas they obtained estimates of R0 by simply counting the number of secondary transmissions regardless of time, our method enabled the time inhomogeneous evaluations and detailed the epidemic trees that were reconstructed using the serial interval. Through the adjustments in our method, the obtained expected values of R0 were on the order of 2.8 to 3.5, which is higher than the previous estimates.28 Moreover, the lower 95% confidence limits of R0 exceeded unity. The difference between our findings and those of Gani and Leach28 originates from the definition of R0. We obtained estimates of R0 at the time of introduction of a single primary case into a fully susceptible population.10,11 Although the theoretical concepts of the definition of R0 have been extensively discussed,11,30,31 its definition in real field settings has remained vague. Regardless of the implementation of public health measures, the reproduction number frequently declines because of several factors, including behavioural changes related to rising awareness within the community.29 As ignorance of the time dependency and concomitant changes of public health measures must result in an underestimation of R0, we have proposed our methods for the estimation of R0. Thus, it should be noted that mathematical models based on autonomous system, including branching process models,32,33 with fixed R0 over time, could have underestimated the transmission potentials. Although further clarification is required to derive more appropriate estimates, we suggest the above proposed methods for interpretation and estimation of R0 in the outbreaks such as what we investigated (the outbreak that went into extinction without further exponential growth after the establishment),34 so that one would not underestimate the transmission potential.
Although the constant exponential loss of the reproduction number was shown to fit the data well, it has to be noted that other qualitative patterns such as single hump or complex declines are also possible (but indistinguishable because of scarcity of data and the inherent stochasticity in the outbreaks investigated). Considering the qualitative distribution of R(t) obtained from outbreaks of severe acute respiratory syndrome, estimates have shown single hump and several humps decay.13 As the implicit assumption and discussions on the estimate of R0 given above can only be clarified by studies using similar methods on larger outbreaks, and as our assumptions might potentially overestimate R0, the validity of the above assumptions needs to be clarified further. In this context, assumptions on contact tracing using the epidemic model might also help interpret the time course if we had more information.35,36
Policy implications
Partly known transmission networks can be used to evaluate the time inhomogeneous transmissions in relation to public health measures.
Estimated reproduction numbers of pneumonic plague at the initial stage of outbreaks are higher than previously suggested, showing its potential for serious disasters in the event of a bioterrorist attack.
In conclusion, we showed that information regarding who infected whom enables us to estimate and interpret the time inhomogeneous transmission potential. R(t) declined below unity before implementation of control measures in Madagascar, a comparatively remote and scarcely populated area. On the other hand, R(t) continued to be above one in Mukden, a highly populated area, where PPP is thought to have spread comparatively easily, implying the potential disaster of PPP outbreaks with the large initial attack size in such densely populated regions. Our methods also tackled the problem of statistical estimation for R0.
Acknowledgements
We thank Klaus Dietz for helpful discussions.
Appendix 1
In the serial interval based algorithm, we assumed independence of all possible transmissions from the candidate list. Thus, among j{1,..., n} candidates, the probability of individual i being infected by case k, denoted by pik, is given by:
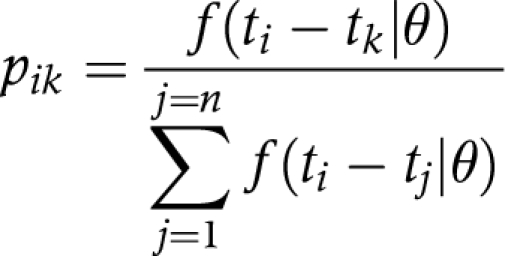 |
where ti denotes the date of onset of case i and where f(ti−tj|θ) is the gamma probability density of the serial interval with the population parameter θ, evaluated at the actual time interval ti−tj (time between the onset of case i and case j).
Appendix 2
The effective reproduction number, R(t), which is empirically assumed to be lost exponentially with time (that is, the outbreak dies out over time, or is self limiting), is given by:
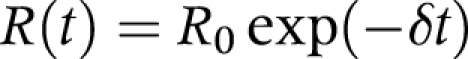 |
where δ determines the rate of decline. As seen in a recent study,10 the distribution of R0 of PPP is skewed to the right with a variance to mean ratio of 0.42. Therefore, we assumed a geometric distribution for R(t). Thus, the total likelihood, L, of all observations, n, is given by:
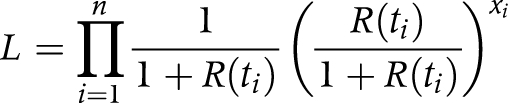 |
where xi is the observed number of secondary transmissions of case i whose date of onset is time ti. Maximum likelihood estimates of R0 and δ were obtained by minimising the negative logarithm of the likelihood. Ninety five per cent confidence intervals (CI) were derived from the profile likelihood.
Footnotes
Funding: HN thanks the Japanese Foundation for AIDS Prevention and the Banyu Life Science Foundation International (Banyu Fellowship Programme) for supporting this study in the UK and Germany. This study was also in part supported by DG Sanco Project MODELREL and by the German Ministry of Health and Social Security.
Conflicts of interest: none.
References
- 1.Williams P, Wallace D.Unit 731: Japan's secret biological warfare in world war II. New York: The Free Press, 1989
- 2.Harris S H.Factories of death. New York: Routledge, 1994
- 3.Inglesby T V, Dennis D T, Henderson D A.et al Plague as a biological weapon: Medical and public health management. Working Group on Civilian Biodefense. JAMA 20002832281–2290. [DOI] [PubMed] [Google Scholar]
- 4.Alibek K, Handelman S.Biohazard. New York: Random House, 1999
- 5.McGovern T W, Friedlander A M. Plague. In: Siedell FR, Takafuji ET, Franz DR, et al, eds. Medical aspects of chemical and biological warfare. Washington, DC: Walter Reed Army Medical Center, 1997479–502.
- 6.Wu L ‐ T.A treatise on pneumonic plague. Geneva, Switzerland: League of Nations Health Organisation, 1926241–430.
- 7.World Health Organisation Human plague in 2002 and 2003. Wkly Epidemiol Rec 200479301–306. [PubMed] [Google Scholar]
- 8.World Health Organisation Plague, Democratic Republic of the Congo. Wkly Epidemiol Rec 20058065. [PubMed] [Google Scholar]
- 9. Titball RW, Williamson , eds. Vaccination against bubonic and pneumonic plague. Vaccine 2001194175–4184. [DOI] [PubMed] [Google Scholar]
- 10.Bailey N T.The mathematical theory of infectious diseases and its applications. 2nd ed. London: Griffin, 1975
- 11.Anderson R M, May R M.Infectious diseases of humans: dynamics and control. New York: Oxford University Press, 1991
- 12.Haydon D T, Chase‐Topping M, Shaw D J.et al The construction and analysis of epidemic trees with reference to the 2001 UK foot‐and‐mouth outbreak. Proc R Soc Lond B 2003270121–127. [DOI] [PMC free article] [PubMed] [Google Scholar]
- 13.Wallinga J, Teunis P. Different epidemic curves for severe acute respiratory syndrome reveal similar impacts of control measures. Am J Epidemiol 2004160509–516. [DOI] [PMC free article] [PubMed] [Google Scholar]
- 14.Fine P E. The interval between successive cases of an infectious disease. Am J Epidemiol 20031581039–1047. [DOI] [PubMed] [Google Scholar]
- 15.Brygoo E R, Gonon M. Une epidemie de peste pulmonaire dans le nord‐est de Madagascar. Bull Soc Pathol Exot Filiales 19585147–60. [PubMed] [Google Scholar]
- 16.Tieh T H, Landauer E, Miyagawa F.et al Primary pneumonic plague in Mukden, 1946, and report of 39 cases with 3 recoveries. J Infect Dis 19478252–58. [DOI] [PubMed] [Google Scholar]
- 17.Glantz D M.Leavenworth papers no 7. August storm: the Soviet 1945 Strategic offensive in Manchuria. Kansas: Combat Studies Institute, US Army Command and General Staff College, 1983
- 18.Lipsitch M, Cohen T, Cooper B.et al Transmission dynamics and control of severe acute respiratory syndrome. Science 20033001966–1970. [DOI] [PMC free article] [PubMed] [Google Scholar]
- 19.Efron B, Tibshirani R J.An Introduction to the bootstrap. New York: Chapman and Hall, 1994
- 20.Pollitzer R, Li C C. Some observations on the decline of pneumonic plague epidemics. J Infect Dis 194372160–162. [Google Scholar]
- 21.Wynne‐Griffith G. Pneumonic plague in Rangoon. Lancet 1948i625–627. [DOI] [PubMed]
- 22.Pollitzer R.Plague. Geneva, Switzerland: World Health Organisation, 1954
- 23.Meyer K F. Pneumonic plague. Bacteriol Rev 196125249–261. [DOI] [PMC free article] [PubMed] [Google Scholar]
- 24.Levison M E. Lessons learned from history on mode of transmission for control of pneumonic plague. Curr Infect Dis Rep 20002269–271. [DOI] [PubMed] [Google Scholar]
- 25.Wright F J. Infectivity of pneumonic plague. BMJ 1995310261. [DOI] [PMC free article] [PubMed] [Google Scholar]
- 26.Strong R P, Teague O. Studies on pneumonic plague and plague immunization. VI. Bacteriology. Philippine J Sci 19127187–202. [Google Scholar]
- 27.International Plague Conference, Mukden, Manchuria Report of the international plague donference (held in April 1911). Manila, Philippines: Bureau of Printing, 1912
- 28.Gani R, Leach S. Epidemiologic determinants for modeling pneumonic plague outbreaks. Emerg Infect Dis 200410608–614. [DOI] [PMC free article] [PubMed] [Google Scholar]
- 29.Abbey H. An examination of the Reed‐Frost theory of epidemics. Hum Biol 195224201–233. [PubMed] [Google Scholar]
- 30.Diekmann O, Heesterbeek J A P, Metz J A. On the definition and the computation of the basic reproduction ratio R0 in models for infectious diseases in heterogenous populations. J Math Biol 199028365–382. [DOI] [PubMed] [Google Scholar]
- 31.Dietz K. The estimation of the basic reproduction number for infectious diseases. Stat Methods Med Res 1993223–41. [DOI] [PubMed] [Google Scholar]
- 32.Haccou P, Jagers P, Vatutin V A.Branching processes: variation, growth, and extinction of populations. Cambridge: Cambridge University Press, 2005
- 33.Ferguson N M, Fraser C, Donnelly C A.et al Public health risk from the avian H5N1 influenza epidemic. Science 2004304968–969. [DOI] [PubMed] [Google Scholar]
- 34.Anderson R M, Fraser C, Ghani A C.et al Epidemiology, transmission dynamics and control of SARS: the 2002–2003 epidemic. Philos Trans R Soc Lond B Biol Sci 20043591091–1105. [DOI] [PMC free article] [PubMed] [Google Scholar]
- 35.Müller J, Kretzschmar M, Dietz K. Contact tracing in stochastic and deterministic epidemic models. Math Biosci 200016439–64. [DOI] [PubMed] [Google Scholar]
- 36.Müller J, Möhle M. Family trees for time continous birth death processes. J Appl Prob 200340980–994. [Google Scholar]
- 37.Cochran W G. Some methods for strengthening the common χ2 tests. Biometrics 195410417–451. [Google Scholar]
- 38.Meeker W Q, Escobar L A.Statistical methods for reliability data. New York: Wiley, 199860–62.