Abstract
Imaging polarimetry was used to examine different components of neovascular membranes in age-related macular degeneration. Retinal images were acquired with a scanning laser polarimeter. An innovative pseudo-color scale, based on cardinal directions of color, displayed two types of image information: relative phases and magnitudes of birefringence. Membranes had relative phase changes that did not correspond to anatomical structures in reflectance images. Further, membrane borders in depolarized light images had significantly higher contrasts than those in reflectance images. The retinal birefringence in neovascular membranes indicates optical activity consistent with molecular changes rather than merely geometrical changes.
1. INTRODUCTION
The imaging of exudative age-related macular degeneration (AMD) remains a challenge because patients with treatable lesions are not diagnosed and lose vision. In one of the most severe forms of exudative AMD, new blood vessels grow into the retinal or subretinal layers in a failed attempt at wound healing, called neovascularization.1 Neovascular membranes are the result and are composed of new or remodeled blood vessels and fibrous tissues, with fragile blood vessels exuding blood, lipid, or other fluid (Fig. 1). Neovascular membranes can have a variety of components. If the membrane has well-defined borders, it has been assumed to be superficial enough to include significant portions above the level of the retinal pigment epithelium (RPE), resulting in damage to the photoreceptors and the neural retina.2,3 On fluorescein angiography (FA), these membranes often have a dark ring around the membrane, in which there is a blockage of fluorescence, with the dark rim filled with fluid that may contain cellular debris, fibrin, collagen, serous fluid, and lipid, among other items. On near-infrared imaging, neovascular membranes are readily detected without contrast enhancing dye or pupil dilation, and the fluid-filled center has been described as a dark core surrounded by a brighter halo.4-8 If the borders of a membrane are not clearly seen, but there is evidence from a variety of imaging modalities of color change, elevation, or exudates associated with the retina, the membrane is termed occult. These are thought to have their main components beneath the RPE, which can obscure the membrane. Both these types of membranes have their feeder and drainer vessels from the choroidal circulation and are called choroidal neovascularization (CNV). These vessels are fenestrated and therefore leak.
Fig. 1.
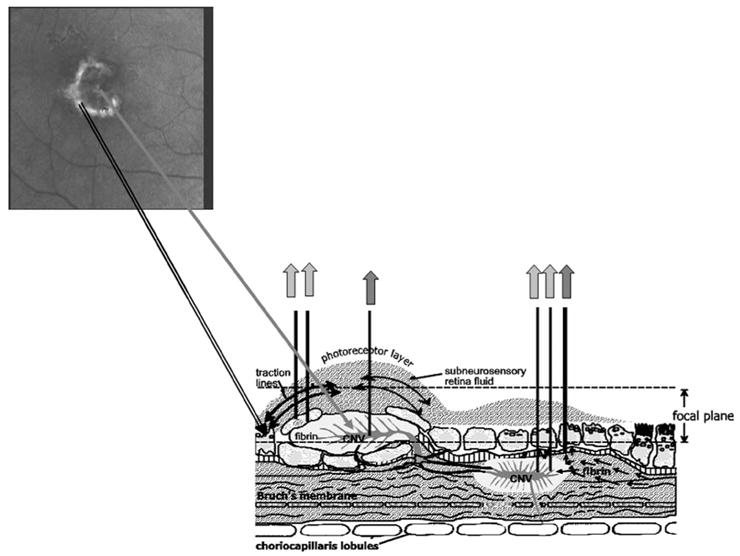
Schematic diagram of exudation in AMD. A well-defined lesion is shown at the upper left, from the polarimetric imaging. The corresponding lesion complex is shown at the lower left, which gives the appearance en face of dark core surrounded by a lighter halo. The lesion at the right is an occult lesion, which is less distinct as it lies mostly beneath the retina. Gray arrows indicate a strong light return from proteins or lipids, with darker arrows indicating scatter or absorption from blood within vessels or hemorrhage.
Another form of exudative AMD is the pigment epithelial detachment (PED), in which there is elevation of all tissues above the RPE and possibly an intra-Bruch’s membrane split, so that the layers of Bruch’s membrane adjacent to the RPE can also be elevated. A PED is often associated with a CNV membrane. This lesion is also readily seen with near-infrared imaging without contrast enhancing dye or pupil dilation, and the total retinal elevation can be as high as 600 μm. A visually threatening complication of neovascular exudation is the neurosensory retinal detachment, in which the neural retina is elevated by fluid, which may cover an area larger in diameter than that of the underlying PED or choroidal neovascular membrane. One of the most difficult types of lesions to detect, but sight threatening, occurs when the retinal circulation also undergoes remodeling or growth in response to AMD, originally termed retinal vascular anomalous complex (RVAC).9,10 This condition has also been called retinal angiomatous proliferation.11 Characteristics of RVAC include formation of new vessels above the RPE, angiomatous complexes of small vessels that resemble bird nests, dot or flame hemorrhages, anastomoses of retinal vessels with each other or with a choroidal vessel, and small pools of blood or fluid leakage into the superficial layers of the retina. In addition to all these types of lesions, there are several mechanisms that lead to extracellular fluid and intracellular fluid, with the most visible symptom being cysts, called cystoid macular edema, which is also sight threatening.
One long-range imaging goal is to detect and localize membranes early and noninvasively. An additional goal is to determine whether there is active leakage, an indication of lesion activity, as opposed to pooling of fluid or fibrous membranes from previously active lesions.
Recently, we developed a polarimetric imaging technique that selectively emphasizes the different components of light–tissue interactions in the retina.12-17 Multiply scattered light returning from deeper layers is typically emphasized by customized image analysis, i.e., computationally separating polarization preserving from depolarized light. Using the depolarized light image, contrast of the retinal vessels is improved in two ways when compared with images in which the polarization content is not analyzed. First, the unwanted specular reflex at the center of each vessel could be eliminated, and higher contrast of the retinal vessels compared with the neighboring retina is obtained because there is no bright stripe that can merge into the edge of the retinal vessel, particularly with small to medium vessels. Second, the bright reflection from the vitreo–retinal interface and nerve fiber layer is also removed, which otherwise adds a globally bright signal across the retina, including over the blood vessels.14 In addition to the vascular components of neovascular membranes, we investigated whether other aspects were visualized in polarimetric imaging, with the potential for increasing information over the ready detection and localization provided by noninvasive, near-infrared imaging. Previously, we found that for central serous retinopathy, even with significant fluid accumulation, there is good visualization of the deeper tissues through the fluid.15
2. METHODS
A. Subjects
Patients with exudative AMD were selected from our database of those patients referred for testing from their respective retina clinics, with individual cases selected to illustrate specific optical signatures of some of the components of exudation as seen with polarimetric imaging. Eyes with any prior intraocular surgery were excluded from the study, as were eyes with neovascularization likely due to other causes, such as high myopia. Demographic data are shown in figure captions. To quantify the findings at the rim of a neovascular membrane, we selected only those patients tested over a specific period of time and with no previous treatment who had FA data that clearly documented CNV that was not considerably larger than our field of view, which gave 40 patients. To better study the polarization characteristics at the borders of membranes, where neovascular activity can be great in advancing membranes, we then further defined the sample to include only patients for whom the border of the well-defined component of the membrane not greatly exceed 15 deg visual angle. Of the 19 patients, there were 10 females and 9 males, 8 Caucasian and 11 Japanese subjects, mean age 72.1±12.3 years. This case series is a portion of our larger sample that includes all types of membranes, which showed that strong foveal birefringence from intact cone axons that forms the pattern of a macular cross is related to good visual acuity, regardless of severity of the damage due to exudation below the photoreceptors.17 A single normal 70 year old female was selected from our sample to illustrate typical light–tissue interactions in the normal, aged eye. All eyes had sufficiently clear media for obtaining good quality polarimetry images. Although older subjects usually present with small pupils, we did not require a substantial increase in pupil size by means of dilation, since this instrument has only a 2.5 mm entrance/exit pupil. If a patient was already dilated from a previous examination, or tested immediately after dilation, there was little effect because of the small instrument pupil. Before testing, all subjects received a detailed explanation of the study procedure. All followed the consent procedure according to their respective locations: Schepens Eye Research Institute, the University Eye Hospital in Aachen, Tokyo Medical University, or Indiana University.
B. Polarization in the Human Eye, Instrumentation, and Polarization Computations
There are several tissues in the eye that introduce the majority of birefringence changes: the cornea, the retinal nerve fiber layer, the Henle fiber layer (cone photoreceptor axons radiating from the fovea), and sometimes the lamina cribrosa or the sclera (Fig. 2). The entire cornea is under stress by extra-ocular muscles, which are placed in generally similar locations in humans. The corneal stroma is thought to provide form birefringence due to stress and the resulting distortion because the fibrils are held at regular intervals by proteglycans18 instead of the direction of the collagen, since the direction changes with depth for the layers of parallel collagen fibrils in the stroma. The form birefringence for the nerve fiber bundles is thought to be due to the structure per se, with microtubules running in parallel directions and separated by relatively fixed amounts in the healthy nerve fiber layer.19 Similarly, for the form birefringence of the Henle fiber layer, the axons of the foveal photoreceptors, largely cones, are displaced along with the other neural elements, forming a regular layer that radiates out from the fovea.20 The deepest layer that contributes noticeable birefringence is the sclera, which along with Bruch’s membrane does not provide a strong light return in the healthy eye in comparison with the overlying structures, due to the increase of scatter in the overlying neural retina. A stronger signal from the sclera may be present in areas of retinal atrophy, where there is no retinal tissue overlying the sclera, such as is often found temporal to the optic nerve head.
Fig. 2.
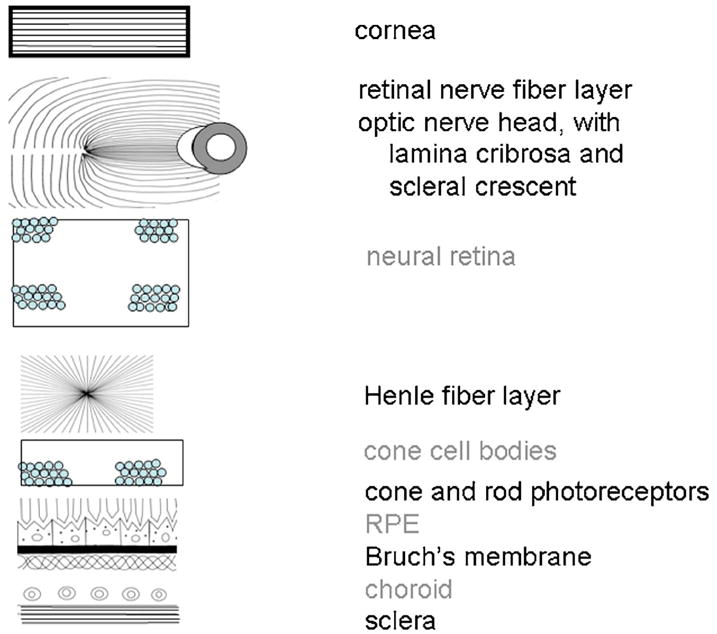
Schematic diagram of ocular components that influence polarization, separated according to two types of light–tissue interactions. Those tissues potentially acting as birefringent crystals or retaining the polarization content of the input illumination are labeled in black. Those leading to more randomly polarized light are labeled in gray.
We acquired polarimetric image data using a near-infrared, scanning laser polarimeter, GDx-N (Carl Zeiss Meditec, San Diego, California).16,19 Polarized light at roughly 780 nm scans the retina in a raster pattern, 15 × 15 deg visual angle. Twenty different input polarization angles are digitized in less than 1 s. To minimize unrelated corneal birefringence, the instrument has a compensator that matches a population average, with a magnitude of 60 nm and a polarization axis of 15 deg nasally downward (single-pass retardance). Although the polarization input illumination is uniform across the pupil plane for each input polarization angle, with an input/exit pupil of only about 2.5 mm, the linearly polarized input light undergoes some change in polarization due to the compensator, each individual’s cornea, and subsequent retinal elements before striking the exudative component of interest (Fig. 1). The returning light is separated into two beams by a polarizing beam splitter: Light of the same polarization as the illumination light was digitized at the parallel polarized detector, and light polarized at perpendicular to the illumination light was digitized at the crossed detector. Each image in the series is saved as 256 × 256 pixels with 8 bits of gray scale, with the raw image data containing 20 pairs of images, for a total of 40 images. Two main artifacts, common in an older population, can be observed and minimized by an experienced operator: intensity changes in the retinal images that vary over time owing to irregular tear film or vitreous floaters.
We computed 18 different image types according to polarization content using MATLAB (Mathworks, Natick, Massachusetts) but add some image types to those described in detail previously14-17 so that new information is shown beyond the magnitude of the birefringence or the signal remaining after the birefringence estimate is removed from images. For each pixel, the modulation was computed from the intensity variation for each detector separately across the 20 polarization angles. Next, the function for each detector was smoothed over the 20 input polarization angles using a fast Fourier transform (Fig. 3). The birefringence image was computed as the maximum modulation at each pixel for the crossed detector, over the 20 input polarization angles (Fig. 3). The depolarized light image was also computed from the crossed detector, by computing the amplitude of each pixel at the minimum value of the crossed detector over all 20 input polarization angles (Fig. 4). Note that the GDx is an incomplete polarimeter. Therefore, changes that reduce modulation of the birefringence can increase the signal that contributes to the depolarized light image. The crossed detector images are often quite dim, and the depolarized light image is especially dim. All images based mainly on the crossed detector are best viewed by scaling images to increase both intensity and contrast, including the birefringence image, but all quantitative comparisons were performed on raw data and not enhanced images (Adobe Photoshop, MATLAB).
Fig. 3.
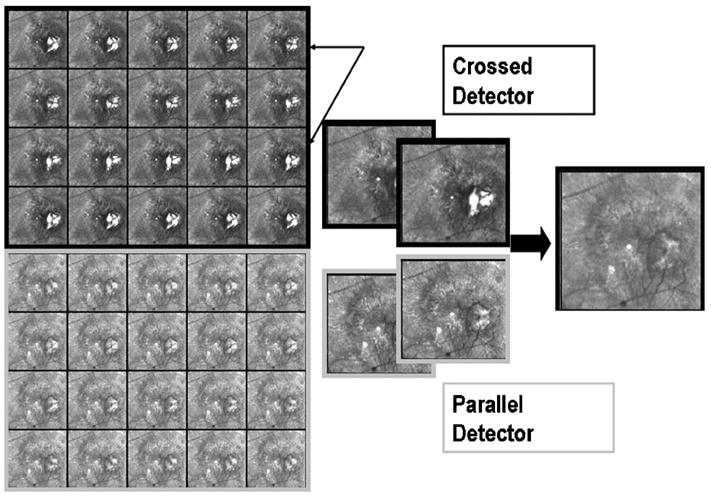
Raw data of the retina from a 71 year old Japanese male patient with exudative AMD. There are 20 raw images each from the crossed detector, each paired with 20 from the parallel detector, varying as a function of input polarization angle. Note changes with polarization angle, particularly visible in the lesion when using the crossed detector. The rightmost image emphasizes features that are less well visualized in any of the raw images, particularly a component of the membrane that is a pool of fluid that scatters light.
Fig. 4.
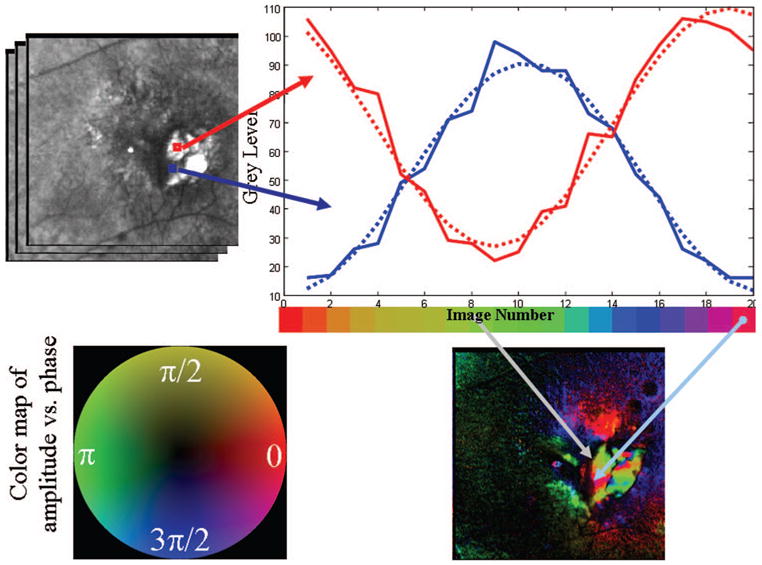
Schematic diagram of the polarimetry algorithm that is used to compute images with different polarization content, with data from the patient in Fig. 1. The gray scale for each pixel is calculated for each of 20 input polarization angles. (Top left) Two regions of interest are shown, with the average gray-scale value plotted to enable the comparison of the curve shapes for features that strongly with input polarization angle. (Top right) Gray-scale curves plotted as a function of input polarization angle, with each polarization angle being color coded to form a hue circle. (Bottom left) Hue circle, with opponent colors on orthogonal axes, that is the basis of the cardinal directions color map. The scale (in radians) represents the position on the color circle with phase wrapping; the frequency shown corresponds to the position on the hue circle and not that of the input polarization, which goes at twice the frequency because birefringent structures are symmetric. (Bottom right) Resulting color-coded image of input polarization angle at the maximum of the modulation at each pixel.
The average image is the mean of all 40 raw images, the same images from which the other 17 image types were computed, and includes a strong component from the parallel detector images and a weaker signal from the crossed detector (Fig. 4). The average image corresponds to confocal, near-infrared light images published previously.4-10
To illustrate that there are polarization differences as a function of input polarization that are readily apparent in exudative AMD, raw images for one series for the crossed detector and parallel detector are shown for each of the 20 input polarizations (Fig. 3). The gray-scale images for both the crossed and parallel detectors show components of the neovascular membrane that varied in intensity with input polarization angle. These are most easily seen by comparing the raw images for the crossed detector at the locations indicated by the black arrows.
The modulation of the parallel detector was also computed, across all 20 input polarization angles. The raw data show that the intensity of exudative components varies with input polarization angle, despite a strong light return that masks the polarization varying information (Fig. 3). In addition to the maximum of the parallel detector, we computed other image types that also emphasized the superficial layers, such as a parallel polarized image:
| (1) |
This further removes scattered light from the image. As previously described,13-17 under the following conditions there is little impact of individual differences in corneal birefringence of a population. First, all the polarimetric data from each point in a given retinal image are affected similarly by both the instrument and the corneal polarization. Second, the data do not provide absolute polarization values of the whole eye, including the cornea, but rather preserve the relative contrast for different types of polarimetric information across the field of view. These conditions are met for the image types described in detail here, which provide new ways to examine optical changes associated with exudation.
Somewhat different information can be obtained from the parallel polarized light detector images, given that the high contrast often results from light retaining polarization, although possibly with some change, e.g., retardance. Tissues that lead to some rotation of the returning polarization that was similar for all features would not increase the contrast of those features. A dimmer image would result. The parallel polarized light image was computed as the average intensity for the parallel polarized light minus the depolarized light contribution at each pixel. This value represents the average amount of light that retains its original polarization, independent of the input polarization angle. The light that modulates with polarization angle for the parallel detector represents a light return that has interacted with retinal tissue but has not been altered in its polarization characteristics to the same extent as the light returning via the crossed detector that is not randomly polarized.
C. Cardinal Directions Scale for Image Representation
A new type of pseudocolor scale, the cardinal directions scale,21 was extended to indicate the relative strength of return for specific input polarization angles. The above examples using gray-scale images show only the amplitude of the returning light for the crossed and parallel detector, which does not indicate which components of exudative lesions or other retinal structures have similar polarization characteristics. Using MATLAB, we implemented a color scale incorporating the cardinal directions of color: red versus green on one axis and yellow versus blue on the other, the cardinal directions, producing a hue circle with an achromatic center (Fig. 4). For each of the 20 input polarizations, we used a specific hue on the color circle. The input polarization angle does not, in fact, make a full 360 deg rotation, but light polarization is symmetric for angles 180 deg apart, leading to a signal that is twice the frequency of travel around the macula or optic nerve head.20
The cardinal directions color scale has several advantages as used for polarimetric imaging. First, a continuous scale is available with a hue circle, which is helpful since phase wraps in polarization angle, with a lead or lag not having any specific meaning for our data, i.e., angles > or <0 to 360 deg merely plot over those from 0 to 360 deg. Second, amplitude of the polarization modulation maps to saturation. This has the advantage in this application that strong hues indicate polarization content that could be important. Hue changes indicate variation across input polarization angle. Variations in saturation, which may appear as brightness changes depending on their size,22 indicate no particular interaction with polarization angle other than signal strength. Desaturated hues and small intensity variations may be considered noise when compared with saturated hues and distinct color changes. In this paper, we scaled the saturation separately for each image so that comparisons within a single image would be emphasized. Third, red and green do not mix to form yellow, which would be confusing to those unfamiliar with additive color, and instead we code this as an achromatic color, i.e., neither red nor green, unless it has signal strength in another direction. Fourth, components of exudative lesions with similar polarization properties are more likely to be grouped perceptually, which could provide new information. Fifth, recent evidence has indicated that masking is less strong along color directions that intersect rather than being collinear with an axis; that is, masking for red and green is less affected by yellow versus blue information than by red versus green information.23 This corresponds to our initial emphasis,21 that specific variations along one axis will affect the interpretation along another less with this scale than with typical scales such as the hot color scale. This provides the possibility for this scale to be used to advantage for two different variables, potentially unrelated to polarization analysis, to interpret in a more independent manner changes for each variable.
As seen in Fig. 4, there are specific regions of the exudative lesion that differ in color when the parallel or crossed detector data are plotted using the cardinal directions color scale. This indicates that the various exudative lesion components return light more strongly in one input polarization angle than in another, while other locations return light more strongly for a different set of input polarization angles. Both the vividness of the color and its striking variation across what seems like one exudative lesion correspond to the large variation in the individual images (Figs. 3 and 4), shown for the parallel detector. The cardinal directions scale may be plotted separately for both the crossed detector and the parallel detector (Figs. 4, 5, 6, 7) to examine the relative changes in signal strength for polarization angle.
Fig. 5.
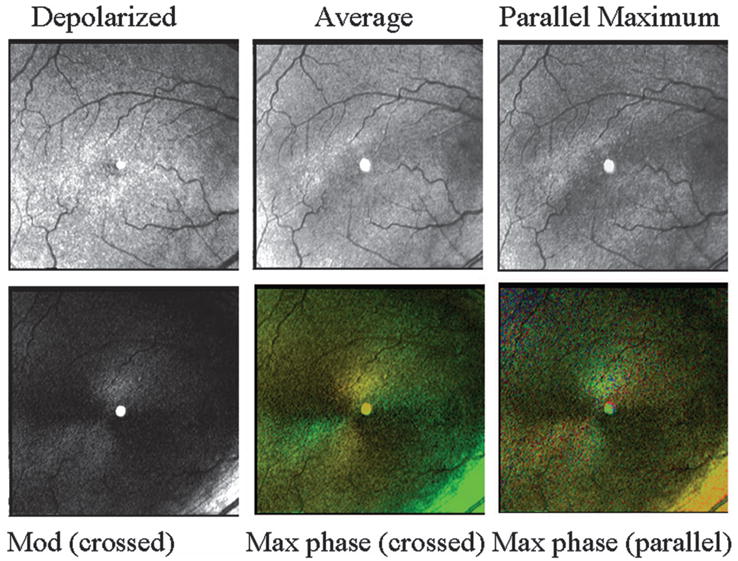
Retinal images, varying in polarization content, of a 70 year old white female with a normal retina. (Top left) Depolarized light image, emphasizing deeper features and with retinal vessels seen as absorbing structures, rather than the largest retinal vessels appearing to have highly reflective vessel walls. (Top middle) Average of all 40 images. Note in the lower right that there is a bright stripe down the center of the larger retinal vessel. (Top right) Maximum of the parallel detector, emphasizing superficial features. This image is the brightest of all computed images prior to scaling. (Bottom left) Birefringence image, showing a typical macular cross. (Bottom middle) Cardinal directions map of phase of the maximum phase of the crossed detector. The macular cross indicates good symmetry about the fovea, indicating an intact retina. The bright green area in the lower right of this panel is the strong light return of the nerve fiber bundle, which can be seen as achromatic in the birefringence figure. (Bottom right) Cardinal directions map of phase of the maximum phase of the parallel detector.
Fig. 6.
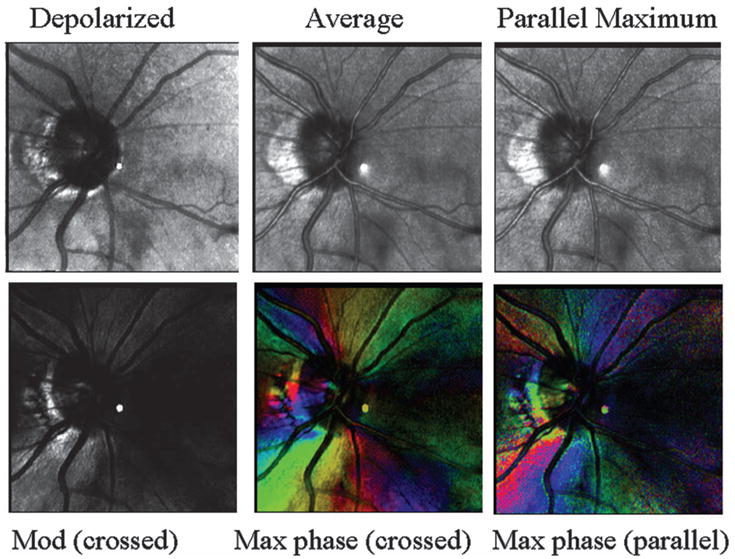
Retinal images, varying in polarization content, of optic nerve head and peripapillary region of the subject in Fig. 5. (Top left) Depolarized light image, emphasizing deeper features and with the retinal vessels seen as absorbing structures, rather than the larger vessels appearing to have highly reflective vessel walls. Peripapillary atrophy is readily visible. (Top middle) Average of all 40 images. Note bright stripes down the centers of the larger retinal vessels. (Top right) Maximum of the parallel detector, emphasizing superficial features. This image is the brightest of all computed images prior to scaling. (Bottom left) Birefringence image, showing strong birefringence, somewhat asymmetrical around the optic nerve head. (Bottom middle) Cardinal directions map of phase of the maximum phase of the crossed detector, showing a striking change in the strength of the signal as a function of input polarization angle, corresponding to the direct of the nerve fiber bundles (Bottom right) Cardinal directions map of phase of the maximum phase of the parallel detector.
Fig. 7.
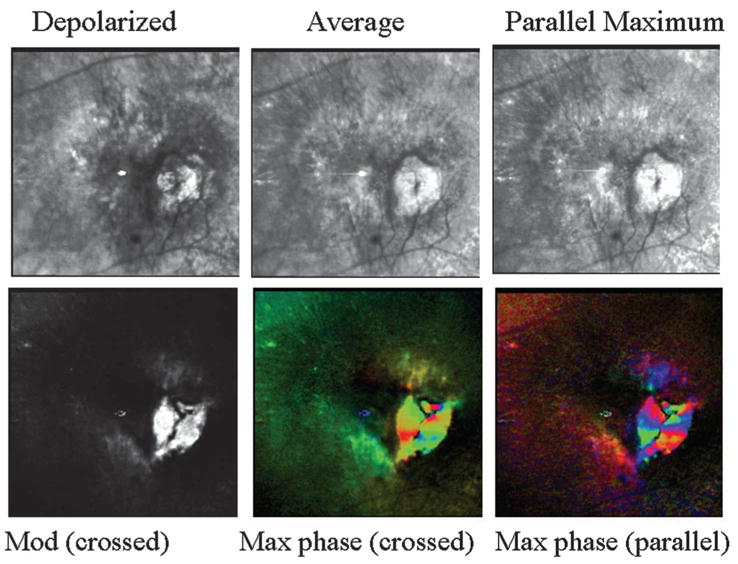
Retinal images of the patient from Fig. 3, showing a complex exudative lesion that includes subretinal components and a pool of fluid in the more superficial layers in contact with retinal vascular changes. (Top left) Depolarized light image, showing that the lesion has several components and fluid. (Top middle) Average image, with somewhat increased emphasis on the more superficial components, and better visualization of the striae than in the depolarized light image. (Top right) Parallel polarized light image, with contrast adjusted to emphasize fluid pooled in the superficial region and in contact with retinal vessel anomalies, suggesting a RVAC. (Bottom left) Birefringence image, showing no evidence of a macular cross. (Bottom middle) Maximum of the crossed detector, with striking changes across the retina that indicate that the phase of the maximum signal as a function of the input polarization angle varies over the exudative lesion component. There is no evidence of the typical and regular pattern of a macular cross. In addition, the birefringence changes do not correspond to a single anatomic feature that is readily visible, as shown in the top-left panel, but rather there are several groups of adjacent pixels that all have similar and strong responses as a function of input polarization angle. (Bottom right) Maximum of the parallel detector, again showing strong variations in polarization content, clustering into small areas that vary similarly with input polarization angle.
As with any color scale used to display spatial information, there will be artifact for the perception of brightness and hue as a function of size for the features of interest; assimilation of the colors of adjacent features, particularly when they are small; and color contrast accentuating the differences for specific colors for some features large enough to be distinguished.22 The color appearance per se is only a rough guide but allows the observer to group neighboring areas of similar colors to segment the image.
D. Data Analysis
We performed quantitative comparisons for regions of interest to determine whether the impression that a given component in a neovascular membrane was enhanced by a specific image type was correct. For instance, as discussed in detail below for the case in Figs. 3, 4, and 7, in the images that contain a high proportion of polarization preserving light, the more superficial features seemed to be enhanced, in keeping with previous findings.12-17 A parallel polarized image that emphasized more superficial features was selected for comparison with the depolarized light image, which emphasizes deeper features. We selected three regions of interest of 10 × 10 pixels each. Two regions were on a feature that is consistent with a pool of fluid seen more readily when superficial images are enhanced. The other region was outside this region, but in a region that corresponds to a fibrovascular membrane with active exudation shown on FA in both early and late phases (Fig. 8). The mean and standard deviations were taken without contrast manipulation of the image data. We performed four planned, matched-sample t-tests with significance taken as P < 0.0125 to correct for the number of tests.
Fig. 8.
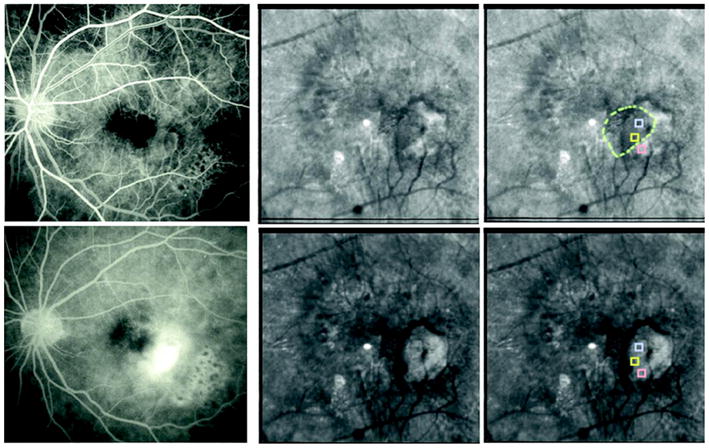
(Color online) FA and polarization images of the patient from Fig. 3. (Top left) Early-phase FA. (Top middle) Parallel polarized light image, showing the pool of fluid that corresponds to the region of leakage in the FA that blocks the deeper fluorescence. (Top right) Dashed circle shows presumptive border of the visualized pool, with the three sampled regions of interest enclosed within boxes. The middle sample within the pool does not differ from the top one, also within the pool, but does differ from the bottom one outside the pool. (Bottom left) Late-phase FA, with the pool of fluid seen in the parallel polarized light image blocking the fluorescence. (Bottom middle) Depolarized light image, showing exudation, but de-emphasizing the superficial pool of fluid. (Bottom right) Depolarized light image, with regions of interest as in the top-right image, but with a difference between the top and the middle samples and no difference between the middle and the bottom samples.
The border of the neovascular membrane, which appears dark on FA or indocyanine angiography (ICG) presumably owing to blockage of fluorescence by exuded material, was examined quantitatively for well-defined membranes. This region has previously been defined for IR imaging as a bright halo surrounding a dark core,4,5,8 with the previous method corresponding most closely to the average image type. For a series of patients who had a well-defined rim in the average image, we compared the contrasts of the rim of the neovascular membrane for average images with depolarized light images, with the latter typically improving visualization of deeper features. We computed the Michelson contrast as
| (2) |
where C is the Michelson contrast, Lmax is the average gray scale from a sample on the region of interest, and Lmin is the average gray scale of a neighboring control region. This control region was selected to have neither the major components of neovascular membranes or drusen nor other features such as retinal vessels. Thus, there were two 3 × 3 pixel samples per image, selected by using only the average image for each patient: one on the rim and the other off the rim. Our test is a conservative one, since the corresponding contrast for the depolarized light image was computed automatically, without the operator seeing the image and trying to maximize the contrast of it with respect to the average image. In many specific cases, the region appeared more distinct in the depolarized light image, which would have produced an even higher contrast for this image type. The contrasts were calculated on the raw data, not those scaled or enhanced to present a brighter image to the operator. Michelson contrasts were compared using a matched-sample t-test.
3. RESULTS
Even in aged eyes without dilated pupils, the main features of the fundus are readily visible in near-infrared light, including retinal blood vessels, the foveal region, exudative lesions, and the optic nerve head when in the field of view. Images differing in polarization content emphasized different features or emphasized different aspects of features. For a normal subject whose age corresponded to our patient sample, the birefringence image and the cardinal directions color maps for the maximum phase of the crossed detector and the parallel detector showed a macular cross (Fig. 5), which indicates the amplitude of the modulation in retardance as a function of input polarization. This cross is produced by the interaction of corneal and retinal birefringence. The cardinal directions color maps for the maximum phase indicate that there is a systematic radial change in birefringence, i.e., good radial symmetry of the polarization input angle producing the maximum retardance about the fovea. This is expected, since the form birefringence assumed to produce this cross is radially symmetric about the fovea, and the path through the cornea is constant. For this individual, the birefringence signal from the inferior nerve fiber bundle was stronger than that from the macular cross, indicated by a more saturated green color for the nerve fiber bundle (Figs. 5 and 6). This is not surprising, as the nerve fiber bundle in the field of view in Fig. 5 is at one of its thickest points in the retina and can be seen to vary in Fig. 6. While this result is found in some other normal subjects, it may not be typical for all ages and disease states. It is expected that the relative strength of the birefringence signal will vary across location on the nerve fiber bundle and across individuals, particularly if there is damage to the nerve fiber bundles due to diseases such as glaucoma. This normal subject has a large scleral crescent, the bright area next to the optic nerve head, in which there is a strong light return because there are no photoreceptors or RPE. There are also pigmentary changes next to the optic nerve, not unusual in older subjects. There is a strong birefringence signal for the scleral crescent in both the gray-scale and cardinal directions scale map, showing variation in the strength of return as a function of polarization input angle, similar to that found in atrophy in AMD (not shown).
For patients with exudative AMD, components of new vessel membranes, pools of fluid, striae indicating traction lines, abnormal retinal vasculature, exudates, and atrophic regions were readily visible, but they varied in contrast according to polarization image type (Figs. 1, 3, 4, 7, 9, and 11). Some lesions had components that extended to more than the 15 deg visual angle image size, and thus we confined our quantitative analysis to components of membranes. For well-defined membranes, the border of the new vessel membrane could be seen entirely or partially in most types of computed images (Figs. 1 and 11), with the depolarized light image particularly emphasizing the border of the membrane. Additionally, there were focal changes not always visible with other imaging modalities.
For a patient with a well-established neovascular membrane, several components are readily seen (Figs. 1, 3, 4, and 7). The depolarized light images show the highly disrupted tissues associated with the choroidal neovascularization. Although it is difficult to determine where the fovea was prior to the severe exudative changes, the birefringence image does not show the usual macular cross. Instead, there are large changes as a function of polarization input angle that are associated with the exudative components of the lesion, as shown by comparing the FA data in Fig. 8 with the cardinal directions scale maps in Fig. 7. There is an unusually strong birefringence signal in the gray-scale birefringence image and the cardinal directions scale maps of the phase of the maximum of the crossed and parallel detectors. There are several different birefringence maxima separated according to location on the lesion, with some components having little or no birefringence signal. For those with strong signals, the modulation of signal amplitude over all input polarization angles at a region of interest in the exudative portion reached 245±6.8, with the gray scale ranging from 0 to 255. This remarkable but atypical variation occurred even though the signal did not saturate over large portions of the image in either detector. The mean of this region for the crossed detector was 109±5.4 and 188±14.2 for the crossed and parallel detectors, respectively. Figure 3 shows an unusually high signal for the crossed detector, which in a normal eye might occur in connection with a saturated signal in the parallel detector.
The parallel polarized light image emphasizes a pool of fluid that is more superficial than the subretinal region that well-defined neovascular membranes invade and, in proximity to retinal vessel abnormalities, one type of RVAC.10,11 This pool of fluid is of narrower diameter than the larger exudative lesion, lying above on the nasal (left) side of the main leakage in the images and partially blocking the fluorescence of the deeper component of exudation (Fig. 8). The retina is normally under tension, and as there is clear-cut leakage from the larger component, tension can then increase and can lead to the type of striae shown in the average and parallel polarized images (Fig. 7). With such mechanical constraints, the superficial fluid is likely to be a thin pool, adding a small signal to the height or intensity changes from the deeper components, with thickness changes due to RVAC shown to be associated with poorer visual prognosis.9 In the parallel polarized image, the top and middle regions of interest in Fig. 8, both within the area of the pool of fluid, have the same gray-scale levels (p = 0.7). In contrast, the bottom sample is not within the pool of fluid, and the top region of interest is significantly darker than the bottom region of interest (p < 0.01). In the depolarized light image, the top and bottom samples are the same (p = 0.4), while the top is now brighter than the middle sample (p < 0.01).
Another type of birefringence change, fringes surrounding the lesion, is shown for a patient with a different type of lesion: a PED with a large amount of fluid and a comparatively small choroidal neovascular component (Fig. 9, top). To date, this finding is not limited to AMD or age or racial group and is found in many types of exudative changes associated with large, fluid-filled lesions. For this patient, the fringes display largely amplitude changes. That is, the fringes do not indicate differing lesion components returning more light as a function of input polarization angle. The corresponding data from ocular coherence tomography (OCT) show that there is a significant amount of fluid that elevates the retina (Fig. 9, bottom).
Fig. 9.
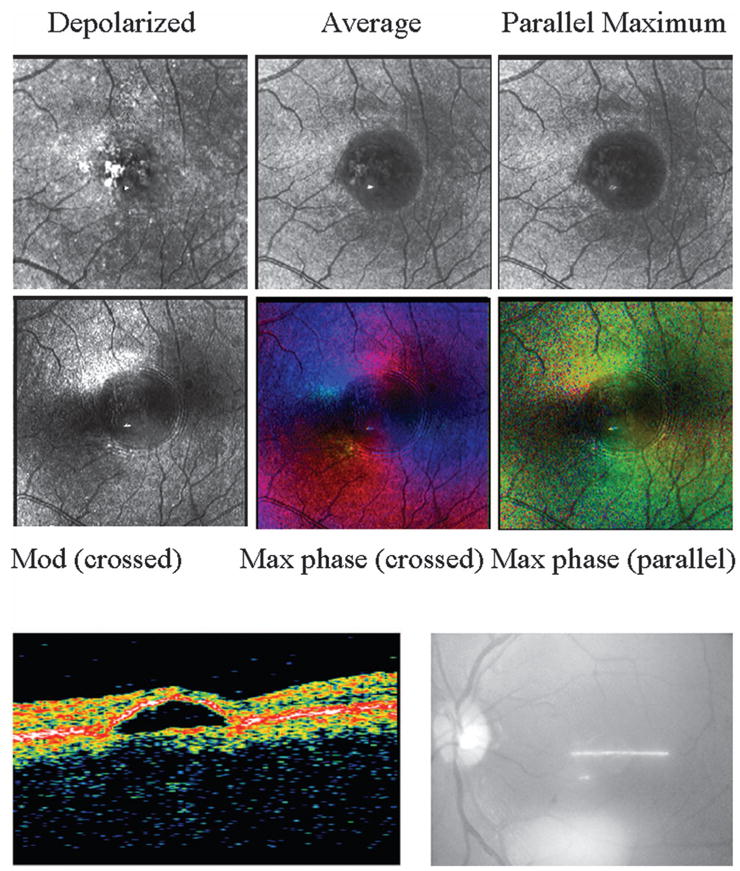
(Upper panels) Retinal images of a 48 year old Japanese male with a PED. (Top left) Single panel from the crossed detector, showing a strong return at specific locations that do not correspond to regions of strong light return in the other image types in the middle and right columns. (Top middle) Average image, with increased emphasis on the more superficial components and better visualization of the fluid than in the depolarized light image. (Top right) Maximum of the parallel detector. (Bottom left) Birefringence image, showing a disrupted macular cross and fringes in a concentric pattern around the lesion. (Bottom middle) Maximum of the crossed detector, indicating that the phase producing the maximum of the input orientation angle does not have as strong and regular macular cross as a normal subject but has concentric fringes that vary in amplitude but not color. The birefringence changes seen as different in color do not correspond to a single anatomic feature that is readily visible in the top middle image but instead extend horizontally to the left of the lesion. (Bottom right) Maximum of the parallel detector, again showing variations in polarization content and concentric fringes. (Lower panels) Left, OCT image of PED, showing the fluid elevating the retina; right, sampling region, showing that the scan data traverse the center of the PED.
A well-defined CNV membrane with active leakage around the edges (Figs. 1 and 10) often has a border outside the membrane that blocks fluorescence in FA and ICG (Fig. 11). Well-defined CNV has a strong signal in several polarimetry image types (Fig. 10). The assumed border of the new vessel membrane could be seen in both the computed depolarized light image and the average image.
Fig. 10.
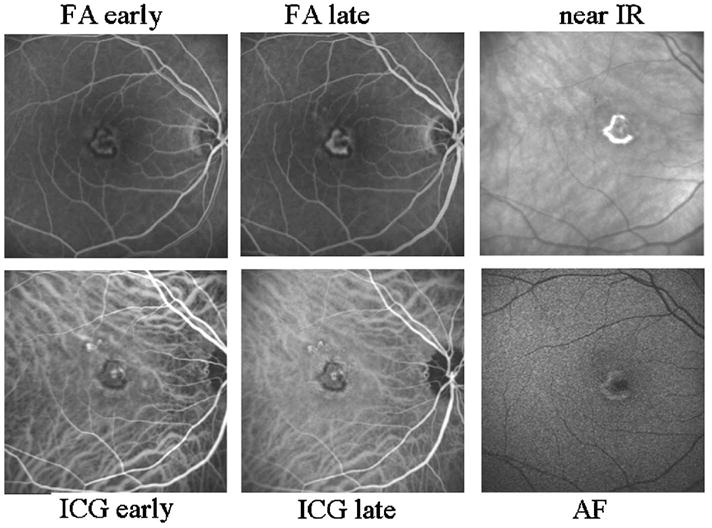
Retinal images showing well-defined CNV in a 51 year old Caucasian female, using the Heidelberg retinal angiograph. (Top left) Early-phase FA, showing the early leakage and a dark border around the CNV membrane that blocks fluorescence. A central component of the lesion is weakly fluorescent. (Top center) Late-phase FA, showing progressive leakage, the border that blocks fluorescence, and the central component that is weakly fluorescent. Note that while the retina is not normal outside the region of the lesion, there is no extensive leakage nor strongly fluorescent structures other than the lesion. (Top right) Near-infrared image without dye, showing a strong light return from the region that is overlapping and mainly outside the dark border in the left and middle panels. (Bottom left) Early-phase ICG, showing a well-defined CNV that corresponds in size to that seen on FA, other than the stronger fluorescence of the components superior to the main lesion. (Bottom middle) Late-phase ICG, showing more evidence of fluorescent structures outside the border of the membrane that is well defined on FA. The dark border corresponds to the brighter region on near IR, in the top-right panel. (Bottom right) Short-wavelength (488 nm) excitation with a barrier filter that passes mainly longer wavelengths, and prior to the injection of fluorescent dye, termed autofluorescence. The central component of the lesion blocks the returning light. The brightest component corresponds better to the bright portion in the near-infrared image in the top right than the angiography images, which indicate that the active edge of the lesion is smaller.
Fig. 11.
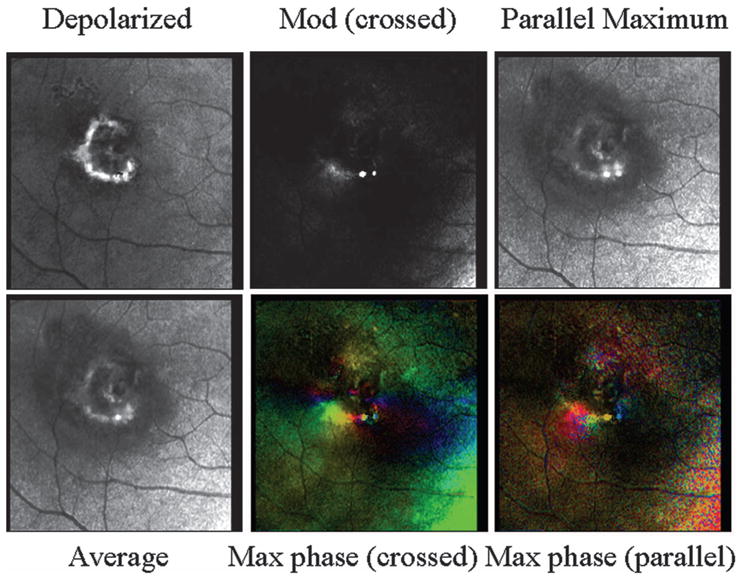
Polarimetry images of the patient from Fig. 10 on a scale sufficiently small so as not to include the lesion components outside the main well-defined lesion. (Top left) Depolarized light image, emphasizing deeper features and with retinal vessels seen as absorbing structures and the rim of the CNV appearing bright compared with neighboring retina. This region compares well with the near-IR image in Fig. 10 but is larger in diameter than the active edge of the lesion in the angiography images. Both the depolarized light image and the right-column images from Fig. 10 correspond to the dark border around the CNV in the angiography images. There is a central component also seen in all but the gray-scale birefringence image. (Top center) Average of all 40 images, showing more fluid leakage and a more distinct central component of the membrane. (Top right) Maximum of the parallel detector, emphasizing superficial features, emphasizing the superficial features. (Bottom left) Birefringence image, lacking typical macular cross and showing the lower-left edge of the border of the exudation. (Bottom middle) Cardinal directions scale map of phase of the maximum phase of the crossed detector. Note the lack of symmetry about the fovea, but the strong color change in the lower-left portion of the lesion. There is also a color change in the central lesion component. (Bottom right) Cardinal directions scale map of phase of the maximum phase of the parallel detector, showing findings similar to those of the crossed detector map.
The very bright appearance of the CNV border was not due to merely a higher index of refraction change at the border, for instance, that associated with fibrin or other protein, lipid, or cellular debris, because the ratio of the minimum of the crossed detector to the average for both detectors was significantly greater at the rim of the neovascular membrane versus a control region of interest. This ratio was 1.21, on average, and significantly >1 (t =13.3, p < 0.0001). This ratio was >1 for 13 of 19 patients. As we used a conservative measure for comparison, i.e., only one region of interest on the rim, which was selected from the average image and not the depolarized image, the data as presented might underestimate the strength of the depolarized light signature of the CNV rim. That is, the ratio might increase for individual patients or be significant for all the patients if the operator could have selected a region of interest based on the depolarized light image or taken multiple samples from the rim, which was for some patients so thin in the average image as unlikely to permit optimal sampling. Alternatively, a higher ratio may indicate a different tissue status for some of the lesions, with other lesions with different molecular constituents having a lower ratio.
4. DISCUSSION
Polarimetric imaging provides detection and localization of CNV in AMD in a noninvasive manner, i.e., without requiring pupil dilation or dye, as expected from previous findings in near-IR imaging.4-10,17 Not only are these images rapid to acquire and comfortable for the patient, they also provide additional information about various components of exudation. In contrast, healthy retina interacts with polarized light to form two large and regular structures: the macular cross and the birefringence around the optic nerve head. Deviations from this predictable pattern indicate damage from pathology, such as structural or molecular changes.
The borders of well-defined CNV were usually clearly defined in the depolarized light images. The average image corresponds to the more common near-infrared, confocal image, which has already been shown to be superior to color fundus images for the detection of CNV.7 The depolarized light images typically have even higher contrast than the average images.
One of the most unexpected results was that for well-defined CNV, the material that blocks fluorescence exhibited such a strong signal and corresponded to the dark component of the membrane in FA, i.e., the portion that blocks fluorescence. As a result, the borders of the membrane appear larger in the near-infrared images, including the typical confocal and the depolarized, average, and parallel polarized images. Similarly, when a birefringence signal was seen that corresponded to the border of CNV, this also was at the more eccentric portion of the lesion rather than the portion that is what has been called the active portion of the lesion on FA or ICG. There is a well-known disagreement in the size of CNV between FA and histology, with angiography underestimating the diameter of lesions.2,3
The cardinal directions scale maps indicated that there were striking changes in the strength of the signal for different polarization input angles, most often corresponding to one or more exudative components of the CNV. There were not always similar color changes for lesions filled with a large amount of what is most likely homogeneous fluid, such as PEDs that are filled with serous fluid. Instead, these fluid-filled lesions were often associated with a variation in the strength of the polarization signal that led to a fringe pattern.
The molecular components of CNV are varied5 but led to a relatively high proportion of light being rotated and passing through the crossed detector. In the normal retina, proportionally more light passes through the parallel detector. In CNV, some components of lesions had remarkable variation with input polarization (Figs. 4, 7, and 11). There was not the striking change for merely large accumulations of fluid, as in the PED case, which mainly showed fringes that varied in intensity and not in color. This finding and the relatively higher contrast for the depolarized light images both indicate that there is not an easily made geometrical optics argument to explain our data. Variation in the molecular compositions of the lesion components and in which tissues provide the strongest birefringence signal are more likely factors in polarization changes in light returning from the retinas of patients with exudative AMD. There are differences among patients, and further analysis will be needed to determine whether the polarization changes reveal differing membrane types,2,3 or more active leakage, which may help classify patients for treatment.
Acknowledgments
This work was supported in part by NIH National Eye Institute grant EY007624 and National Institute of Biomedical Imaging and Bioengineering grant E002346.
Contributor Information
Ann E. Elsner, School of Optometry, Indiana University, 800 E Atwater Avenue, Bloomington, Indiana 47405, USA
Anke Weber, University Hospital RWTH Aachen, Pauwelsstrasse 30, 52074 Aachen, Germany.
Michael C. Cheney, Atlantis Components, Inc., 25 First Street, Cambridge, Massachusetts 02141, USA
Dean A. VanNasdale, School of Optometry, Indiana University, 800 E Atwater Avenue, Bloomington, Indiana 47405, USA
Masahiro Miura, Tokyo Medical University, 6-7-1 Nishi-Shinjuku, Shinjuku, Tokyo 1600023, Japan.
References
- 1.Schlingemann RO. Role of growth factors and the wound healing response in age-related macular degeneration. Graefe’s Arch Clin Exp Ophthalmol. 2004;24:91–101. doi: 10.1007/s00417-003-0828-0. [DOI] [PubMed] [Google Scholar]
- 2.Grossniklaus HE, Miskala PH, Green WR, Bressler SB, Hawkins BS, Toth C, Wilson J, Bressler NM. Histopathologic and ultrastructural features of surgically excised subfoveal choroidal neovascular lesions: submacular surgery trials report no. 7. Arch Ophthalmol (Chicago) 2005;123:914–921. doi: 10.1001/archopht.123.7.914. [DOI] [PubMed] [Google Scholar]
- 3.Grossniklaus HE, Bressler SB, Miskala PH, Green WR, Bressler NM, Hawkins BS, Toth CA, Wilson DJ (Submacular Surgery Trials Research Group) Comparison of 2D reconstructions of surgically excised subfoveal choroidal neovascularization with fluorescein angiographic features: SST report No. 15. Ophthalmology. 2006;113:279.e1–279.e5 . doi: 10.1016/j.ophtha.2005.10.031. [DOI] [PubMed] [Google Scholar]
- 4.Elsner AE, Burns S, Weiter J, Delori F. Infrared imaging of sub-retinal structures in the human ocular fundus. Vision Res. 1996;36:191–205. doi: 10.1016/0042-6989(95)00100-e. [DOI] [PubMed] [Google Scholar]
- 5.Hartnett EM, Elsner AE. Characteristics of exudative age-related macular degeneration determined in vivo with confocal direct and indirect infrared imaging. Ophthalmology. 1996;103:58–71. doi: 10.1016/s0161-6420(96)30731-8. [DOI] [PubMed] [Google Scholar]
- 6.Miura M, Elsner AE. Three dimensional imaging in age-related macular degeneration. Opt Express. 2001;9:436–443. doi: 10.1364/oe.9.000436. [DOI] [PubMed] [Google Scholar]
- 7.Miura M, Elsner AE, Beausencourt E, Kunze C, Hartnett ME, Lashkari K, Trempe C. Grading of infrared confocal scanning laser tomography and video displays of digitized color slides in exudative age-related macular degeneration. Retina. 2002;22:300–308. doi: 10.1097/00006982-200206000-00008. [DOI] [PubMed] [Google Scholar]
- 8.Elsner AE, Miura M, Burns SA, Beausencourt E, Kunze C, Kelley L, Walker JP, Wing GL, Raskauskas PA, Fletcher DC, Zhou Q, Dreher AW. Multiply scattered light tomography and confocal imaging: detecting neovascularization in age-related macular degeneration. Opt Express. 2000;7:95–106. doi: 10.1364/oe.7.000095. [DOI] [PubMed] [Google Scholar]
- 9.Kunze C, Elsner AE, Beausencourt E, Moraes L, Hartnett ME, Trempe CL. Spatial extent of pigment epithelial detachments in age-related macular degeneration. Ophthalmology. 1999;106:1830–1840. doi: 10.1016/S0161-6420(99)90364-0. [DOI] [PubMed] [Google Scholar]
- 10.Hartnett ME, Weiter JJ, Staurenghi G, Elsner AE. Deep retinal vascular anomalous complexes in advanced age-related macular degeneration. Ophthalmology. 1996;103:2042–2053. doi: 10.1016/s0161-6420(96)30389-8. [DOI] [PubMed] [Google Scholar]
- 11.Yannuzzi LA, Negrao S, Iida T, Carvalho C, Rodriguez-Coleman H, Slakter J, Freund KB, Sorenson J, Orlock D, Borodoker N. Retinal angiomatous proliferation in age-related macular degeneration. Retina. 2001;21:416–434. doi: 10.1097/00006982-200110000-00003. [DOI] [PubMed] [Google Scholar]
- 12.Elsner AE, Miura M, Stewart JB, Kairala MB, Burns SA. Novel algorithms for polarization imaging resulting in improved quantification of retinal blood vessels. Stud Health Technol Inform. 2003;94:59–61. [PubMed] [Google Scholar]
- 13.Burns SA, Elsner AE, Mellem-Kairala MB, Simmons RB. Improved contrast of subretinal structures using polarization analysis. Invest Ophthalmol Visual Sci. 2003;44:4061–4068. doi: 10.1167/iovs.03-0124. [DOI] [PMC free article] [PubMed] [Google Scholar]
- 14.Weber A, Cheney MC, Smithwick QYJ, Elsner AE. Polarimetric imaging and blood vessel quantification. Opt Express. 2004;12:5178–5190. doi: 10.1364/opex.12.005178. [DOI] [PubMed] [Google Scholar]
- 15.Miura M, Elsner AE, Weber A, Cheney MC, Osako M, Usui M, Iwasaki T. Imaging polarimetry in central serous chorioretinopathy. Am J Ophthalmol. 2005;140:1014–1019. doi: 10.1016/j.ajo.2005.06.033. [DOI] [PMC free article] [PubMed] [Google Scholar]
- 16.Mellem-Kairala MB, Elsner AE, Weber A, Simmons RB, Burns SA. Improved contrast of peripapillary hyperpigmentation using polarization analysis. Invest Ophthalmol Visual Sci. 2005;46:1099–1106. doi: 10.1167/iovs.04-0574. [DOI] [PubMed] [Google Scholar]
- 17.Weber A, Elsner AE, Mirua M, Kompa S, Cheney MC. Relationship between foveal birefringence and visual acuity in neovascular age-related macular degeneration. Eye. 2006 doi: 10.1038/sj.eye.6702203. [DOI] [PMC free article] [PubMed] [Google Scholar]
- 18.Bairaktaris G, Lewis D, Fullwood NJ, Nieduszynski IA, Marcyniuk B, Quantock AJ, Ridgway AE. An ultrastructural investigation into proteoglycan distribution in human corneas. Cornea. 1998;17:396–402. doi: 10.1097/00003226-199807000-00010. [DOI] [PubMed] [Google Scholar]
- 19.Dreher AW, Reiter K, Weinreb RN. Spatially resolved birefringence of the retinal nerve fiber layer assessed with a retinal laser ellipsometer. Appl Opt. 1992;31:3730–3735. doi: 10.1364/AO.31.003730. [DOI] [PubMed] [Google Scholar]
- 20.Hunter DG, Sandruck JC, Sau S, Patel SN, Guyton DL. Mathematical modeling of retinal birefringence scanning. J Opt Soc Am A. 1999;16:2103–2111. doi: 10.1364/josaa.16.002103. [DOI] [PubMed] [Google Scholar]
- 21.Elsner AE, Cheney MC, Weber A, Miura M. Visualization of two image variables simultaneously using cardinal directions of color vision. Stud Health Technol Inform. 2004;98:89–91. [PubMed] [Google Scholar]
- 22.Elsner AE, Pokorny J, Burns SA. Chromaticity discrimination: effects of luminance contrast and spatial frequency. J Opt Soc Am A. 1986;3:916–920. doi: 10.1364/josaa.3.000916. [DOI] [PubMed] [Google Scholar]
- 23.Hansen T, Gegenfurtner K. Higher level chromatic mechanisms for image segmentation. J Vision. 2006;13:239–259. doi: 10.1167/6.3.5. [DOI] [PubMed] [Google Scholar]


