Abstract
In vitro evolution of RNA molecules requires a method for executing many consecutive serial dilutions. To solve this problem, a microfluidic circuit has been fabricated in a three-layer glass-PDMS-glass device. The 400-nL serial dilution circuit contains five integrated membrane valves: three two-way valves arranged in a loop to drive cyclic mixing of the diluent and carryover, and two bus valves to control fluidic access to the circuit through input and output channels. By varying the valve placement in the circuit, carryover fractions from 0.04 to 0.2 were obtained. Each dilution process, which is comprised of a diluent flush cycle followed by a mixing cycle, is carried out with no pipeting, and a sample volume of 400 nL is sufficient for conducting an arbitrary number of serial dilutions. Mixing is precisely controlled by changing the cyclic pumping rate, with a minimum mixing time of 22 s. This microfluidic circuit is generally applicable for integrating automated serial dilution and sample preparation in almost any microfluidic architecture.
INTRODUCTION
Serial dilution is among the most fundamental and widely practiced laboratory techniques, with applications ranging from measuring detector response, to determining kinetic rate constants, to culturing cells. Serial dilution is particularly important in directed evolution experiments in which a population of RNA molecules is made to undergo repeated rounds of selective amplification. In order to evolve molecules with interesting properties, it is necessary to propagate the population of RNAs through many logs of selective growth. This is accomplished by serially diluting an aliquot of the reaction mixture into fresh growth medium at regular intervals.1-3 Performing serial dilutions by manual pipeting is a mundane and time-consuming task that has limited the execution of highly longitudinal experiments in molecular evolution. Microfluidic technology presents a practical solution to this problem by automating the fluid handling associated with serial dilution.
The core strengths of microfluidic technology are integration, high throughput, and low-volume handling. Microfluidic analogs outperform conventional instrumentation with regard to speed,4,5 throughput,6,7 and reagent consumption8 by an order of magnitude or more, and allow integration of sample preparation and analysis in a single device.9,10 Precise manipulation of fluids in these devices is achieved by electrokinetic control,11-14 microfabricated membrane valves,15,16 or various other approaches to microfluidic transport and control.17 The combination of highly ordered flow and precise manipulation allows one to carry out diverse synthetic and analytical methods with remarkable control.18,19
Despite the near universal need for the preparation of standard samples, little work has been done to miniaturize and to expedite this process. Approaches have included variously configured splitter channels20-22 and differential metering of multiple inputs into addressable microfabricated assay wells.23 Each of these approaches to serial dilution requires N independent outputs (splitter branches, end reactors, etc.) for N consecutive dilutions, making them unsuitable for executing an arbitrary number of dilutions. The ideal circuit would automate sample and diluent metering and mixing, while scaling to an arbitrary number of serial dilutions. A microfluidic mixing loop addresses mixing requirements by reducing effective diffusion lengths,24 while providing a compact geometry for manipulating nanoliter volumes.25
A microfluidic serial dilution circuit that implements these advantageous mixing and scaling characteristics and incorporates sample metering elements has been designed, fabricated, and characterized. It is compact and does not geometrically constrain the number of possible serial dilutions. Precise metering of the sample carryover fraction and rapid, reproducible mixing of the diluent with the carryover are achieved in the same structure. The device is computer controlled, and the preparation of successive serial dilutions is fully automated. Because the circuit employs microfluidic pumping, serially diluted sample aliquots can easily be routed from the dilution circuit to other microfluidic components, such as a separation channel or microreactor.
EXPERIMENTAL
Microdevice Fabrication and Design
The three-layer glass-PDMS-glass sandwich structure was fabricated as described previously.16,26 Features on the fluidic and manifold glass wafer layers were isotropically etched to a depth of 50 μm. The etched fluidic and manifold layers were visually aligned and reversibly bonded to one another with an intervening optically transparent PDMS membrane (250 μm thick, Rogers Corporation, Carol Stream, IL). Visual alignment and reversible bonding was performed in a laminar flow hood to minimize particulate contamination of the clean glass wafers and PDMS membrane. Nylon tubing barbs (1/16″) were affixed to the fluidic chip surface at five pneumatic access holes to interface pneumatic control line tubing with the device. All reservoirs and vacuum access holes were drilled with 1.1-mm-diameter diamond-coated drill bits.
A schematic of the microfluidic serial dilution circuit is shown in Figure 1. Fluidic channels (black) are 300 μm wide, and valve deflection chambers (gray) are 1 mm in diameter. Both layers are 50 μm deep. All dimensions are after isotropic etching. Two-way valves A, B, and C control fluid flow in the loop. Bus valves I and O control fluidic access to the input and output reservoirs, Ri and Ro, respectively. The loop remains continuous when the bus valves are closed, but fluid flow from Ri and to Ro is prevented. The boxed inset to Figure 1 depicts the cross-sectional view of the glass-PDMS-glass sandwich structure.
Figure 1.
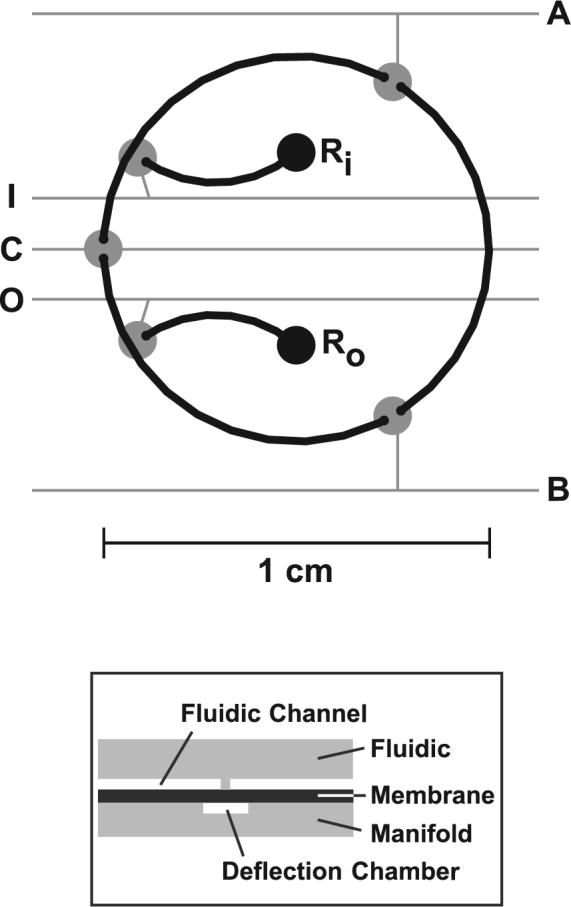
Schematic of the microfluidic serial dilution circuit. Fluidic channels are shown in black and pneumatic features are shown in gray. The input and output fluidic access reservoirs (1.1-mm diameter) are labeled Ri and Ro, respectively. The five membrane valve deflection chambers are labeled A, B, C, I, and O on their respective pneumatic lines. Valves A, B, and C are two-way valves and are continuous only when open. Input and output valves I and O are bus valves, connecting Ri and Ro to the mixing loop. When open, I and O allow flow from Ri and Ro to and from the mixing loop. Fluidic continuity is preserved within the mixing loop even when I and O are closed. The boxed diagram depicts a cross section of the device at a two-way valve junction, showing the fluidic and manifold wafers, the PDMS membrane, the fluidic channel and discontinuity, and the corresponding valve displacement chamber.
Pneumatic Control
Computer-controlled pneumatic actuation of the membrane valves was accomplished using a TTL-driven vacuum solenoid valve array (HV010, Humphrey, Kalamazoo, MI). On TTL low, the solenoid directs atmospheric pressure output, and the associated membrane valve rests in the closed state. On TTL high, the solenoid switches to vacuum and causes the associated membrane valve to deflect open. The solenoid array is driven by the digital output of a NI6715 data acquisition PCMCIA card and PC laptop with software written in house (LabVIEW, National Instruments, Austin, TX).
A sequence of valve states defines a pumping program. A variable hold step interposed between states in the sequence is the valve actuation time. Three pumping programs were written to manipulate fluid in the serial dilution circuit. The valve sequences of each pumping program are written showing only the open valves at each step, and the hold step is indicated by a comma after each state in the sequence. For example, the program (AB, B) starts with valves A and B open and valves C, I, and O closed. This state is followed by a hold step, then valve A is closed leaving only B open. The mix pumping program is the valve state sequence (A, AB, B, BC, C, AC). The flush pumping program is the valve state sequence (A, AB, B, BO, IO, IA). The prime pumping program is the valve state sequence (I, ACI, AC, ABCO, BO, O). Looping a pumping program results in continuous pumping.15,16 Each pumping program requires two input parameters for operation: the valve actuation time (in milliseconds) and the length of time the program is iterated (in seconds).
Fluidic manipulation protocols are described in the text using the format: program(valve actuation time,iteration time), with valve actuation times given in milliseconds and iteration times given in seconds. For example, mix(80,60) indicates that the mix program is run with 80 ms valve actuation time, iterated for 60 s.
Flow Visualization and Device Characterization
Flow in the channels was visualized using a solution of fluorescein dye (10 μM in TAE) and a fiber-coupled epifluorescence microscope (488-nm laser excitation), which has been described.8 Epifluorescence movies of the various pumping programs were acquired using a 12-bit CoolSnap FX CCD (10 fps, 50-ms exposure, 8 × 8 pixel binning, Roper Scientific, Tucson, AZ). The illumination area was ∼1.2 cm diameter and the power density was 1 mW/mm2.
Confocal fluorescence data were acquired using an inverted microscope fabricated in house. Laser excitation from a frequency-doubled diode laser was coupled into the optical detection train with a dichroic long-pass mirror (505DRLP, Omega Optical, Brattleboro, VT) and focused on the microfluidic channels with an infinite conjugate microscope objective (40× 0.6 NA, Newport, Irvine, CA). Fluorescence was collected with the same objective, spectrally filtered with a bandpass filter (535DF60, Omega Optical), and focused with a 100-mm focal length achromatic lens on a 100-μm pinhole before impinging a photon counting PMT (H7827, Hamamatsu Corp., Japan). For all confocal fluorescence measurements, the detector was positioned in the fluidic channel region bounded by valves A and B.
Fluid handling characteristics of the device were quantitated using confocal fluorescence microscopy. The input reservoir, Ri, was spotted with fluorescein solution and the circuit was run with prime(200,30) to prime with dye. A syringe loaded with TAE buffer (the diluent) was used to rinse away residual dye solution in Ri and to load diluent. This standard procedure was used to prepare the circuit for each of the following device characterization studies.
The intrinsic carryover fraction (CF) for each serial dilution circuit was determined. The average fluorescence signal of the concentrated dye was measured, then the circuit was run with flush(100,60), and the average buffer background fluorescence signal was measured. Finally, the circuit was run with mix(100,120) to mix the carryover into the diluent. After mixing, the average fluorescence signal of the diluted dye was measured. The ratio of the background-subtracted diluted dye signal to the dye concentrate signal is the CF. To demonstrate multiple serial dilutions of the same sample, a sample of 10 μM fluorescein was diluted in TAE using a mixing loop with CF of 0.2. To increase dynamic range, an OD 1 neutral density filter (Newport) was placed in line to measure the sample concentrate fluorescence intensity. Thereafter, the filter was removed and the fluorescence intensity of each consecutive dilution was measured as described above.
Fluidic handling reproducibility was evaluated by performing replicate dilutions. For each replicate, the circuit was prepared as described. Then the circuit was run with flush(100,90), followed by mix(100,120). Mixing was characterized by performing dilutions with variable valve actuation time during the mixing step. The circuit was primed as described, and mix(x,500) was initiated, where x was systematically varied from 300 ms to 50 ms.
RESULTS AND DISCUSSION
The serial dilution of an analyte can be automated and carried out on the nanoliter scale using an appropriately configured microfluidic mixing loop. In-line computer-controlled membrane valves allow precise fluidic manipulation, automation, and parallelization. Fluidic operations, such as diluent flushing, mixing, and priming can be accurately and precisely performed without manual intervention, and performed simultaneously in many parallel circuits. A quantitative description of device performance was developed using epifluorescence flow visualization and confocal fluorescence microscopy.
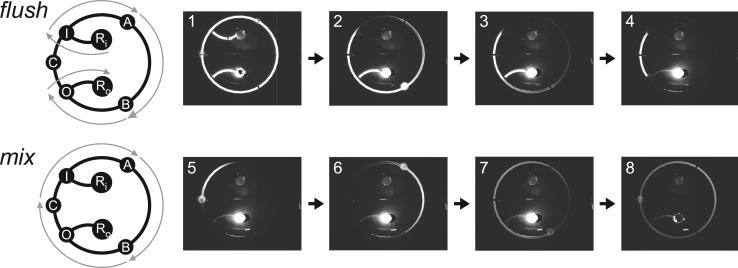
Epifluorescence visualization of the pumping programs flush and mix is presented in Figure 2. Diluent is pumped into the circuit through I, then through A and B, and finally out of the circuit through O. A plug of material in the region bounded by valves I and O and containing C is preserved by flush. Frames 1 through 4 show TAE buffer (diluent) being pumping from Ri to Ro around the right side of the fluorescein dye-primed circuit. A plug of fluorescein dye (carryover) is preserved on the left (frame 4). The carryover and diluent are mixed together in the mix operation by serially actuating valves A, B, and C while keeping valves I and O closed. Frames 5 through 8 show the carryover being mixed into the diluent as the fluid is cyclically pumped, and the fluorescence intensity in the loop homogenizes.
Figure 2.
Serial dilution circuit pumping program schematics and epifluorescence stills. Still frames are 50-ms exposures. The circuit is initially primed with fluorescein dye. Fluid flow paths are indicated with gray arrows overlaid on the circuit schematic. The flush program is used for diluent flushing and carryover isolation, and is accomplished by serially actuating I, A, B, and O while keeping C closed. Buffer is pumped from Ri to Ro, clearing the right side of the mixing loop while isolating the carryover aliquot on the left side (frames 1−4). An example of an open valve can be seen in frame 2, in which B is open and the entire valve is filled with the concentrated dye solution. The mix program is used to mix the diluent and the isolated carryover by serially actuating A, B, and C while I and O are kept closed (frames 5−8). The output reservoir, RO, was manually evacuated in the time between frame 7 and frame 8 for the purpose of visualizing the fully mixed sample. Full movies are included in the Supporting Information.
A flush operation coupled to a mix operation constitutes a microfluidic serial dilution. Sample in the loop can be serially diluted many times to bring about consecutive serial dilutions of the concentrated sample. This concept is presented in Figure 3A. The detector was positioned between valves A and B (Figure 3A, inset) to observe three consecutive serial dilutions of fluorescein dye concentrate (300 nM). As the dye is cyclically pumped, the concentrated dye signal is acquired. Next, flush(100,60) and mix(100,120) are run sequentially to perform the serial dilution. The measured fluorescence is reduced to background as the buffer diluent passes the detector during flush, then a mixing transient is observed during mix as the diluent and carryover mix. Once mixing is complete, the same program sequence is repeated to generate multiple serial dilutions (Figure 3A, inset).
Figure 3.
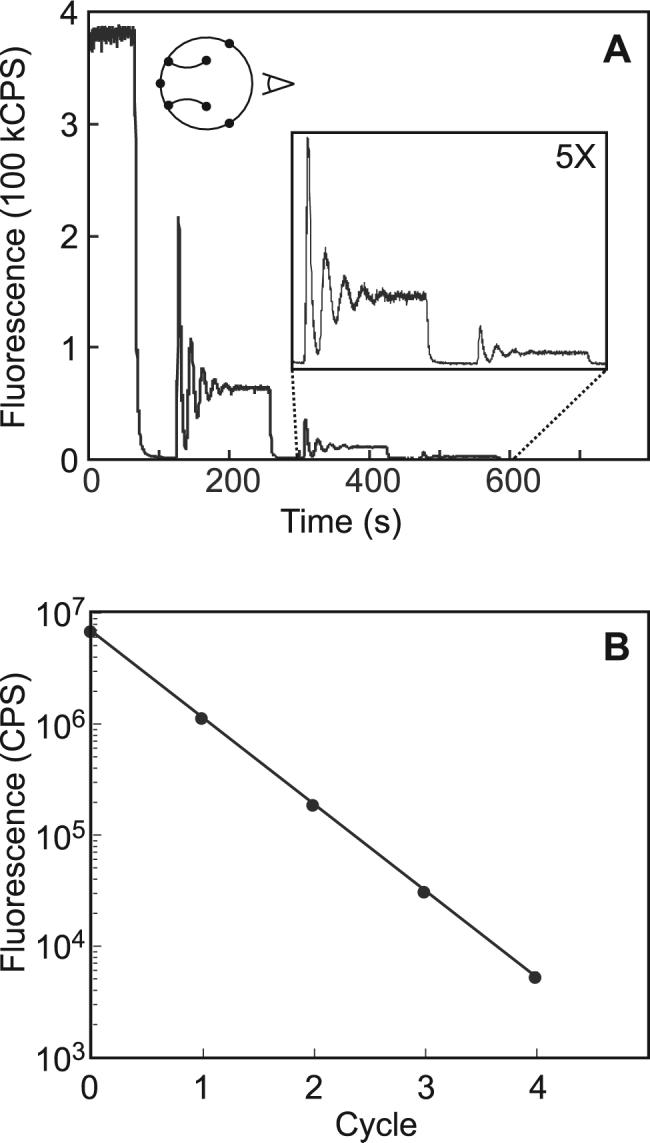
Quantitative evaluation of serial dilution. (A) Three consecutive serial dilutions of fluorescein dye solution (300 nM in TAE buffer) into TAE buffer were monitored using confocal fluorescence microscopy. The detector position is indicated in the inset circuit schematic. The second and third dilutions are shown in the five-fold magnified inset. Serial dilutions were performed by executing flush(100,60) followed by mix(100,120). (B) A standard curve for 10 μM fluorescein was constructed from the average fluorescence intensity of the sample concentrate, and the intensity obtained after each of four consecutive six-fold dilutions. Each data point represents the average of eight independent experiments. The log plot exhibits excellent linearity over the three detectable orders of magnitude (R2 = 0.999).
The construction of a complete series of standards based on a single 10 μM fluorescein standard solution is presented in Figure 3B. The log of the fluorescence intensity after each serial dilution was plotted as a function of the serial dilution cycle number, which is expected to be linear with slope proportional to the log of the carryover fraction (CF) of the circuit.
The intrinsic CF for a circuit is determined by the fraction of the mixing loop bounded by valves I and O containing valve C. This fraction linearly depends on the angle θ subtended by the arc between valves I and O (Figure 4, inset). The CF of circuits with various θ was measured and plotted as a function of θ (Figure 4). Linear agreement of CF with θ is excellent (R2 = 0.998). The error associated with each CF determination was 1.5%. During flush steps the carryover is still in contact with the flushing diluent stream, so carryover sample near the I and O valve boundaries may diffuse into the diluent stream. As the diluent flush time is increased, more sample diffuses out and the CF decreases. The dependence of CF on flush time was studied using fluorescein dye and buffer, and found to vary by 5% over the range of 30−300 s.
Figure 4.
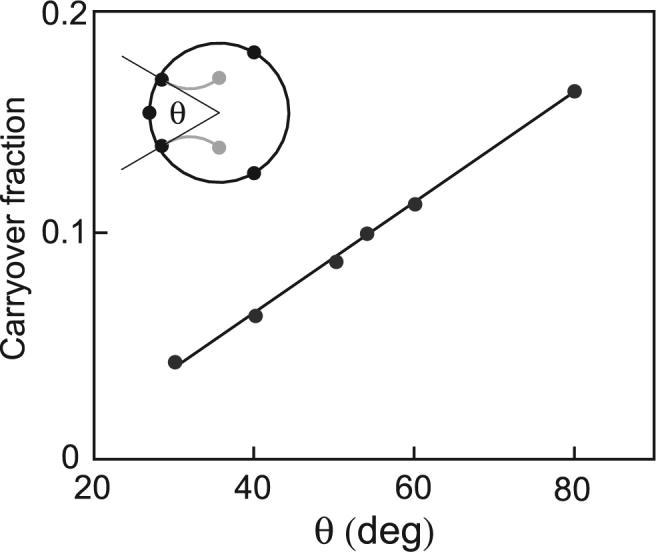
Dependence of carryover fraction on device geometry. The carryover fraction was related to the arc subtended by valves I and O. The inset indicates the angle measurement, θ. CF = −0.02 + 0.005 θ; R2 = 0.998.
Microfluidic devices are characterized by the reproducibility of operations such as mixing and dilution because the flow regime is laminar. This concept is illustrated in Figure 5. Replicate observations of a serial dilution conducted on two different devices demonstrate not only the reproducibility of dilutions performed in the same circuit, but also of dilutions performed on different devices. The inset of Figure 5 presents an overlay of the replicates. Given identical fluidic programming, the rate of diluent flushing and the oscillations in the mixing transient are reproduced exactly between replicates.
Figure 5.
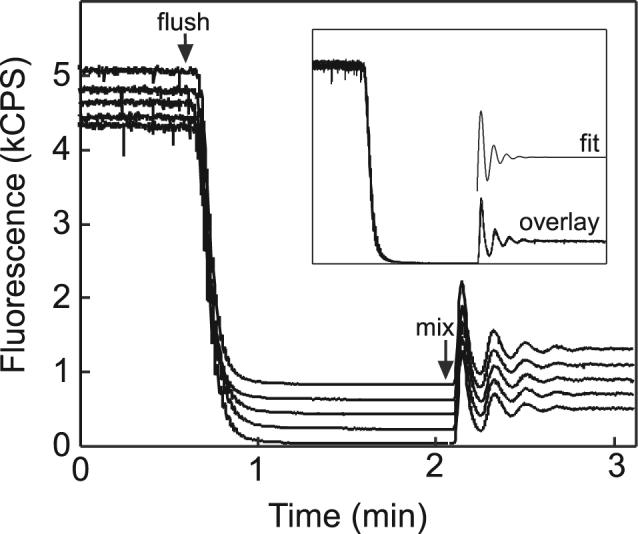
Mixing reproducibility. A solution of fluorescein dye was diluted using a circuit with a carryover fraction of 0.12. Two separate devices were operated with identical pumping parameters: flush(100,90), mix(100,120). The five profiles are offset by 200 CPS for clarity. The start of the flush and mix programs is indicated by arrows. The inset contains an overlay of the five replicates and a sample fit of an exponentially damped sinusoid. Diluent flushing and mixing are highly reproducible, with mixing transients agreeing in fit within 1%.
In order to study the reproducibility of the mixing transient quantitatively, a dampened sinusoid was fit to the data. The functional dependence of the damped sinusoid, Ae−kt sin(ωt) + b, contained least-squares fit parameters A, k, ω, and b, corresponding to the amplitude, damping factor, frequency, and offset after dilution, respectively. Typical R2 values ranged from 0.90 to 0.98. Parameter ω was fit with less than 0.3% least-squares error, and the frequency determined from fits of the five replicates agreed within 1%. A typical fit curve is shown in the Figure 5 inset, offset from the overlay. Values of R2 less than 0.95 are attributed to a relatively poor description of damping by the exponential term. Nonetheless, this procedure yielded excellent data on the transient frequency for the purpose of demonstrating the reproducibility of mixing.
The time required to mix the diluent plug into the carryover plug is influenced by the pumping rate, or valve actuation time, during cyclic mixing. Figure 6 presents the dependence of the mixing transient morphology on the valve actuation time. As the valve actuation time is decreased from 300 ms to 50 ms, the linear flow velocity increases, and the mixing transient is compressed in time. As the two plugs are pumped through each other, mixing is expedited by the establishment of more diffusion planes. The dependence of mixing time on valve actuation time can be determined qualitatively from Figure 6A. At 50 s, for example, the fluorescence intensity is still widely varying in the 300-ms case, while the signal has completely steadied in the 50-ms case.
Figure 6.
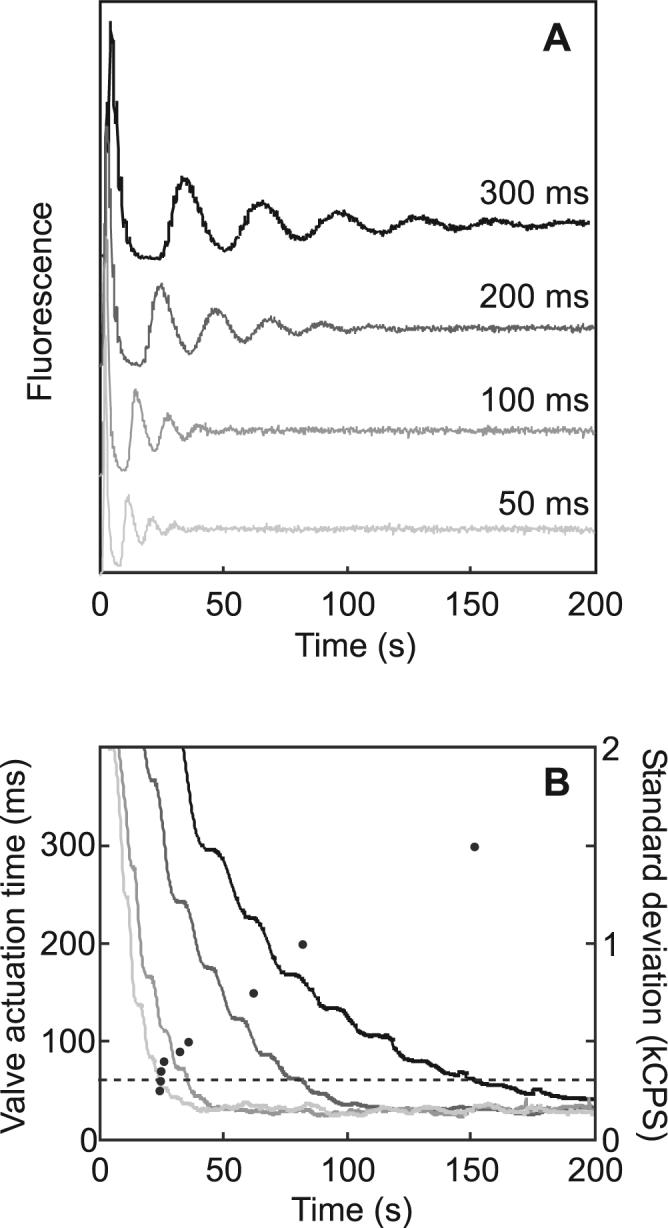
Mixing transients at variable valve actuation times. (A) Mixing transients were generated with variable actuation times and aligned to time t = 0. (B) Standard deviations as a function of time are plotted as solid lines, sampling valve actuation times of 300, 200, 100, and 50 ms. The standard deviation window width is the period of the oscillation for each transient. A dashed line at σwin = 300 CPS indicates the threshold for complete mixing. Mixing times (•) measured at different valve actuation times are plotted discretely with respect to the left axis. Mixing times determined by this method exhibited ∼5% standard error.
A quantitative study of mixing time is presented in Figure 6B. The standard deviation of an n-second-wide window, σwin, was plotted as a function of time to measure signal variance. The window width, n, was normalized by setting it equal to the transient period, 2π/ω, determined by fitting a damped sinusoid to each transient (described above). The deviation predictably drops as mixing proceeds. When the carryover and diluent are completely mixed, the standard deviation of the signal is limited by the shot noise of the detector, σbkgd. The mixing time is the time required for σwin to reach 2σbkgd. At this limit of detection, the observer is theoretically unable to differentiate between contributions to signal variance that arise systematically (as a result of incomplete mixing) versus those that arise randomly (as a result of shot noise).
An analysis of mixing time as a function of valve actuation time, plotted discretely in Figure 6B, reveals that mixing is expedited as valve actuation time is decreased from 300 ms to 80 ms. The time required for complete mixing is minimized from >150 s to 22 s over the range of actuation times studied. Further decreasing the valve actuation time from 80 ms to 50 ms did not significantly affect the mixing time. This agrees with measurements of linear flow rate as a function of valve actuation time; valve actuation appears to be limiting at valve actuation times shorter than 80 ms. The flow rate over the range of 80- to 50-ms valve actuation times gradually becomes independent of valve actuation time. Additionally, at higher flow velocities, transverse diffusion is limiting and the mixing time cannot be decreased absent a mechanism for establishing new boundary layers, for example by promoting torsional flow.27,28
Serial dilution is a common operation in chemical measurements. The construction of a series of standard samples can be time consuming and expensive, requiring many fluid metering steps and expending potentially valuable sample. The circuit described here carries out serial dilutions in 400 nL, though this is not a limit for circuit size. In practice this circuit could be scaled down or up depending on the desired sample volume. Design constraints would include the valve dead volume and carryover channel volume. This microfluidic circuit can generate an entire standard curve with only the diluent as an input. The standards are prepared in nanoliter quantities, conserving reagent and allowing facile integration with on-chip analytical techniques. For example, on-chip capillary electrophoresis or liquid chromatography could be coupled to the output of this circuit, relying on integrated pumping for standard injection.29 Importantly, this device can execute rapid and automated serial dilutions on the time scale of replication of a population of evolving RNA molecules, opening new avenues of inquiry in molecular evolution.
CONCLUSIONS
A microfluidic serial dilution circuit was developed that can perform multiple serial dilutions, with greatly increased speed and precision compared to manual pipeting. Based on alterations of the circuit geometry, carryover fractions of 0.04−0.2 were demonstrated. The circuit requires only 400 nL of starting material to perform an arbitrary number of serial dilutions in a manner that can be integrated with other on-chip preparative or analytical steps. This circuit was developed to enable the automated serial dilution of a population of evolving RNA molecules, but is more generally applicable to almost any microfluidic architecture that involves serial dilution coupled to chemical synthesis or analysis.
Supplementary Material
ACKNOWLEDGEMENTS
The authors thank Stan Block and Chris Fish in the Scripps Instrumentation and Design Shop for fabrication of parts for the inverted confocal fluorescence microscope. Microdevice fabrication was performed at the University of California Berkeley Microfabrication Laboratory. This research was supported by NSF grant no. MCB-0614614, The Skaggs Institute for Chemical Biology, and a fellowship to B.M.P. from the NIH NRSA program (1F32GM073438).
REFERENCES
- 1.Mills DR, Peterson RL, Spiegelman S. Proc. Natl. Acad. Sci. USA. 1967;58:217–223. doi: 10.1073/pnas.58.1.217. [DOI] [PMC free article] [PubMed] [Google Scholar]
- 2.Biebricher CK, Eigen M, Gardiner WC. Biochemistry. 1985;24:6550–6560. doi: 10.1021/bi00344a037. [DOI] [PubMed] [Google Scholar]
- 3.Wright MC, Joyce GF. Science. 1997;276:614–617. doi: 10.1126/science.276.5312.614. [DOI] [PubMed] [Google Scholar]
- 4.Harrison DJ, Fluri K, Seiler K, Fan ZH, Effenhauser CS, Manz A. Science. 1993;261:895–897. doi: 10.1126/science.261.5123.895. [DOI] [PubMed] [Google Scholar]
- 5.Woolley AT, Mathies RA. Proc. Natl. Acad. Sci. USA. 1994;91:11348–11352. doi: 10.1073/pnas.91.24.11348. [DOI] [PMC free article] [PubMed] [Google Scholar]
- 6.Emrich CA, Tian HJ, Medintz IL, Mathies RA. Anal. Chem. 2002;74:5076–5083. doi: 10.1021/ac020236g. [DOI] [PubMed] [Google Scholar]
- 7.Aborn JH, El-Difrawy SA, Novotny M, Gismondi EA, Lam R, Matsudaira P, McKenna BK, O'Neil T, Streechon P, Ehrlich DJ. Lab Chip. 2005;5:669–674. doi: 10.1039/b501104c. [DOI] [PubMed] [Google Scholar]
- 8.Paegel BM, Yeung SHI, Mathies RA. Anal. Chem. 2002;74:5092–5098. doi: 10.1021/ac0203645. [DOI] [PubMed] [Google Scholar]
- 9.Burns MA, Johnson BN, Brahmasandra SN, Handique K, Webster JR, Krishnan M, Sammarco TS, Man PM, Jones D, Heldsinger D, Mastrangelo CH, Burke DT. Science. 1998;282:484–487. doi: 10.1126/science.282.5388.484. [DOI] [PubMed] [Google Scholar]
- 10.Lagally ET, Emrich CA, Mathies RA. Lab Chip. 2001;1:102–107. doi: 10.1039/b109031n. [DOI] [PubMed] [Google Scholar]
- 11.Jacobson SC, Hergenroder R, Koutny LB, Warmack RJ, Ramsey JM. Anal. Chem. 1994;66:1107–1113. [Google Scholar]
- 12.Burggraf N, Manz A, Verpoorte E, Effenhauser CS, Widmer HM, Derooij NF. Sens. Actuators, B. 1994;20:103–110. [Google Scholar]
- 13.Jacobson SC, Ermakov SV, Ramsey JM. Anal. Chem. 1999;71:3273–3276. doi: 10.1021/ac990059s. [DOI] [PubMed] [Google Scholar]
- 14.Chen J, Wabuyele M, Chen H, Patterson D, Hupert M, Shadpour H, Nikitopoulos D, Soper SA. Anal. Chem. 2005;77:658–666. doi: 10.1021/ac048758e. [DOI] [PubMed] [Google Scholar]
- 15.Unger MA, Chou HP, Thorsen T, Scherer A, Quake SR. Science. 2000;288:113–116. doi: 10.1126/science.288.5463.113. [DOI] [PubMed] [Google Scholar]
- 16.Grover WH, Skelley AM, Liu CN, Lagally ET, Mathies RA. Sens. Actuators, B. 2003;89:315–323. [Google Scholar]
- 17.Squires TM, Quake SR. Rev. Mod. Phys. 2005;77:977–1026. [Google Scholar]
- 18.Hansen CL, Skordalakes E, Berger JM, Quake SR. Proc. Natl. Acad. Sci. USA. 2002;99:16531–16536. doi: 10.1073/pnas.262485199. [DOI] [PMC free article] [PubMed] [Google Scholar]
- 19.Song H, Ismagilov RF. J. Am. Chem. Soc. 2003;125:14613–14619. doi: 10.1021/ja0354566. [DOI] [PMC free article] [PubMed] [Google Scholar]
- 20.Jacobson SC, McKnight TE, Ramsey JM. Anal. Chem. 1999;71:4455–4459. [Google Scholar]
- 21.Chang JK, Heo YS, Bang H, Cho K, Chung S, Chung C, Han DC. Biotechnol. Bioprocess Eng. 2003;8:233–239. [Google Scholar]
- 22.Holden MA, Kumar S, Castellana ET, Beskok A, Cremer PS. Sens. Actuators, B. 2003;92:199–207. [Google Scholar]
- 23.Koehler J, Vajjhala S, Coyne C, Flynn T, Pezzuto M, Williams M, Levine L. Assay Drug Dev. Technol. 2002;1:91–96. doi: 10.1089/154065802761001347. [DOI] [PubMed] [Google Scholar]
- 24.Chou HP, Unger MA, Quake SR. Biomed. Microdevices. 2001;3:323–330. [Google Scholar]
- 25.Liu J, Enzelberger M, Quake S. Electrophoresis. 2002;23:1531–1536. doi: 10.1002/1522-2683(200205)23:10<1531::AID-ELPS1531>3.0.CO;2-D. [DOI] [PubMed] [Google Scholar]
- 26.Simpson PC, Roach D, Woolley AT, Thorsen T, Johnston R, Sensabaugh GF, Mathies RA. Proc. Natl. Acad. Sci. USA. 1998;95:2256–2261. doi: 10.1073/pnas.95.5.2256. [DOI] [PMC free article] [PubMed] [Google Scholar]
- 27.Johnson TJ, Ross D, Locascio LE. Anal. Chem. 2002;74:45–51. doi: 10.1021/ac010895d. [DOI] [PubMed] [Google Scholar]
- 28.Stroock AD, Dertinger SKW, Ajdari A, Mezic I, Stone HA, Whitesides GM. Science. 2002;295:647–651. doi: 10.1126/science.1066238. [DOI] [PubMed] [Google Scholar]
- 29.Karlinsey JM, Monahan J, Marchiarullo DJ, Ferrance JP, Landers JP. Anal. Chem. 2005;77:3637–3643. doi: 10.1021/ac048115z. [DOI] [PubMed] [Google Scholar]
Associated Data
This section collects any data citations, data availability statements, or supplementary materials included in this article.


