

Abstract
The inferior colliculus (IC) receives its major ascending input from the cochlear nuclei, the superior olivary complex and the nuclei of the lateral lemniscus. In order to better understand the terminal distribution of the inputs from these sources relative to one another, we made focal injections of a retrograde tracer, biotinylated dextran amine, in different parts of the IC in 74 gerbils (Meriones unguiculatus). Based on counts of labeled cells in brainstem auditory nuclei, the cases could be divided into three groups. Group 1 cases had labeled cells in both the cochlear nuclei and in the lateral and medial superior olivary nuclei. Group 2 cases had labeled cells in the cochlear nuclei but few or none in the lateral and medial superior olivary nuclei. Both groups had labeled cells in the nuclei of the lateral lemniscus and the superior paraolivary nucleus. Group 3 cases had few labeled cells in any of the ascending auditory pathways. The group to which a case belonged was strongly related to the location of the injection site in the IC. The injection sites for both Groups 1 and 2 were located in the central nucleus, but those for Group 1 tended to be located laterally relative to those for Group 2, which were located more medially and caudally. The injection sites for Group 3 cases lay outside the central nucleus of the IC. The two regions of the central nucleus of the IC, distinguished on the basis of connectivity, are likely to subserve different functions.
Keywords: auditory system, biotinylated dextran amine, cytochrome oxidase, neuroanatomy, nuclei of the lateral lemniscus
INTRODUCTION
The inferior colliculus (IC) is the site of convergence of input from almost all auditory areas in the brainstem and forebrain as well as from some non-auditory areas (Adams, 1979, 1980; see reviews in Winer and Schreiner, 2005). The IC itself contains a number of morphologically different neuronal classes (Morest and Oliver, 1984; Oliver, 1984a; González-Hernández et al., 1989; Peruzzi et al., 1997, 2000; Oliver et al., 1991, 1994; Malmierca et al., 1993) and an extensive network of intrinsic and commissural interconnections (e.g., Saldaña and Merchán, 2005). Anatomical complexity of the IC is matched by physiological complexity. Diverse unit types have been classified on the basis of differences in biophysical properties, binaural response properties, frequency/intensity response profiles, responses to complex stimuli, and poststimulus activity patterns (e.g, Semple and Aitkin, 1979; Schreiner and Langner, 1988; Brückner and Rübsamen, 1995; Ramachandran et al., 1999; Ramachandran and May, 2002; Peruzzi et al. 2000; Sivaramakrishnan and Oliver, 2001; Davis, 2002; Hernández et al., 2005). From the point of view of relating physiological response properties to neuroanatomical organization, it is important to understand how the differences in extent of the terminal arborizations from each source of input are related to the three-dimensional organization of the IC and its well-known topographic organization with respect to frequency. The extent to which axons from any of the sources of input to the IC form synaptic connections with specific neuronal types will determine their role in shaping the response properties of those types.
In our laboratory, we have been investigating the neuroanatomical organization of the IC of the Mongolian gerbil (Meriones unguiculatus). The gerbil is widely used in auditory studies, in large part because, although it is a small mammal, it has well-developed low frequency hearing (Lay, 1972; Ryan, 1976; Ryan et al., 1982), making it more similar to carnivores and primates than are rats and mice (cf. Heffner et al., 2001, their Figure 6). Previous neuroanatomical tracing studies in other species have demonstrated that the terminal fields of axons arising in the cochlear nucleus, superior olivary complex and nuclei of the lateral lemniscus are not distributed uniformly throughout the IC and that the terminal zones of the major inputs do not overlap completely (Roth et al., 1978; Brunso-Bechtold et al., 1981; Kudo, 1981; Aitkin and Schuck, 1985; Coleman and Clerici, 1987; Maffi and Aitkin, 1987; Shneiderman and Henkel, 1987; Kelly et al., 1988; Ross and Pollak, 1989; Oliver et al., 1997; Frisina et al., 1998; Gabriele et al., 2000; Loftus et al., 2004). The auditory pathways in the gerbil appear grossly similar to those described in other species (Nordeen et al. 1983; Moore and Kitzes, 1985; Budinger et al. 2000a,b; Bajo and Moore, 2005), but the organization of the terminations from the cochlear nucleus, superior olivary complex and other ascending sources within the IC has not been described in any detail. In this paper, we report the results of a retrograde tracing study in which injections of a tracer were restricted to small regions throughout the IC in order to establish the extent of the terminations from the major brainstem auditory nuclei.
Figure 6.

CO-reacted parasagittal sections through the right IC (atlas sections from Cant and Benson, 2005). Description as for Figure 7 except that on each panel all of the cases localized both to the section shown (number at top of panel) and also to the two atlas sections medial to it are illustrated. Scale bar = 1.0 mm for all panels.
MATERIALS AND METHODS
Brains from 74 female gerbils were used for this study. The gerbils were obtained from Charles River Laboratories at approximately 8 weeks of age and housed until use in Duke University animal quarters. Age at the time of the experiment ranged from 8 to 17 weeks (average, 11 weeks). All procedures using animals were approved by the Duke University Institutional Animal Care and Use Committee and were in accordance with NIH guidelines.
Experimental procedures
Anesthesia and perfusions
For the procedures described below, animals were anesthetized with Nembutal administered intraperitoneally (50−70 mg/kg). When the animals lost withdrawal reflexes, surgical procedures were performed. After an appropriate survival period, the animals were again anesthetized with Nembutal (> 70 mg/kg). When they were completely areflexic and just as breathing ceased, they were perfused intravascularly with 0.1M phosphate buffer (pH 7.4) followed by buffered 4% paraformaldehyde. The next day, the brain was removed from the skull and kept overnight in a buffered 30% sucrose solution. Frozen sections 40 μm thick were cut in the transverse or horizontal plane on a sliding microtome and collected as two sets of sections in serial order.
Biotinylated dextran amine (BDA) injections
In each of the gerbils, an incision was made in the skin over the occipital bone. A small hole (about 2 mm in diameter) was made in the bone, and a glass pipette with a tip diameter of approximately 15 μm was lowered through the occipital cortex and (usually) the superior colliculus into the inferior colliculus. A solution of 10% BDA (10,000 MW, Vector Laboratories) in saline was injected iontophoretically; a current of 4−5 μA was pulsed (7 sec on/7 sec off) for 10−20 minutes. In three of the cases, two or three separate injections were made close to one another (Table 1, single asterisks). After a survival time usually ranging from 5 to 11 days, animals were perfused as noted above. (Three animals – case numbers 319, 324 and 325 – survived for only 3 days.) One series of alternate sections was reacted for the presence of BDA. The sections were rinsed for 5 minutes in 0.5% triton-X 100 (triton) in 0.1M phosphate buffer and then incubated in an avidin-biotin solution (1:100 dilution) in 0.5% triton and 0.1M phosphate buffer (Vector ABC Standard Elite Kit; the biotin is tagged with horseradish peroxidase) for one hour with agitation. The sections were rinsed three times in phosphate buffer and then reacted in 0.05% diaminobenzidine in phosphate buffer containing 0.002% hydrogen peroxide, 0.025% nickel ammonium sulfate and 0.025% cobalt chloride to visualize the horseradish peroxidase tag (based on Adams, 1981). Each section was mounted on a slide next to an adjacent cytochrome-oxidase reacted section (see below). The sections were allowed to dry overnight and were then dehydrated in a series of alcohols, cleared in xylene, and coverslipped under Permount. (For cases 319 through 391, every section was reacted for BDA.)
Table 1.
Results of cell counts in the auditory brainstem nuclei and auditory cortex1
| GERBILS | CELL COUNTS5 |
||||||||||||||||||
|---|---|---|---|---|---|---|---|---|---|---|---|---|---|---|---|---|---|---|---|
| Cochlear Nuclei |
LSO + MSO |
SPN + nLL |
AC | ||||||||||||||||
| Case#1 | Group2 Freq.3 | Total Asc.4 | DCNi | DCNc | AVi | AVc | PVi | PVc | ILSOi | ILSOc | mLSOi | mLSOc | MSOi | SPNi | VNi | DNi | DNc | ||
| 99−319 | 2 | M | 883 | 27 | 154 | 2 | 161 | 4 | 62 | 1 | - | 1 | - | 3 | 58 | 322 | 40 | 45 | X |
| 99−320 | 3 | 33 | - | - | - | - | - | 1 | - | - | - | - | - | 11 | 16 | 5 | - | X | |
| 99−324 | 2 | M | 342 | 11 | 63 | 3 | 79 | 1 | 52 | - | - | - | - | - | 21 | 85 | 7 | 20 | X |
| 99−325 | 2 | M | 379 | 6 | 52 | - | 115 | - | 39 | - | - | - | - | 2 | 18 | 127 | 8 | 12 | X |
| 99−328 | 3 | 159 | 2 | 9 | - | 8 | - | - | 3 | 3 | - | - | 1 | 20 | 55 | 12 | 46 | X | |
| 99−360 | 2 | M | 109 | 2 | 15 | - | 3 | 1 | 12 | - | - | - | - | 1 | 6 | 43 | 9 | 17 | 160 |
| 99−361 | 2 | M | 353 | 1 | 32 | - | 11 | 2 | 22 | 2 | - | 1 | - | 2 | 60 | 168 | 14 | 38 | 645 |
| 99−362 | 2 | M | 64 | 2 | 6 | 1 | 1 | 1 | 6 | - | - | - | - | - | 17 | 26 | 1 | 3 | 421 |
| 99−363 | 1 | LM | 1550 | 57 | 141 | 21 | 331 | 5 | 89 | 50 | 89 | - | 2 | 175 | 51 | 337 | 62 | 140 | X |
| 99−364 | 3 | 73 | - | 4 | - | - | - | - | - | - | - | - | - | 11 | 53 | 3 | 2 | X | |
| 99−370 | 3 | 196 | 4 | 13 | 1 | 6 | - | 4 | - | - | - | 1 | - | 29 | 99 | 23 | 16 | X | |
| 99−371 | 2 | M | 594 | 11 | 104 | 6 | 148 | - | 80 | - | 4 | - | - | 2 | 37 | 150 | 23 | 29 | X |
| 99−388 | 3 | 30 | - | 2 | - | - | - | 2 | - | - | - | - | - | 5 | 15 | 5 | 1 | X | |
| 99−389 | 2 | H | 556 | 3 | 72 | 1 | 60 | - | 13 | 1 | - | 2 | 12 | 2 | 56 | 290 | 25 | 19 | X |
| 99−390 | 3 | 130 | - | 10 | - | - | - | 2 | - | - | - | - | - | 27 | 84 | 2 | 5 | X | |
| 99−391 | 2 | MH | 311 | 5 | 78 | - | 35 | 2 | 43 | - | - | - | - | 2 | 26 | 109 | 3 | 8 | X |
| 00−403 | 3 | 27 | - | 1 | - | - | - | - | - | - | - | - | - | 6 | 13 | 7 | - | 80 | |
| 00−407 | 3 | 78 | 1 | - | 1 | 2 | - | 1 | - | - | - | - | - | 11 | 51 | 5 | 6 | 322 | |
| 00−408 | 2 | MH | 258 | 2 | 34 | - | 41 | - | 4 | - | - | 1 | - | 1 | 27 | 124 | 15 | 9 | 88 |
| 00−409** | 1 | MH | 2381 | 78 | 339 | 22 | 458 | 14 | 194 | 15 | 7 | 10 | 102 | 92 | 100 | 669 | 72 | 209 | 317 |
| 00−411 | 2 | M | 696 | 20 | 130 | 2 | 198 | - | 71 | - | - | 5 | 3 | 6 | 24 | 181 | 13 | 43 | 19 |
| 00−412 | 2 | M | 486 | 13 | 94 | - | 99 | - | 35 | - | - | 4 | - | 4 | 29 | 134 | 32 | 42 | 26 |
| 00−413 | 1 | L | 499 | - | 29 | - | 47 | 2 | 29 | 17 | 44 | 1 | - | 73 | 16 | 123 | 34 | 84 | 85 |
| 00−414 | 2 | M | 423 | 19 | 87 | 4 | 91 | 7 | 48 | - | - | - | 2 | 3 | 10 | 127 | 5 | 20 | 13 |
| 00−416 | 3 | 45 | - | - | - | - | - | - | - | - | - | - | - | 5 | 36 | 4 | - | 291 | |
| 00−417 | 2 | M | 466 | 7 | 57 | 2 | 16 | - | 25 | 1 | - | 2 | 5 | 2 | 32 | 242 | 23 | 52 | 106 |
| 00−419 | 1 | L | 1858 | 29 | 120 | 18 | 238 | 10 | 122 | 122 | 268 | - | - | 333 | 44 | 337 | 65 | 152 | 90 |
| 00−420 | 1 | LM | 1255 | 19 | 65 | 9 | 112 | 3 | 77 | 109 | 97 | 14 | 5 | 184 | 43 | 324 | 87 | 107 | 93 |
| 00−421 | 3 | 145 | 1 | - | 1 | 1 | - | - | - | - | - | - | - | 17 | 93 | 17 | 15 | 510 | |
| 00−425 | 1 | L | 1182 | 29 | 67 | 52 | 186 | 31 | 49 | 207 | 70 | - | - | 231 | 32 | 136 | 47 | 45 | 37 |
| 00−426 | 3 | 121 | 1 | 7 | - | - | 1 | 1 | 2 | 3 | - | - | 1 | 12 | 41 | 33 | 19 | 166 | |
| 00−427 | 1 | L | 1652 | 19 | 67 | X | 205 | X | 94 | 186 | 190 | - | - | 301 | 29 | 360 | 100 | 101 | 57 |
| 00−428 | 3 | 105 | - | 5 | - | - | - | - | - | - | - | - | 1 | 8 | 53 | 23 | 15 | 244 | |
| 00−429 | 3 | 395 | 5 | 23 | - | 11 | 1 | 5 | 2 | 2 | 3 | - | 11 | 27 | 177 | 53 | 75 | 152 | |
| 00−430 | 1 | L | 1300 | 17 | 58 | 75 | 180 | 39 | 62 | 265 | 102 | - | - | 136 | 15 | 126 | 169 | 56 | 67 |
| 00−431 | 2 | MH | 733 | 5 | 115 | - | 225 | 1 | 40 | - | - | 1 | 21 | 2 | 27 | 273 | 9 | 14 | 105 |
| 00−432 | 2 | H | 731 | 6 | 75 | 1 | 24 | 1 | 5 | 9 | - | 1 | - | 1 | 67 | 491 | 26 | 24 | 577 |
| 00−437 | 3 | 15 | - | - | - | - | - | - | - | - | - | - | - | - | 11 | 2 | 2 | 89 | |
| 00−439 | 3 | 6 | - | - | - | - | - | - | - | - | - | - | - | - | 6 | - | - | 12 | |
| 00−440 | 2 | H | 446 | 5 | 98 | - | 100 | - | 18 | - | - | 8 | 2 | - | 43 | 160 | 6 | 6 | 24 |
| 00−441** | 2 | H | 2080 | 18 | 348 | 9 | 527 | 2 | 101 | 5 | - | 21 | 32 | 2 | 192 | 681 | 54 | 88 | 442 |
| 00−442 | 2 | H | 769 | 6 | 70 | 3 | 18 | 4 | 34 | 6 | - | 10 | 1 | - | 90 | 451 | 43 | 33 | 197 |
| 00−443 | 1 | MH | 458 | - | 35 | 2 | 39 | - | 9 | 5 | 5 | 8 | 19 | 21 | 38 | 225 | 30 | 22 | 92 |
| 00−444 | 1 | MH | 1325 | 29 | 168 | 6 | 159 | 4 | 112 | 14 | 29 | 44 | 65 | 82 | 106 | 415 | 46 | 46 | 81 |
| 00−445 | 3 | 101 | 1 | 4 | - | 1 | - | - | 1 | - | 1 | - | - | 10 | 53 | 22 | 8 | 110 | |
| 01−446 | 2 | M | 612 | 8 | 53 | 4 | 65 | - | 33 | 1 | - | 4 | 1 | 6 | 53 | 341 | 18 | 25 | 322 |
| 01−448 | 2 | H | 175 | - | 36 | - | 25 | - | 10 | - | - | - | - | - | 25 | 79 | - | - | 42 |
| 01−449 | 2 | H | 409 | 5 | 90 | 2 | 75 | 1 | 36 | - | - | 3 | - | - | 39 | 145 | 8 | 5 | 62 |
| 01−450** | 1 | H | 2213 | 18 | 163 | 13 | 514 | 1 | 60 | 1 | 2 | 104 | 206 | 15 | 110 | 830 | 105 | 71 | 60 |
| 01−452 | 2 | MH | 762 | 20 | 180 | 4 | 190 | 4 | 48 | - | 1 | 2 | 1 | 13 | 49 | 165 | 17 | 68 | 113 |
| 01−453* | 2 | MH | 585 | 14 | 128 | 7 | 105 | 6 | 39 | - | - | - | - | 3 | 38 | 206 | 21 | 18 | 321 |
| 01−454* | 2 | H | 1691 | 9 | 255 | 5 | 409 | 2 | 60 | - | 1 | 5 | 24 | - | 130 | 666 | 75 | 50 | 701 |
| 01−455* | 1 | H | 1285 | 8 | 97 | 8 | 201 | - | 80 | 2 | - | 71 | 120 | 2 | 83 | 521 | 45 | 47 | 103 |
| 01−460** | 1 | M | 607 | 5 | 90 | 3 | 60 | 6 | 52 | 3 | 5 | 11 | 4 | 13 | 43 | 225 | 30 | 57 | 84 |
| 01−461 | 1 | L | 511 | 3 | 37 | 3 | 28 | 12 | 16 | 15 | 7 | 1 | - | 19 | 38 | 222 | 60 | 50 | 289 |
| 01−462** | 1 | L | 2332 | 84 | 187 | 49 | 385 | 31 | 178 | 126 | 149 | - | 1 | 366 | 49 | 414 | 152 | 161 | 73 |
| 01−468 | 1 | L | 151 | 3 | 24 | - | 18 | - | 19 | - | 2 | - | - | 10 | 6 | 35 | 5 | 29 | 9 |
| 01−469** | 1 | LM | 3075 | 84 | 309 | 51 | 694 | 30 | 208 | 172 | 104 | 2 | - | 499 | 57 | 528 | 113 | 224 | 90 |
| 01−475 | 1 | L | 683 | 14 | 40 | 16 | 28 | 15 | 18 | 54 | 28 | 1 | - | 109 | 19 | 231 | 52 | 58 | 406 |
| 01−476 | 2 | L | 172 | 3 | 19 | 2 | 2 | 5 | 2 | - | 1 | - | 1 | - | 9 | 71 | 38 | 19 | 308 |
| 01−489 | 3 | 17 | - | 1 | - | 1 | - | - | - | - | - | - | - | 2 | 7 | 6 | - | 87 | |
| 01−490 | 1 | L | 403 | 13 | 51 | 7 | 36 | 10 | 34 | 10 | 4 | - | - | 27 | 23 | 98 | 20 | 70 | 54 |
| 01−509 | 1 | L | 224 | 1 | 14 | 4 | 21 | 6 | 14 | 14 | 51 | - | - | 47 | 7 | 23 | 9 | 13 | 54 |
| 01−510 | 1 | L | 351 | 10 | 49 | 10 | 52 | 10 | 31 | 8 | - | 1 | - | 73 | 13 | 68 | 3 | 23 | 35 |
| 01−511 | 1 | L | 71 | - | - | - | 23 | - | 5 | 9 | 7 | - | - | 4 | 1 | 3 | 5 | 14 | - |
| 01−528 | 1 | L | 652 | 37 | 49 | 47 | 138 | 25 | 61 | 26 | 5 | - | - | 108 | 14 | 90 | 13 | 39 | 80 |
| 01−529** | 1 | L | 558 | 14 | 73 | 10 | 79 | 10 | 84 | 3 | 1 | - | - | 54 | 20 | 111 | 14 | 85 | 169 |
| 02−545 | 1 | H | 902 | 8 | 53 | 6 | 114 | 1 | 35 | 5 | 1 | 171 | 98 | 6 | 25 | 354 | 9 | 16 | 2 |
| 02−551 | 1 | H | 967 | 10 | 181 | 1 | 271 | - | 20 | 1 | - | 13 | 58 | - | 56 | 262 | 17 | 77 | - |
| 02−552 | 1 | H | 1107 | 2 | 84 | 1 | 79 | 2 | 103 | 4 | - | 31 | 83 | - | 73 | 495 | 43 | 107 | 4 |
| 02−568 | 1 | L | 613 | 16 | 73 | 12 | 141 | 8 | 57 | 2 | 2 | - | - | 65 | 22 | 147 | 11 | 57 | 4 |
| 02−596 | 2 | L | 276 | 8 | 57 | - | 16 | 5 | 14 | 2 | 1 | - | - | - | 17 | 105 | 15 | 36 | 83 |
| 02−597 | 2 | M | 312 | 1 | 35 | - | 7 | - | 10 | 1 | - | 2 | - | - | 33 | 189 | 13 | 21 | 157 |
| 02−598 | 2 | M | 119 | 1 | 8 | 2 | 7 | - | 3 | 3 | - | - | - | 2 | 8 | 61 | 19 | 5 | 51 |
Cases are listed in chronological order; the year in which the experiment was performed is indicated by the prefix of the case number. The prefix is removed from the number in the text.
Group: Each case was assigned to one of three groups, as described in the text.
Freq.: Each case in Groups 1 and 2 was assigned to a putative frequency range, as described in the text. L, low frequency; L + M, low and middle frequencies; M, middle frequency; M + H, middle and high frequencies; H, high frequency.
Total asc., indicates the total number of labeled cells in all sources of ascending input; the number of cells in the auditory cortex is not included in this number.
Cells were counted in alternate sections as described in the Methods.
Abbreviations for this table only: DCNi, ipsilateral dorsal cochlear nucleus; DCNc, contralateral dorsal cochlear nucleus; AVi, ipsilateral anteroventral cochlear nucleus; AVc, contralateral anteroventral cochlear nucleus; PVi, ipsilateral posteroventral cochlear nucleus; PVc, contralateral posteroventral cochlear nucleus; LSO, lateral superior olivary nucleus; MSO, medial superior olivary nucleus; SPN, superior paraolivary nucleus; nLL, nuclei of the lateral lemniscus; lLSOi, lateral limb of the ipsilateral LSO; lLSOc, lateral limb of the contralateral LSO; mLSOi, medial limb of the ipsilateral LSO; mLSOc, medial limb of the contralateral LSO; MSOi, ipsilateral MSO; SPNi, ipsilateral SPN; VNi, ipsilateral ventral nucleus of the lateral lemniscus; DNi, ipsilateral dorsal nucleus of the lateral lemniscus; DNc, contralateral dorsal nucleus of the lateral lemniscus; AC, auditory cortex. X indicates material was not saved or was lost. Dash indicates the absence of labeled cells in the indicated nucleus.
cases in which multiple injections were made (see text)
cases in which the injection sites appeared to extend along the pipette track (see text).
Cytochrome oxidase (CO) histochemistry
In all but the first 16 cases in the series (Table 1), cytochrome oxidase histochemistry was performed on one series of alternate sections. On the day that they were cut, the sections were rinsed in phosphate buffer and incubated in the following solution at room temperature with agitation: 50 mg diaminobenzidine (DAB) in 75 ml distilled water, 25 ml 0.4M phosphate buffer (added after the DAB dissolved), 25 mg cytochrome C from horse heart (Sigma #C7752); 4 gm sucrose (based on Wong-Riley, 1979). Incubation time under these conditions was usually about four hours but could range from 2 hours to more than six hours. Sections were checked periodically; when the white and gray matter in the brainstem were judged to be well-differentiated, the sections were rinsed in buffer and mounted on glass slides next to an adjacent section that had been reacted for the presence of BDA.
Data analysis
Microscopy and photography
Sections were analyzed on Zeiss AxioSkop 2 compound microscopes equipped with either plan-neofluar or plan-apochromat objectives. Digital images were acquired with a Zeiss AxioCam HRc camera attached to the microscope and driven by Zeiss AxioVision software. After they were obtained, images were imported into Adobe Photoshop CS running on Apple Macintosh G5 computers, where all additional manipulations were carried out. Selection tools in Photoshop were used to illustrate differences in staining intensity in various parts of the IC; the use of such tools is described in the appropriate figure legends. Unless otherwise specified (and with the exception of obvious symbols and labels), no manipulations were performed that affected subsets of pixels in the images.
Characterization of injection sites
We identified the center of the injection sites on the CO-reacted sections as described in detail in the Results section and did not attempt to estimate the precise boundaries of the effective area of uptake of the tracer. (See Warr et al., 1981, for a discussion of the problems inherent in identifying the area of tracer uptake in histological material.) In cases 319 through 391, no sections were reacted for CO, and the location of the center of each injection site was estimated based on the location of the densest deposit of label in the BDA-reacted sections. The locations in these cases must be considered more approximate and subject to error than those in the other 58 cases. Most of the brains in the series were cut in the horizontal plane. The locations of the centers of the injection sites were determined for each case and then mapped onto the corresponding section in our three-dimensional atlas of the gerbil IC (Cant and Benson, 2005). Using the atlas coordinates, we could then map the locations of the injection sites on other planes of section.
Cell counts and localization of labeled neurons
Labeled neurons were counted in every BDA-reacted section through the cochlear nuclei, the lateral and medial superior olivary nuclei, the superior paraolivary nucleus, the dorsal and ventral nuclei of the lateral lemniscus and the auditory cortex. (In most of the cases, only every other section was reacted for BDA; in those in which every section was reacted for BDA, counts were made on every section, but the results were divided by 2 to make them more comparable to the other cases.) The labeled cells were viewed and counted through a 20X plan-neofluar objective (N.A. 0.50) and 10X eyepieces for a final magnification of 200X. Counts were made by a single observer. All of the labeled cells in two of the cases (411 and 425) were counted twice at different times. The results of the second counts differed from those of the first by less than 5% in both cases. Because a number of uncontrollable variables could have influenced the number of labeled cells in any given case, no attempt was made to apply correction factors to the raw data. In addition to the counts made at the microscope, the locations of all labeled cells in every BDA-reacted section through the contralateral cochlear nucleus were mapped onto digital photographs of the nucleus in 33 of the cases. Other nuclei with labeled cells were photographed or mapped for illustrative purposes in a few of the cases.
RESULTS
The tracer BDA is transported from the site of uptake in both the retrograde and anterograde directions. Here, we present only the results of the retrograde transport. Projections from the IC to the medial geniculate nucleus that were labeled anterogradely will form the subject of a separate report.
Definition and distribution of injection sites
Our goal was to make small injections that sampled restricted regions throughout the inferior colliculus. Seven of the injection sites are illustrated in Figure 1. In the BDA-reacted sections (left column), the area of the injection site was usually so densely encrusted with the reaction product that anatomical detail was completely obscured. The area of densest deposit was surrounded by regions where labeled cells and axons could be visualized. These often extended long distances from the injection site in patterns related to the intrinsic organization of the IC, making it impossible to draw a boundary delimiting an effective injection site based on the appearance of labeled elements.
Figure 1.
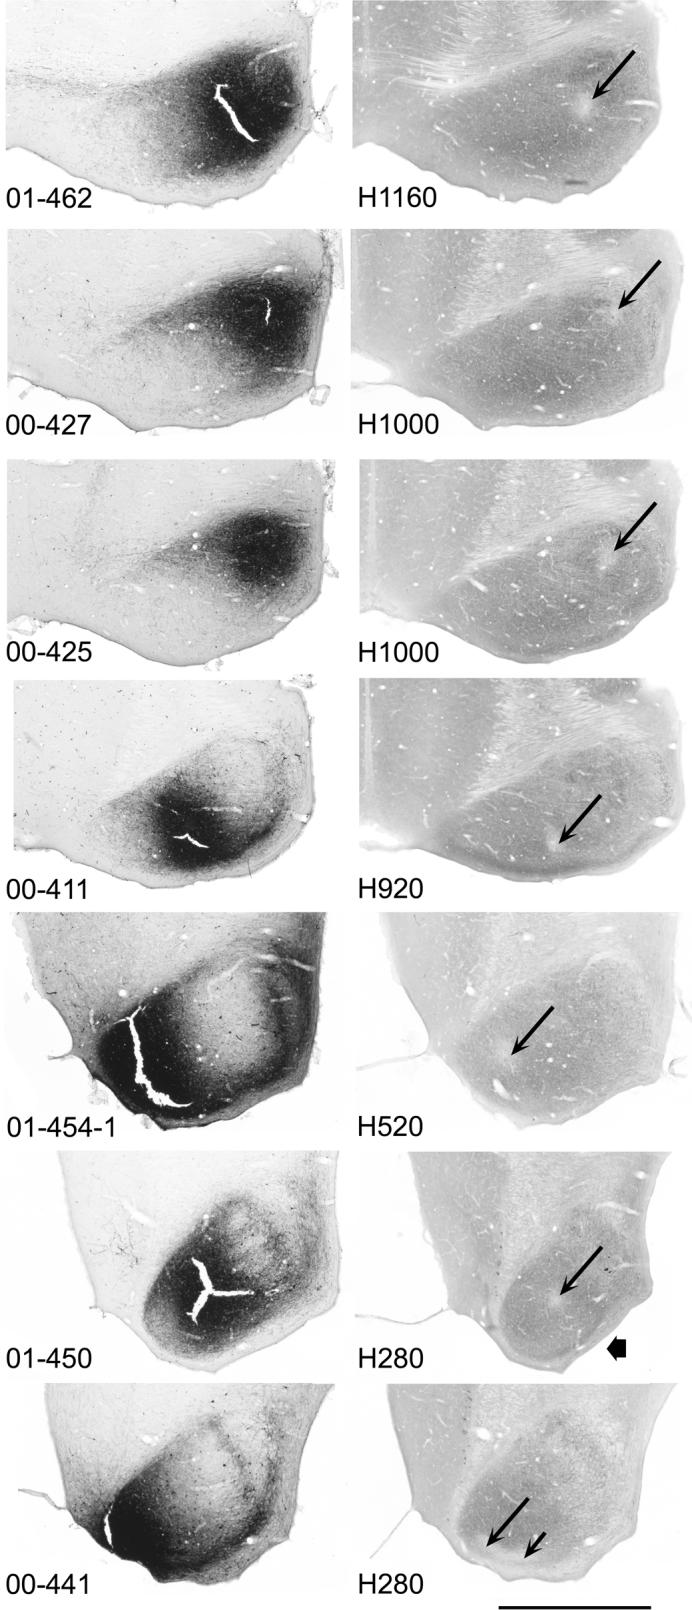
Digital photographs of adjacent horizontal sections through the center of the injection site in the right IC in seven cases. Left column: BDA-reacted sections. Right column: CO-reacted sections. The number on the left is the case number for each pair of sections. (The sections shown for case 454 illustrate one of the three injections made in this case.) The number on the right is the number of the comparable section in our atlas of the gerbil IC (Cant and Benson, 2005). Level H1160 is the most dorsal level represented; level H280 is the most ventral. Long thin arrows on each CO-reacted section indicate the CO-depleted spot that marks the location of the pipette tip during the injection. Short thin arrow on the CO-reacted section for case 441 indicates an elongation of the pale region that was probably due to relative brain movement during the injection. The reaction product often built up to such an extent that the tissue became brittle and tore during handling, resulting in cracks like those visible in some of the sections. (The cracks were not a result of the injection itself as they were not present in the CO-reacted sections.) The shape of the CO-reacted section for case 450 was distorted during histological processing (short, thick arrow). For all sections, rostral is toward the top of the figure and lateral is to the right; the midline is at the left side of each panel. Scale bar is equal to approximately 1 mm for all panels.
For present purposes, it was most important to accurately locate the center of each site. For this, the CO-reacted sections were ideal because passage of current resulted in a depletion of CO in the neuronal elements at the location of the pipette tip (the presumed center of the injection site), leaving a small “white” spot (Fig. 1, right column, arrows). In most of the cases (e.g., Fig. 1, cases 411, 425, 427), the spot was small (200 to 300 μm in diameter) and appeared in only two or three CO-reacted sections, indicating that it was approximately spherical in shape. In a few other cases (marked by double asterisks in Table 1; e.g., Fig. 1, cases 441, 450, 462), the spot extended for as many as 10 or 15 consecutive CO sections along the axis of the pipette track, probably due to brain movement with respect to the pipette during the injection. These sites were therefore larger and more columnar in shape than those in the other cases, but even so, only part of the IC appeared to be involved in the injection. In three cases (marked by single asterisks in Table 1; e.g., Fig. 1, case 454), we attempted to make three injections relatively close to one another in the ventral IC. In these cases, we detected a white spot associated with each injection. Only a few of the cases had injection sites that appeared substantially smaller than those illustrated in Figure 1.
The locations of the centers of the injection sites are illustrated in the horizontal plane in Figure 2. The injection sites were located throughout the central core of the IC and, to a lesser extent, in surrounding border areas. For the most part, the injections appeared to provide a fairly thorough sampling of most of the IC. They were distributed relatively evenly in the dorsal to ventral, rostral to caudal and medial to lateral dimensions. Two areas that were probably not sampled adequately were the caudal part of the dorsal (or caudal) cortex and a ventrolateral area that included part of the central nucleus (Fig. 2).
Figure 2.

Distribution of injection sites in the IC. Each panel depicts a horizontal section from our atlas of the gerbil IC (Cant and Benson, 2005). The sections are arranged in rows with the most dorsal section at the top left and the most ventral section at the bottom right. The top number to the upper left of each panel identifies the level of the section in the atlas. All injection sites that were localized to the atlas section depicted and also all of those that were localized to the atlas section dorsal to the one depicted (number in parentheses) are indicated by circles. (On section H120, injection sites from both the adjacent dorsal section and the adjacent ventral section are plotted.) For all sections, rostral is toward the top of the figure and lateral is to the left. A thin line (e.g., arrow on section H1400) indicates the rostral boundary of the IC. The case number (stripped of its prefix) is indicated inside each circle. For cases in which more than one injection was made (453, 454 and 455) a circle is included for the site of each injection that was located within the IC. X, regions that were not well-sampled in this study.
The extent of projections from each major brainstem nucleus depended on the location of the injection site in the IC
In almost all cases, the contrast between labeled cells and the surrounding tissue was high (Fig. 3) so that it was relatively straightforward to obtain reliable cell counts (Table 1). The total number of labeled cells varied considerably. As expected, the cases with the largest numbers of labeled cells were cases in which the injection appeared to spread over a greater than usual number of sections or in which we intentionally made multiple injections. Twelve of the cases had fewer than 200 labeled cells. These cases included all of those in which the injection site appeared to be smaller than usual.
Figure 3.

Digital photographs of horizontal sections through the left (contralateral) cochlear nucleus (A) and both sides of the superior olivary complex (B) from case 427 with higher magnification views of the contralateral AVCN (C), the ipsilateral MSO (D), the contralateral LSO (E) and the ipsilateral LSO (F) from the same sections. Labeled neurons (C-F, arrows) stand out darkly against the pale, unstained background. The rostral direction is toward the top of the figure; lateral is toward the left in panel A. Scale on panel B = 1.0 mm and also applies to panel A. Scale on panel C = 200 μm and also applies to panels D-F.
The total number of labeled cells in the cochlear nuclei correlated fairly well with the total number of labeled cells in the ascending pathways, but the total number of labeled cells in the superior olivary complex did not (Table 1). Based on differences in the proportions of labeled cells located in the cochlear nuclei and in the main nuclei of the superior olivary complex, we assigned each case to one of three groups. Group 1 contains those cases (n=28) in which 15% or more of the labeled cells in the brainstem were located in the cochlear nuclei and 5% or more were located in the MSO and LSO. Group 2 contains those cases (n=29) in which 15% or more of the labeled cells were located in the cochlear nuclei but less than 5% were located in the MSO and LSO. Group 3 (n=17) contains those cases in which less than 15% of the labeled cells were located in the cochlear nuclei and less than 5% were located in the MSO and LSO. (Creation of a logical fourth group, one in which less than 15% of the labeled cells were located in the cochlear nuclei and 5% or more were located in the LSO and MSO, was not justified by the data. The one case, 426, that would have barely met these criteria was placed into Group 3.)
Data from Table 1 for the cases that fell into Groups 1 and 2 are converted to percentages in Figure 4. Although the criteria separating the groups were set subjectively, almost all of the cases fell clearly into one group or another, and, in most cases, the criteria set a quite low limit. In Group 1, labeled cells in the cochlear nuclei ranged from 17.5% to 54% (average = 34.4%) and in the MSO and LSO, from 5.8% to 50% (average = 21.8%). In Group 2, labeled cells located in the cochlear nuclei ranged from 15.3% to 60.8% (average = 39.2%) and in the MSO and LSO, from 0 to 4% (average = 1.4%). There were only four cases in Group 1 in which less than 10% of the labeled cells were located in the LSO and MSO and only four cases in Group 2 in which more than 3% of the cells were located in those nuclei. In Group 3, labeled cells located in the cochlear nuclei ranged from 0 to 13.2% (average = 6.2%) and in the LSO and MSO, from 0 to 5.0% (average =1.0%).
Figure 4.
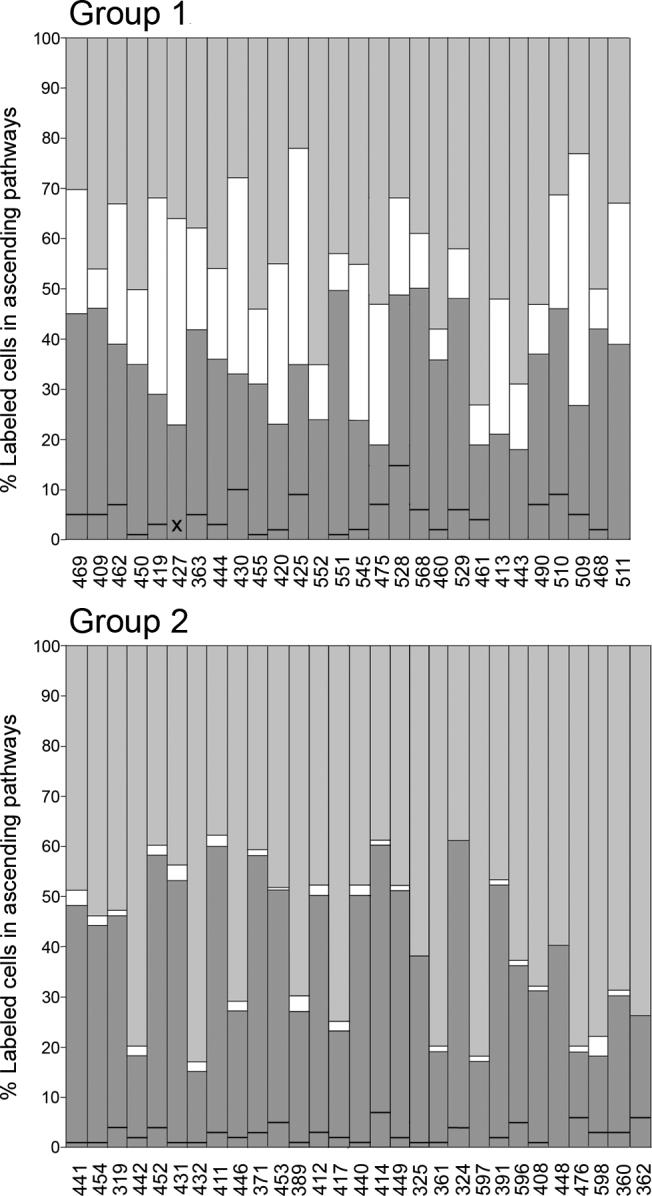
Bar graphs of data from Table 1 plotted as percentages (case numbers are indicated below each bar). Each bar is divided into three parts to show the percent of the total number of cells in brainstem sources (cochlear nuclei, SOC and nuclei of the lateral lemniscus) that were located in the cochlear nuclei (dark gray), in the LSO or MSO (white), and in the superior paraolivary nucleus or nuclei of the lateral lemniscus (light gray). The black line across the dark gray part of each bar divides the contribution from the cochlear nuclei into ipsilateral (below the line) and contralateral (above the line). (For the few cases for which there is no line, all of the labeled cells were located contralaterally.) The cases are divided into groups based on the criteria outlined in the text. The cases are sorted from left to right according to the total number of labeled cells for each group. X, no data are available for the ipsilateral ventral cochlear nucleus in case 427 as it was damaged during processing.
To a certain extent, the total number of labeled cells in the brainstem auditory nuclei was related to the group into which the case fell (Table 1). All but one of the cases in Group 3 had fewer than 200 labeled cells in the brainstem auditory nuclei, although some of these cases had a large number of labeled cells in the auditory cortex. Group 1 cases tended to have higher numbers of labeled cells than did Group 2 cases, but there was considerable overlap. Cases with the highest numbers of labeled cells in the ascending pathways were distributed throughout the core of the IC and did not appear to favor any particular region (i.e., dorsal vs. ventral or rostral vs. caudal).
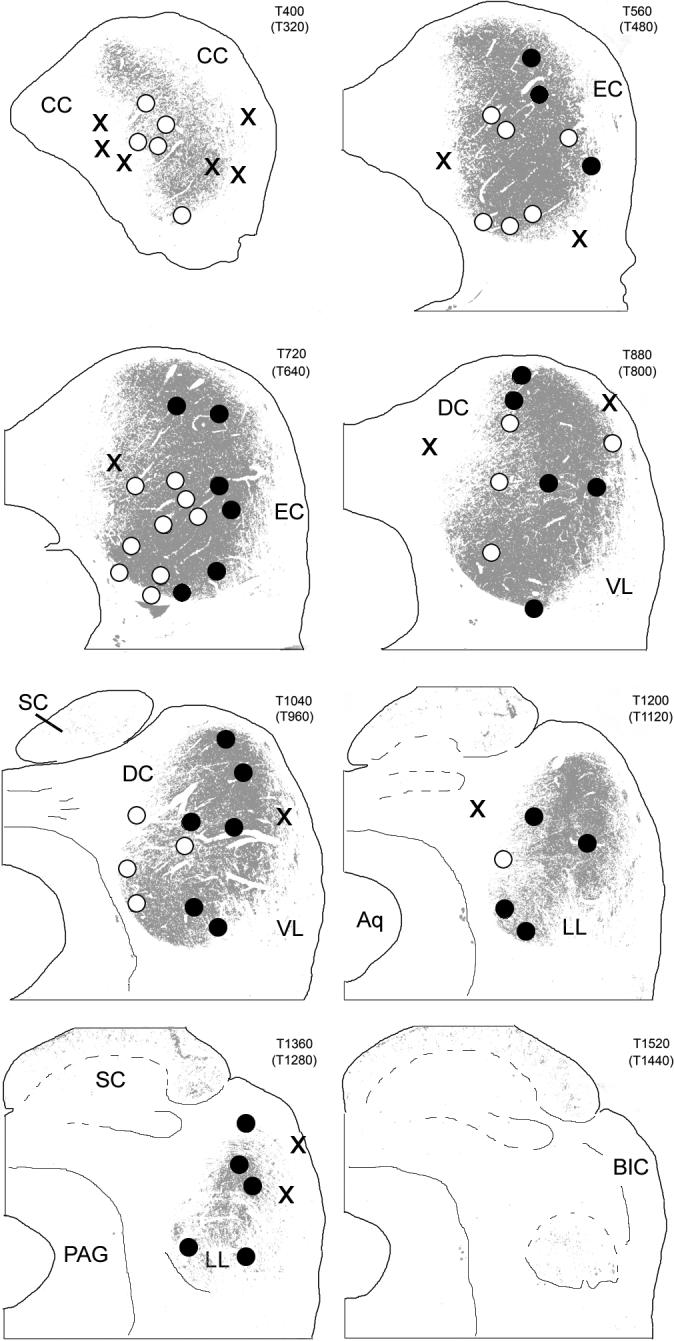
The most obvious variable related to whether a case was assigned to Group 1, 2 or 3 was the location of the center of its injection site in the IC (Figs. 5 and 6). Cases in both Group 1 (blue dots) and in Group 2 (red dots) were distributed throughout the dorsal to ventral extent of the central IC. However, the Group 1 cases tended to be distributed more laterally relative to the Group 2 cases, which tended to be located more medially and caudally. There was little overlap between the areas occupied by the centers of the injection sites in the two groups. The segregation of the injection sites for cases in Group 1 vs. those in Group 2 is especially obvious when the injection sites are plotted in the sagittal plane (Fig. 6). The injection sites for the Group 3 cases (green dots) generally lay around the margins of the IC in the dorsal, caudal and external cortices.
Figure 5.

CO-reacted transverse sections through the right IC (atlas sections from Cant and Benson, 2005). The location of the centers of the injection sites for Group 1 cases are indicated in blue; those for Group 2 cases are indicated in red; and those for Group 3 cases are indicated in green. Each panel shows all of the cases that were localized to the section shown (number at the top right of each panel) and also those localized to the section caudal to the one shown (number in parentheses). Dorsal is toward the top of the figure; lateral is toward the right. Scale bar = 1.0 mm for all panels.
Topographic organization of the projections to the IC
In all but one of the cases in Groups 1 and 2, labeled cells were located in all three main divisions of the cochlear nucleus (i.e., the AVCN, PVCN and DCN) (Table 1; Fig. 7). Based on the location of labeled cells along the topographic axis in both the DCN and the AVCN, we could assign each of the cases to a “frequency” range based on the known tonotopic organization of the cochlear nuclei in the gerbil (e.g., Ryan et al., 1982; Hancock and Voigt, 2002). Cases with a pattern of distribution like that in case 425 or 462 (Fig. 7) were assigned to the low frequency range. In such cases, labeled cells were loosely distributed throughout the ventral AVCN and PVCN (see also Fig. 3A and 3C, case 427) and in the lateral and ventral DCN. In the AVCN, the labeled cells were scattered among unlabeled spherical bushy cells, which do not project to the IC. Cases with a pattern like that of case 411 were assigned to the middle frequency range. In these cases, the labeled cells were tightly clustered, forming dense bands through the middle of all three parts of the cochlear nucleus. Cases with a pattern like that of case 441 were assigned to the high frequency range. In these cases, labeled cells in the DCN were located in the most dorsomedial part of the nucleus and labeled cells in the AVCN and PVCN formed a continuous cluster dorsal to the entry zone of the cochlear nerve. The results (Table 1) are compatible with the known topographic organization of the IC (e.g., Ryan et al., 1982; Brückner and Rübsamen, 1995). As expected, the injection sites that resulted in labeled cells in the low-frequency parts of the cochlear nuclei were located in the dorslateral aspect of the IC. In addition, almost all of the cases with injection sites in the most rostral part of the IC fell into the low-frequency range. As the locations of the injection sites in the IC moved from dorsolateral to ventromedial positions, the locations of the labeled cells in the cochlear nuclei shifted to regions known to represent higher frequencies. This sorting of the cases by putative frequency ranges allowed us to detect differences in the ascending projections related to the position of the injection sites along the tonotopic axis of the IC.
Figure 7.

A. Drawings of evenly spaced horizontal sections through the contralateral cochlear nucleus in four cases. (The injection sites are illustrated in Figure 1.) From top to bottom in each column, the sections are arranged from dorsal to ventral and are located at comparable levels through the nucleus for each case (see Panel B). For each horizontal section, lateral is toward the top of the figure and rostral is toward the right. Sections in each series are separated by 280 μm. Each dot represents at least one labeled cell. Arrows indicate concentrations of labeled cells in the AVCN in each case. Dashed lines on the most ventral sections indicate cut nerve edges or damage to the sections during removal of the brain from the skull. B. Evenly spaced transverse sections through the cochlear nucleus to illustrate the location of the horizontal sections in Panel A. The section on the left is the most caudal in the series; the section on the right is the most rostral. For each section, dorsal is toward the top of the figure and lateral is toward the left. Sections are separated by 360 μm. (In order to make the cochlear nuclear complex stand out, the opacity of surrounding structures was decreased digitally.) Lines running behind the sections indicate the approximate locations of the horizontal sections in Panel A, with the top line at the level of the most dorsal sections and the bottom line at the level of the most ventral sections in the horizontal series. Scale = 1.0 mm for all sections.
Inputs from the ipsilateral cochlear nuclei
The majority of inputs from the cochlear nuclei arise contralaterally, but there is also a small contribution from the ipsilateral cochlear nuclei. In 13 of the Group 1 cases and in 5 of the Group 2 cases, the labeled cells in the ipsilateral cochlear nuclei accounted for 5% or more of the total number of labeled cells in the brainstem nuclei (Fig. 4). Twelve of these were cases assigned to the low frequency range; three were assigned to the middle frequency range; and the remaining three overlapped the middle frequency range. None of the 13 cases assigned to the high frequency range had more than 2% of the labeled cells in the ipsilateral cochlear nuclei, and 10 of them had 1% or less.
Projections from the superior olivary complex
In all of the Group 1 cases, the locations of labeled cells along the topographic axes of the MSO and LSO were compatible with the frequency ranges to which the cases were assigned based on the locations of labeled cells in the cochlear nuclei (Table 1; Fig. 8A). Cases that were assigned to the high frequency range had relatively few or no labeled cells located in the MSO. Cases assigned to the low frequency range had labeled cells located almost entirely in the lateral limb of the LSO. Those assigned to the middle frequency range had labeled cells located in both the lateral and medial limbs with a bias toward the medial limb, and those assigned to the high frequency range had labeled cells located almost exclusively in the medial limb. In almost all of the Group 1 cases, labeled cells were located in the LSO on both sides of the brainstem (Table 1). In some cases more cells were located ipsilaterally and in others, more were located contralaterally. Contralateral vs. ipsilateral dominance in the LSO appeared to depend only weakly, if at all, on the frequency range to which the case was assigned.
Figure 8.
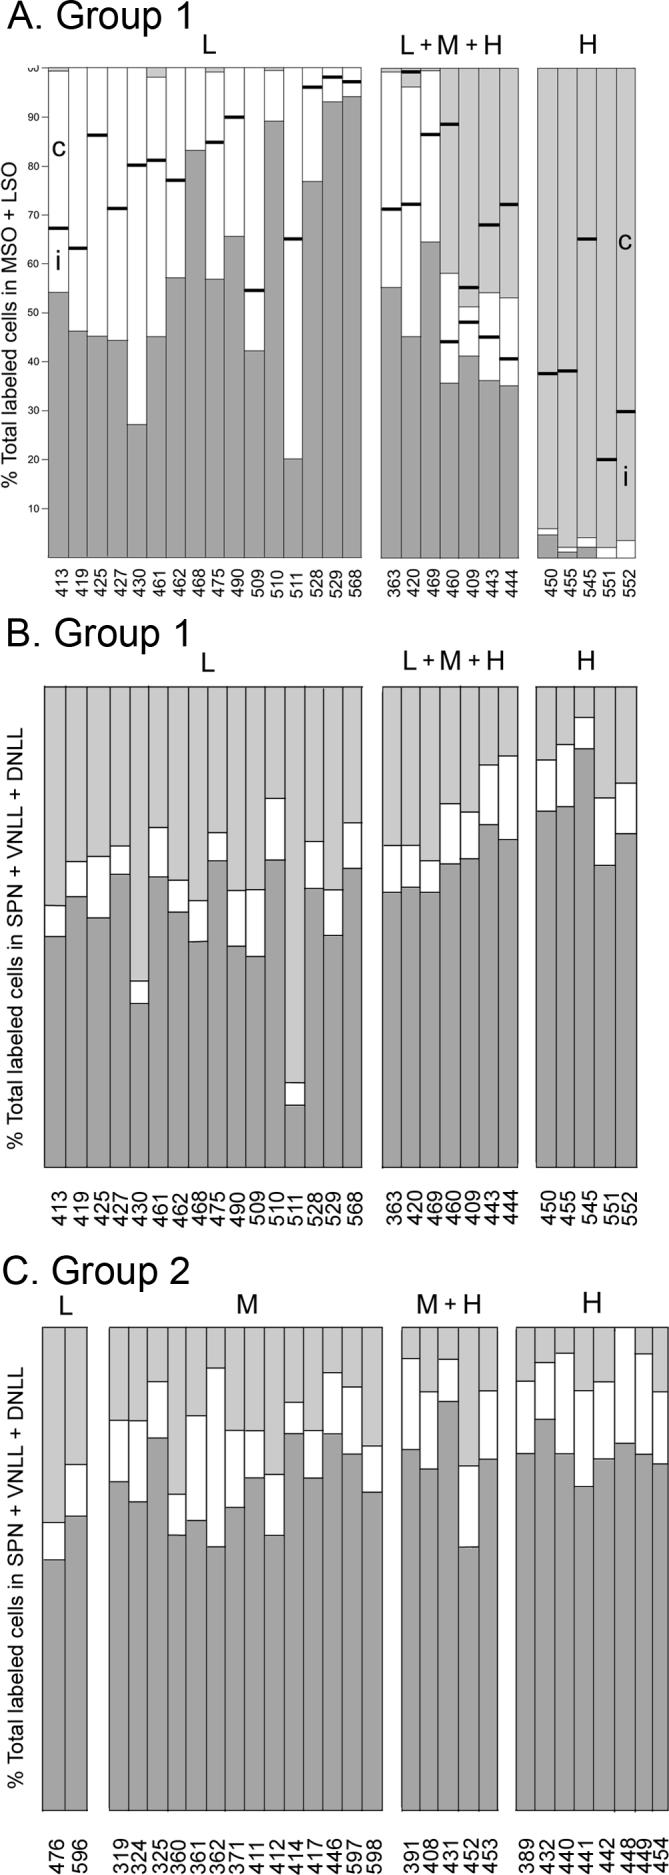
Bar graphs illustrating the distribution of labeled cells in the SOC (A) and nuclei of the lateral lemniscus (B, C). Data from Table 1 are re-plotted as percentages. The cases are sorted according to the frequency range to which they were assigned as described in the text. A. Distribution of labeled cells in the LSO and MSO in Group 1 cases. Each bar is divided into parts to show the percentage of the total number of labeled neurons in the main nuclei of the SOC that were located in the ipsilateral MSO (dark gray), the lateral limb of the LSO (white), and the medial limb of the LSO (light gray). The white and light gray portions of the bars are each further divided into two parts to represent the contribution of the ipsilateral LSO (i, portion below the dividing line) and contralateral LSO (c, portion above the line). (For cases where the contribution of the lateral or medial limb was tiny, the laterality is not indicated but can be obtained from Table 1.) B, C. Distribution of labeled cells in the nuclei of the lateral lemniscus and superior paraolivary nucleus in both Group 1 (panel B) and Group 2 (panel C) cases. Each bar is divided into three parts to show the percent of the total number of labeled cells in the superior paraolivary nucleus and the nuclei of the lateral lemniscus that were located in the ipsilateral ventral nucleus of the lateral lemniscus (dark gray), in the ipsilateral superior paraolivary nucleus (white), and in the dorsal nuclei of the lateral lemniscus on both sides (light gray).
Inputs from the superior paraolivary nucleus and the nuclei of the lateral lemniscus
When the total numbers of labeled cells in the superior paraolivary nucleus (SPN), the ipsilateral ventral nucleus of the lateral lemniscus (VNLL) and both the ipsilateral and contralateral dorsal nuclei of the lateral lemniscus (DNLL) were summed and the contribution of each of these sources to the total was then calculated, differences related to frequency representation became apparent for cases in both Group 1 and 2 (Fig. 8B, C). The average percentage contributed by the VNLL in the different frequency ranges was as follows: Group 1: L, 50.6%; L + M + H, 62.5%; H, 73.6%. Group 2: L, 56.5%; M and M + H, 68.1%; H, 73.8%. The percentage contributed by SPN tracked with that contributed by the VNLL (i.e., it increased in the higher frequency range), whereas the percentage contributed by the DNLL was higher for the low frequency cases. In terms of absolute numbers of labeled neurons, the differences appeared to be due to a disproportionate increase (with respect to the total number of labeled cells in the case) in the number of labeled cells in the VNLL in the high frequency cases. The absolute numbers of labeled cells in the DNLL tended to vary proportionately with the total number of labeled cells in the case, independent of the location of the injection site.
A working definition of the central nucleus of the gerbil IC in CO-reacted sections
Gonzalez-Lima and Jones (1994), using quantitative techniques, demonstrated that CO activity in the gerbil IC is higher in the central nucleus than in the surrounding dorsal and external cortices, but they did not provide a method for defining the boundaries between the subdivisions. Indeed, there are no abrupt changes in activity in any part of the IC that would signal the presence of internal boundaries (e.g., Fig. 5); rather CO activity within the IC is graded (see below) so that that any dividing line between “high” and “low” activity is arbitrary. Using the results of the retrograde experiments as a guide, we attempted to define a border between areas of higher and lower CO activity such that the area of higher activity was at least roughly congruent with the area that gives rise to retrogradely labeled cells in the cochlear nuclei (i.e., an area encompassing the injection sites for the cases in Groups 1 and 2 but not those in Group 3). Our rationale was that the area of distribution of cochlear nuclear projections affords a good approximation of the area of the central nucleus of the IC (see Discussion). Important considerations were that the definition be straightforward to apply and that it yield consistent results among observers and across cases. Although there was no guarantee a priori that these conditions could be met, we propose below an empirical working definition of the central nucleus of the IC in CO-reacted material that meets them reasonably well.
The highest CO activity in the gerbil IC is always concentrated in a central region that extends from dorsolateral to ventromedial in transverse sections (Fig. 9A) and from rostrolateral to caudomedial in horizontal sections (Fig. 9B). The area of highest activity is surrounded by areas of progressively decreasing (although still relatively high) activity (Fig. 9A.b-g and B.b-g). The decrease is gradual except at the ventromedial margin of the IC (Fig. 9A.a, arrow; 9A.h, open arrow), where the change is abrupt (and, for that reason, obvious to the human eye). We found that the conditions stated above could be met by setting a threshold on digital images of the midbrain that included gray values darker than but not including those exhibited by the superior colliculus. In practice, for any given series of sections, one image of the tectum that included the SC was chosen and a threshold was set just at the point at which the cellular layers of the SC began to appear (compare Fig. 9A.d to 9A.e and 9B.e to 9B.f). The resulting threshold was then used on all images in the set. The procedure has the advantage of being simple, reproducible, and independent of the overall staining intensity in the tissue or the exact range of pixel values in the digital image. It yields consistent results both across cases and across observers.
Figure 9.

Results of setting progressively more inclusive thresholds on digital images of CO-reacted sections through the IC. A.a, Digital image of a transverse section through the midbrain approximately half-way through the rostral to caudal extent of the IC. B.a, Digital image of a horizontal section through the midbrain approximately half-way through the dorsal to ventral extent of the IC. Regions of high CO activity appear dark in these grayscale images, whereas regions with little or no CO activity (e.g. fiber tracts) appear pale. The differences in CO activity translate into differences in grayscale values of the pixels in digital images of the tissue; the higher the activity, the darker (on a scale of 0 to 256 with 0 equal to 100% black) are the pixels in the image. A.b-g. The threshold function in Adobe Photoshop was applied to the image in panel A.a at progressively more inclusive values and the locations of the pixels that were included in the threshold are indicated by the gray fill. A.b, Location of all pixels with a value from 130−135. (There were no pixels with a value less than 130 in this image.) A.c, Location of all pixels with a value from 130 to 145. A.d, 130 to 155. A.e, 130 to 165. Arrow indicates pixels beginning to appear in the caudal-most SC. A.f, 130 to 175. Arrow indicates the growth of the area of inclusion in the SC. A.g, 130 to 185. A.h, A higher magnification view of the right IC. In this image, the location of pixels with values from 155 to 165 is shown in gray; areas with pixels darker than 155 or lighter than 165 remain white. (The pixels shown in gray are those that were added to the central patch going from panel A.d to panel A.e.) The open arrow indicates the location of the sharp boundary at the ventromedial margin of the IC. The filled arrows indicate the medial and lateral fuzzy borders of the dense patch shown in panel A.e (which included all of these pixels). The borders lie between a central area with very few lighter pixels and surrounding areas with almost no darker pixels. B.b-g. The threshold function in Adobe Photoshop was applied to the horizontal image in panel B.a as described for the transverse images. B.b, Location of all pixels with a value from 120 to 140. B.c, 120 to 150. B.d, 120 to 160. B.e, 120 to 170. Large arrow indicates the appearance of the darkest pixels in the SC (in the intermediate layer). B.f, 120 to 180. Large arrow as in panel B.e. Small double arrows indicate patches of dark pixels (high CO activity) in the external cortex of the IC. B.g 120 to 190. B.h, Higher magnification view of the right IC with the threshold set at 170 (as in panel B.e). The gray fill indicates the central CO-rich region of the IC. It is this region that we have defined as the central nucleus (see text). The sections illustrated are at levels T960 (A) and H1160 (B) of our gerbil atlas (Cant and Benson, 2005). For the transverse section, the dorsal direction is toward the top of the figure. For the horizontal section, the rostral direction is toward the top of the figure.
Our working definition of the CNIC, then, is as follows: the central nucleus of the gerbil IC in CO-reacted sections is equivalent to the part of the IC that exhibits CO activity higher than in any part of the superior colliculus. (We exclude from this definition some small, isolated patches of high CO activity in the IC that are clearly located in the external cortex; Fig. 9B.f.; cf. Chernock et al., 2004.) The CNIC defined in this way is represented as shown in Figure 9B.h and Figure 10; areas of higher CO activity (i.e., the CNIC) are shown in gray, surrounded by areas of lower activity in white. As desired, the central area is at least roughly congruent with the area in which our injections yielded labeled cells in the cochlear nuclei (i.e., Groups 1 and 2; Fig. 10) but excludes the areas where they did not (i.e., Group 3). Although there are subtle differences in patterns of CO activity within the central nucleus, we could not distinguish areas that gave rise to Group 1 cases from those that gave rise to Group 2 cases using any simple criteria.
Figure 10.
Distribution of injection sites with respect to the location of the central nucleus of the IC (as defined in the text). Transverse sections through the IC are the same as those illustrated in Figure 5. The large central patch of gray fill represents all pixels in the image that were captured by a threshold set just at the point at which pixels in the superior colliculus began to be included (see text). The centers of the injection sites for 71 of the cases are indicated by dots. Black dots: Injection sites for Group 1 cases, in which > 15% of labeled cells in the ascending pathways were located in the cochlear nuclei and > 5% were located in the LSO and MSO. White dots: Injection sites for Group 2 cases, in which > 15% of labeled cells in the ascending pathways were located in the cochlear nuclei but < 5% were located in the LSO and MSO. X, Injection sites for Group 3 cases, in which few labeled cells were found in the cochlear nuclei or in the superior olivary complex.
DISCUSSION
The main results of the study can be summarized with reference to Figure 10. The central nucleus of the IC (CNIC), defined based on its relatively high oxidative capacity, is made up of two parts with different sets of inputs. The more lateral and rostral parts of the CNIC receive inputs from the cochlear nuclei, the main nuclei of the superior olivary complex (LSO and MSO) and the nuclei of the lateral lemniscus, whereas the more medial and caudal parts receive inputs from the cochlear nuclei and the nuclei of the lateral lemniscus but not from the LSO or MSO. Anterograde tracing studies of inputs to the IC should help to more precisely delineate the boundaries between the two regions.
Patterns of labeling in the brainstem depend on the size of the injection site
The injection sites in our study were not so large that the entire topographic axis of the CNIC was involved but they were not so small that only one or two brainstem nuclei were labeled as in some earlier studies. Large or multiple injections of retrograde tracers into the CNIC yield consistent results in a variety of species (reviewed by Cant, 2005). In the only previous retrograde tracing study in the gerbil, large tracer injections into the CNIC resulted in labeled cells located in the same brainstem auditory nuclei observed in our cases (Nordeen et al., 1983), although our more focal injections allowed us to see the two distinct patterns of projections to the CNIC (Group 1 vs. Group 2) and to evaluate the topographic organization of the projections in more detail. On the other hand, in retrograde tracing studies in which very small tracer injections were employed (Roth et al., 1978; Brunso-Bechtold, 1981; Aitkin and Schuck, 1985; Maffi and Aitkin, 1987; Ross et al., 1988; Ross and Pollak, 1989), the extent of labeling in individual brainstem auditory nuclei was highly variable. In many cases only a few auditory nuclei contained most, if not all, of the labeled cells, and many different combinations of labeled nuclei were reported.
Not surprisingly, in most cases in which only a few sources of inputs were labeled, the total number of labeled cells in the ascending pathways was quite low. For example, in 5 out of 10 cases reported by Brunso-Bechtold et al. (1981), fewer than 250 labeled cells were counted in all of the brainstem nuclei. For the most part, similarly low numbers were reported in the other studies. In contrast, in our study, only nine of the 57 cases in Groups 1 and 2 had fewer than 250 labeled cells in the brainstem auditory nuclei (Table 1), but even in most of those cases, the labeled cells were distributed throughout the brainstem (except for the definitive absence of cells in the MSO and LSO in Group 2 cases). Because the total number of cells that project to the CNIC from the brainstem is probably significantly larger in the cat than in the gerbil (counts by Adams, 1979, compared to those by Nordeen et al., 1983), it is reasonable to assume that relative to those in the studies cited above, our injections were larger and consequently revealed only two patterns of projections rather than many.
Compartmentalization of inputs within the CNIC
Almost all authors who have investigated the connectivity of the CNIC have concluded that, within the order imposed by the well-established topographic mapping of inputs related to frequency representation, there is additional order imposed by differential distribution of terminations from the main sources of ascending input (Roth et al., 1978; Brunso-Bechtold, 1981; Kudo, 1981; Henkel and Spangler, 1983; Oliver, 1984b; 1987; Aitkin and Schuck, 1985; Maffi and Aitkin, 1987; Shneiderman and Henkel, 1987; Frisina et al., 1988; Kudo and Nakamura, 1988; Ross et al., 1988; Shneiderman et al., 1988; Ross and Pollak, 1989; Oliver et al., 1997; Gabriel et al., 2000; Loftus et al., 2004). Comparisons of the results of anterograde tracing studies in the cat that demonstrate the termination zones of the superior olivary nuclei (Henkel and Spangler, 1983; Shneiderman and Henkel, 1987) vs. those of the cochlear nuclei (Oliver, 1984b, 1987) support the conclusion that the former are more restricted in extent. A direct demonstration of the difference in the area innervated by the contralateral LSO vs. that innervated by the contralateral dorsal cochlear nucleus was provided by Oliver et al. (1997), who used double-labeling techniques to demonstrate that the inputs from these two sources overlap only in the ventrolateral part of the CNIC. Presumably, injection of retrograde tracers into the area of overlap would give rise to cases like those in our Group 1, whereas injections confined to the area that receives inputs only from the DCN would give rise to cases like those in Group 2.
By definition, all of the cases in our study in Group 1 had significant numbers of labeled cells in the main nuclei of the superior olivary complex, although labeled cells in the MSO were a small proportion of the total in the Group 1 cases assigned to the high frequency range. As in the cat (Henkel and Spangler, 1983; Loftus et al., 2004), the MSO does not appear to project to the ventromedial, high frequency part of the CNIC. The laterality of projections from the LSO appears to vary among species. In the cat, ipsilateral projections from the LSO tend to arise predominantly from the lateral limb whereas contralateral projections arise from the medial limb (Glendenning and Masterton, 1983). In the ferret, more cells in both limbs of the LSO project to the contralateral IC than to the ipsilateral IC (Henkel and Brunso-Bechtold, 1993; Moore et al., 1995). In the gerbil, we found that projections to each IC appear to arise thoughout both limbs of the LSO and that either the ipsilateral or contralateral LSO can dominate in terms of the numbers of cells that are labeled.
Double-labeling experiments in the cat provide direct evidence for compartmentalization of inputs within the area that receives olivary inputs. Shneiderman and Henkel (1987) demonstrated that inputs arising from the the ipsilateral and contralateral LSO remain partially separate, forming interdigitating layers of terminals. Segregation of inputs from the ipsilateral and contrateral lateral superior olivary nuclei was confirmed by Loftus et al. (2004), who further demonstrated that the inputs from the ipsilateral MSO appear to overlap mainly with those from the ipsilateral LSO. Among our Group 1 cases, the proportion of labeled cells in the MSO and LSO vs. the cochlear nuclei varied with the rostral to caudal location of the injection sites. The injection sites for the eight cases in which the percentage of labeled cells in the SOC was higher than in the cochlear nuclei (Table 1) were located in the rostral half of the IC (Fig. 5, cases 419, 420, 425, 427, 430, 475, 509, 545). All but one of these cases (545) was assigned to the low frequency range. A similar dominance of inputs from the MSO and LSO in the rostral IC was noted by Brunso-Bechtold et al. (1981) in the cat.
Incomplete overlap of inputs from brainstem sources led Oliver to propose the concept of ‘synaptic domains,’ according to which the layers in the CNIC devoted to a particular frequency are made up of a mosaic of regions receiving subsets of the inputs to that layer (e.g., Oliver, 2005). Very small injections of retrograde tracers (see previous section) into the CNIC might sample individual domains, but medium-sized injections, such as the ones in our study would be more likely to sample multiple domains. Accordingly, our study does not provide evidence for segregation of inputs from the ipsilateral and contralateral LSO or from those sources and the ipsilateral MSO (except for the exclusion of MSO inputs from the high frequency region). However, our anterograde studies in the gerbil indicate that, as in the cat, inputs from the olivary nuclei overlap only partially in the CNIC (Benson and Cant, unpublished results).
Definition of the central nucleus of the IC (CNIC) in the gerbil
The mammalian IC is commonly divided into a central nucleus bordered by lateral (or external) and dorsal cortices (reviewed by Oliver, 2005). Anatomically, the central nucleus of the inferior colliculus is defined by the presence of layers formed by the oriented dendrites of neurons and the afferent axonal plexuses that lie parallel to them, often referred to as fibrodendritic laminae (cat: Morest and Oliver, 1984; Oliver and Morest, 1984; rat: Faye-Lund and Osen, 1985; Malmierca et al., 1993; mouse: Meininger et al., 1986). However, specialized techniques are necessary to visualize the layers, and consequently, they cannot be used as a guide for delineating the CNIC in routine histological material. The importance of precision in defining boundaries of subdivisions in different parts of the IC (or in any part of the brain) lies in the need for a common language when comparing the results of different studies. Difficulties inherent in establishing a consistent definition of IC subdivisions in experimental material are discussed in detail by Oliver (2005); we limit the following discussion to a consideration of definitions of the CNIC in the gerbil.
Presumably, the gerbil CNIC can be defined based on a layered organization of its neurons and axons as in other species (op cit.). However, the extent and orientation of the putative fibrodendritic laminae in the gerbil have not been determined, and a variety of different (and not always clearly specified) criteria have been used to delineate its CNIC (Ryan et al., 1982, 1992; Nordeen et al., 1983; Moore and Kitzes, 1985; Gonzalez-Lima and Jones, 1994; Budinger et al., 2000; Bajo and Moore, 2005). Considerable variability in the shape and size of the ‘CNIC’ in the studies cited makes comparisons among them tentative and highlights the need for a consistent definition. We sought to address the problem by developing an easily applied and objective criterion for defining the CNIC based on differential cytochrome oxidase activity in the IC. CO histochemistry provides a simple and reliable counterstain that differentiates brainstem nuclei based on oxidative capacity (e.g., Hevner et al., 1995). In the CNIC, CO activity is higher than in other subdivisions (Gonzalez-Lima and Jones, 1994), but the boundaries are not clear-cut. To develop our definition, we first equated the CNIC with the part of the IC that receives ascending lemniscal inputs (cf. Oliver, 2005) and then asked whether we could define an area of ‘high’ CO activity that was congruent with the lemniscal projection zone. The definition presented in the results based on a comparison with CO activity levels in the superior colliculus meets this objective reasonably well (Fig. 10).
Some depictions of the CNIC in the gerbil appear to encompass more of the IC than does the CNIC defined by us and some appear to encompass less. Two extremes in terms of the apparent volume of the IC included in the central nucleus are illustrated by Moore and Kitzes (1985) and Budinger et al. (2000). Moore and Kitzes (1985) based their definition on Berman's analysis of the cat IC (Berman, 1968) and note that their CNIC includes some of the area included in the dorsal cortex of the cat by Morest and Oliver (1984). Based on their definition, they concluded that the projections from the contralateral cochlear nucleus terminated mainly in the lateral two-thirds of the CNIC and were largely excluded from the medial part. Our definition is not compatible with theirs as we assumed that the area of termination of the contralateral cochlear nuclei and the CNIC are approximately co-extensive, as in the cat (Osen, 1972; Oliver, 1984b, 1987). However, we note that the shape and extent of the area containing terminal degeneration resulting from destruction of the contralateral cochlear nucleus in their study conforms very closely to the shape and extent of the CNIC as we defined it (comparison of their Figs. 3 and 4 to our Fig. 10). In contrast to the depiction by Moore and Kitzes (1985), the CNIC delineated by Budinger et al. (2000) in one ‘rather rostral level’ through the IC is much smaller and appears to be restricted to its ventromedial part (although they note that the size of the CNIC increases at more caudal levels). It is likely that the CNIC as illustrated by them would exclude at least part of the low frequency representation in the IC.
The CNIC depicted by Bajo and Moore (2005) most closely resembles in shape and extent that defined by us, with the important exception that it does not appear to extend as far rostrally or laterally as does the region of high CO activity that would be included in our definition. In apparent agreement with Bajo and Moore, Gonzalez-Lima and Jones (1994) considered the rostral part of the CO-dense region to belong partially to the external cortex of the IC rather than to the central nucleus (their Fig. 10). In our studies, tracer injections in the most rostral and lateral part of the IC resulted in substantial labeling in the MSO and LSO and in the ipsilateral and contralateral cochlear nuclei (e.g. cases 425, 427, 430), and for that reason, we propose that it should be considered a part of the central nucleus rather than a part of the external cortex.
We refer to our definition of the CNIC as a working definition because it remains to be determined how such a definition is related to the laminar organization of IC cells and their inputs. At any rate, delineation of the area receiving the bulk of lemniscal afferent fibers provides a starting point for comparisons among studies in the gerbil. Whether similar gradients in CO activity can be related to IC subdivisions in other species remains to be determined.
Functional organization of the IC
Based on our results and those of other neuroanatomical studies cited above, it is clear that brainstem projections to the anatomically defined CNIC are not organized homogeneously. Imposed on the topographic organization related to frequency representation, there is a second order division into a part that receives input from the main nuclei of the superior olivary complex and a part that does not. Further compartmentalization of inputs within the part that receives inputs from the MSO and LSO adds a third level of complexity. Physiological responses of neurons located in distinct parts of the CNIC would be expected to reflect the differences in connectivity when tested with the appropriate stimuli. Indeed, systematic variations in response parameters such as threshold, latency, and best modulation frequency are mapped in the CNIC in dimensions ‘orthogonal’ to the frequency dimension (reviewed by Ehret, 1997). In addition, physiological studies in several species have demonstrated spatial clustering of units with similar binaural response properties (cat: Roth et al., 1978; Semple and Aitkin, 1979; Schreiner and Langner, 1988; gerbil: Brückner and Rübsamen, 1995; mustache bat: Wenstrup et al., 1986). There is some tendency for the binaural response properties to vary with frequency, but even within a given frequency representation, there is at least partial segregation of units with different properties. How these variations in physiological response properties are related to differences in connectivity within the CNIC remains to be determined in most cases. In experiments in the mustache bat that addressed the question directly, Ross and Pollak (1989) demonstrated that units with distinct binaural properties received distinct combinations of inputs from subsets of brainstem auditory nuclei. Comparable anatomical/physiological correlations have not been done in other species.
Some physiological studies have emphasized the importance of convergence of multiple inputs in shaping the responses of IC cells (e.g., Kuwada et al., 1997; McAlpine et al., 1998; Park, 1998; Spitzer and Semple, 1998; Pollak et al., 2002), whereas others have noted that many units display responses apparently shaped by a dominant input from only one of the major sources of input (e.g., Ramachandran et al., 1999; Ramachandran and May, 2002; Davis, 2002). Neuroanatomical results are not incompatible with either view. The CNIC can be considered to be a site of convergence of multiple ascending auditory pathways, but there is also evidence for specificity in the termination patterns of each pathway. The extent to which individual sources of input to the IC terminate on specific populations of neurons is almost unexplored, and understanding the synaptic organization underlying physiological differences presents a major challenge for future studies.
ACKNOWLEDGMENTS
We are grateful to Ms. Boma Fubara and Dr. Kendall Hutson for their important contributions to these studies.
Grant sponsor: National Institute on Deafness and Other Communication Disorders, Grant number DC00135.
LIST OF ABBREVIATIONS
- Aq
cerebral aqueduct
- AVCN
anteroventral cochlear nucleus
- BDA
biotinylated dextran amine
- BIC
brachium of IC
- cbm
cerebellum
- CC
caudal cortex of IC
- CNIC
central nucleus of IC
- cnr
cochlear nerve root
- Co
commissure of the IC
- CO
cytochrome oxidase
- cp
choroid plexus
- DC
dorsal cortex of IC
- DCN
dorsal cochlear nucleus
- DNLL
dorsal nucleus of the lateral lemniscus
- EC
external cortex of IC
- fnr
facial nerve root
- gcl
granule cell layer
- H
horizontal
- IC
inferior colliculus
- ICP
inferior cerebellar peduncle
- IV
fourth nerve nucleus
- LL
lateral lemniscus
- LNTB
lateral nucleus of the trapezoid body
- LSO
lateral superior olivary nucleus
- LSOl
lateral limb of the LSO
- LSOm
medial limb of the LSO
- mesV
mesencephalic nucleus of the fifth nerve
- MSO
medial superior olivary nucleus
- PAG
periaqueductal gray
- PVCN
posteroventral cochlear nucleus
- S
sagittal
- SC
superior colliculus
- SGS
superficial layer of SC
- SGI
intermediate layer of SC
- SGP
deep layer of SC
- SOC
superior olivary complex
- SPN
superior paraolivary nucleus
- T
transverse
- TB
trapezoid body
- V
fifth nerve root
- VIIm
motor nucleus of the seventh nerve
- Vs
spinal sensory nucleus of the fifth nerve
- VL
ventrolateral nucleus of IC
- VNLL
ventral nucleus of the lateral lemniscus
- vnr
vestibular nerve root
- x
marker hole
LITERATURE CITED
- Adams JC. Ascending projections to the inferior colliculus. J. Comp. Neurol. 1979;183:519–538. doi: 10.1002/cne.901830305. [DOI] [PubMed] [Google Scholar]
- Adams JC. Crossed and descending projections to the inferior colliculus. Neurosci. Lett. 1980;19:1–5. doi: 10.1016/0304-3940(80)90246-3. [DOI] [PubMed] [Google Scholar]
- Adams JC. Heavy metal intensification of DAB-based HRP reaction product. J. Histochem. Cytochem. 1981;29:775. doi: 10.1177/29.6.7252134. [DOI] [PubMed] [Google Scholar]
- Aitkin LM, Schuck D. Low frequency neurons in the lateral central nucleus of the cat inferior colliculus receive their input predominantly from the medial superior olive. Hearing Res. 1985;17:87–93. doi: 10.1016/0378-5955(85)90134-0. [DOI] [PubMed] [Google Scholar]
- Bajo VM, Moore DR. Descending projections from the auditory cortex to the inferior colliculus in the gerbil, Meriones unguiculatus. J. Comp. Neurol. 2005;486:101–116. doi: 10.1002/cne.20542. [DOI] [PubMed] [Google Scholar]
- Berman AL. The Brainstem of the Cat. University of Wisconsin Press; Madison: 1968. [Google Scholar]
- Brückner S, Rübsamen R. Binaural response characteristics in isofrequency sheets of the gerbil inferior colliculus. Hearing Res. 1995;86:1–14. doi: 10.1016/0378-5955(95)00048-9. [DOI] [PubMed] [Google Scholar]
- Brunso-Bechtold JK, Thompson GC, Masterton RB. HRP study of the organization of auditory afferents ascending to the central nucleus of inferior colliculus in cat. J. Comp. Neurol. 1981;197:704–722. doi: 10.1002/cne.901970410. [DOI] [PubMed] [Google Scholar]
- Budinger E, Heil P, Scheich H. Functional organization of auditory cortex in the Mongolian gerbil (Meriones unguiculatus). IV. Connections with anatomically characterized subcortical structures. Eur. J. Neurosci. 2000;12:2452–2474. doi: 10.1046/j.1460-9568.2000.00143.x. [DOI] [PubMed] [Google Scholar]
- Cant NB. Projections from the cochlear nuclear complex to the inferior colliculus. In: Winer JA, Schreiner CE, editors. The Inferior Colliculus. Springer; 2005. pp. 115–131. [Google Scholar]
- Cant NB, Benson CG. An atlas of the inferior colliculus of the gerbil in three dimensions. Hearing Res. 2005;206:12–27. doi: 10.1016/j.heares.2005.02.014. [DOI] [PubMed] [Google Scholar]
- Casseday JH, Fremouw T, Covey E. The inferior colliculus: a hub for the central auditory system. In: Oertel D, Fay RR, Popper AN, editors. Integrative Functions in the Mammalian Auditory Pathway. Springer Handbook of Auditory Research. Vol. 15. Springer; New York: 2002. pp. 238–318. [Google Scholar]
- Chernock ML, Larue DT, Winer JA. A periodic network of neurochemical modules in the inferior colliculus. Hearing Res. 2004;188:12–20. doi: 10.1016/S0378-5955(03)00340-X. [DOI] [PubMed] [Google Scholar]
- Coleman JR, Clerici WJ. Sources of projections to subdivisions of the inferior colliculus in the rat. J. Comp. Neurol. 1987;262:215–226. doi: 10.1002/cne.902620204. [DOI] [PubMed] [Google Scholar]
- Davis KA. Evidence of a functionally segregated pathway from dorsal cochlear nucleus to inferior colliculus. J. Neurophysiol. 2002;87:1824–1835. doi: 10.1152/jn.00769.2001. [DOI] [PubMed] [Google Scholar]
- Ehret G. The auditory midbrain, a “shunting yard” of acoustical information processing. In: Ehret G, Romand R, editors. The Central Auditory System. Oxford University Press; New York: 1997. pp. 259–316. [Google Scholar]
- Faye-Lund H, Osen KK. Anatomy of the inferior colliuculus in rat. Anat. Embryol. 1985;171:1–20. doi: 10.1007/BF00319050. [DOI] [PubMed] [Google Scholar]
- Frisina RD, Walton JP, Lynch-Armour MA, Byrd JD. Inputs to a physiologically characterized region of the inferior colliculus of the young adult CBA mouse. Hearing Res. 1998;115:61–81. doi: 10.1016/s0378-5955(97)00176-7. [DOI] [PubMed] [Google Scholar]
- Gabriele ML, Brunso-Bechtold JK, Henkel CK. Development of afferent patterns in the inferior colliculus of the rat: projection from the dorsal nucleus of the lateral lemniscus. J. Comp. Neurol. 2000;416:368–382. doi: 10.1002/(sici)1096-9861(20000117)416:3<368::aid-cne8>3.0.co;2-c. [DOI] [PubMed] [Google Scholar]
- Glendenning KK, Masterton RB. Acoustic chiasm: efferent projections of the lateral superior olive. J. Neurosci. 1983;3:1521–1537. doi: 10.1523/JNEUROSCI.03-08-01521.1983. [DOI] [PMC free article] [PubMed] [Google Scholar]
- González-Hernández TH, Meyer G, Ferres-Torres R. Development of neuronal types and laminar organization in the central nucleus of the inferior colliculus in the cat. Neurosci. 1989;30:127–141. doi: 10.1016/0306-4522(89)90359-x. [DOI] [PubMed] [Google Scholar]
- Gonzalez-Lima F, Jones D. Quantitative mapping of cytochrome oxidase activity in the central auditory system of the gerbil: a study with calibrated activity standards and metal-intensified histochemistry. Brain Res. 1994;660:34–49. doi: 10.1016/0006-8993(94)90836-2. [DOI] [PubMed] [Google Scholar]
- Hancock KE, Voigt HF. Intracellularly labeled fusiform cells in dorsal cochlear nucleus of the gerbil. II. Comparison of physiology and anatomy. J. Neurophysiol. 2002;87:2520–2530. doi: 10.1152/jn.2002.87.5.2520. [DOI] [PubMed] [Google Scholar]
- Heffner RS, Koay G, Heffner HE. Audiograms of five species of rodents: implications for the evolution of hearing and the perception of pitch. Hearing Res. 2001;157:138–152. doi: 10.1016/s0378-5955(01)00298-2. [DOI] [PubMed] [Google Scholar]
- Henkel CK, Spangler KM. Organization of the efferent projections of the medial superior olivary nucleus in the cat as revealed by HRP and autoradiographic tracing methods. J. Comp. Neurol. 1983;221:416–428. doi: 10.1002/cne.902210405. [DOI] [PubMed] [Google Scholar]
- Henkel CK, Brunso-Bechtold JK. Laterality of superior olive projections to the inferior colliculus in adult and developing ferret. J. Comp. Neurol. 1993;331:458–468. doi: 10.1002/cne.903310403. [DOI] [PubMed] [Google Scholar]
- Hernández O, Espinosa N, Pérez-González D, Malmierca MS. The inferior colliculus of the rat: a quantitative analysis of monaural frequency response areas. Neurosci. 2005;132:203–217. doi: 10.1016/j.neuroscience.2005.01.001. [DOI] [PubMed] [Google Scholar]
- Hevner RF, Liu S, Wong-Riley MTT. A metabolic map of cytochrome oxidase in the rat brain: histochemical, densitometric and biochemical studies. Neurosci. 1995;65:313–342. doi: 10.1016/0306-4522(94)00514-6. [DOI] [PubMed] [Google Scholar]
- Kelly JB, Liscum A, van Adel B, Ito M. Projections from the superior olive and lateral lemniscus to tonotopic regions of the rat's inferior colliculus. Hearing Res. 1998;116:43–54. doi: 10.1016/s0378-5955(97)00195-0. [DOI] [PubMed] [Google Scholar]
- Kudo M. Projections of the nuclei of the lateral lemniscus in the cat: an autoradiographic study. Brain Res. 1981;221:57–69. doi: 10.1016/0006-8993(81)91063-5. [DOI] [PubMed] [Google Scholar]
- Kudo M, Nakamura Y. Organization of the lateral lemniscus fibers converging onto the inferior colliculus in the cat: an anatomical review. In: Syka J, Masterton RB, editors. Auditory Pathway. Structure and Function. Plenum Press; New York: 1988. pp. 171–183. [Google Scholar]
- Kuwada S, Batra R, Yin TCT, Oliver DL, Haberly LB, Stanford TR. Intracellular recordings in response to monaural and binaural stimulation of neurons in the inferior colliculus of the cat. J. Neurosci. 1997;17:7565–7581. doi: 10.1523/JNEUROSCI.17-19-07565.1997. [DOI] [PMC free article] [PubMed] [Google Scholar]
- Lay DM. The anatomy, physiology, functional significance and evolution of specialized hearing organs of Gerbilline rodents. J. Morphology. 1972;138:41–120. doi: 10.1002/jmor.1051380103. [DOI] [PubMed] [Google Scholar]
- Loftus WC, Bishop DC, Saint Marie RL, Oliver DL. Organization of binaural excitatory and inhibitory inputs to the inferior colliculus from the superior olive. J. Comp. Neurol. 2004;472:330–344. doi: 10.1002/cne.20070. [DOI] [PubMed] [Google Scholar]
- McAlpine D, Jiang D, Shackleton TM, Palmer AR. Convergent input from brainstem coincidence detectors onto delay-sensitive neurons in the inferior colliculus. J. Neurosci. 1998;18:6026–6039. doi: 10.1523/JNEUROSCI.18-15-06026.1998. [DOI] [PMC free article] [PubMed] [Google Scholar]
- Maffi CL, Aitkin LM. Differential neural projections to regions of the inferior colliculus of the cat responsive to high frequency sounds. Hearing Res. 1987;26:211–219. doi: 10.1016/0378-5955(87)90113-4. [DOI] [PubMed] [Google Scholar]
- Malmierca MS, Blackstad TW, Osen KK, Karagülle T, Molowny RL. The central nucleus of the inferior colliculus in rat: a Golgi and computer reconstruction study of neuronal and laminar structure. J. Comp. Neurol. 1993;333:1–27. doi: 10.1002/cne.903330102. [DOI] [PubMed] [Google Scholar]
- Meininger V, Pol D, Derer P. The inferior colliculus of the mouse. A Nissl and Golgi study. Neurosci. 1986;17:1159–1179. doi: 10.1016/0306-4522(86)90085-0. [DOI] [PubMed] [Google Scholar]
- Moore DR, Kitzes LM. Projections from the cochlear nucleus to the inferior colliculus in normal and neonatally cochlea-ablated gerbils. J. Comp. Neurol. 1985;240:180–195. doi: 10.1002/cne.902400208. [DOI] [PubMed] [Google Scholar]
- Moore DR, Russell FA, Cathcart NC. Lateral superior olive projections to the inferior colliculus in normal and unilaterally deafened ferrets. J. Comp. Neurol. 1995;357:204–216. doi: 10.1002/cne.903570203. [DOI] [PubMed] [Google Scholar]
- Morest DK, Oliver DL. The neuronal architecture of the inferior colliculus in the cat: defining the functional anatomy of the auditory midbrain. J. Comp. Neurol. 1984;222:209–236. doi: 10.1002/cne.902220206. [DOI] [PubMed] [Google Scholar]
- Nordeen KW, Killackey HP, Kitzes LM. Ascending auditory projections to the inferior colliculus in the adult gerbil, Meriones unguiculatus. J. Comp. Neurol. 1983;214:131–143. doi: 10.1002/cne.902140203. [DOI] [PubMed] [Google Scholar]
- Oliver DL. Neuron types in the central nucleus of the inferior colliculus that project to the medial geniculate body. Neurosci. 1984a;11:409–424. doi: 10.1016/0306-4522(84)90033-2. [DOI] [PubMed] [Google Scholar]
- Oliver DL. Dorsal cochlear nucleus projections to the inferior colliculus in the cat: a light and electron microscopic study. J. Comp. Neurol. 1984b;224:155–172. doi: 10.1002/cne.902240202. [DOI] [PubMed] [Google Scholar]
- Oliver DL. Projections to the inferior colliculus from the anterograde cochlear nucleus in the cat: possible substrates for binaural interaction. J. Comp. Neurol. 1987;264:24–46. doi: 10.1002/cne.902640104. [DOI] [PubMed] [Google Scholar]
- Oliver DL. Neuronal organization in the inferior colliculus. In: Winer JA, Schreiner CE, editors. The Inferior Colliculus. Springer; 2005. pp. 69–114. [Google Scholar]
- Oliver DL, Morest DK. The central nucleus of the inferior colliculus in the cat. J. Comp. Neurol. 1984;222:237–264. doi: 10.1002/cne.902220207. [DOI] [PubMed] [Google Scholar]
- Oliver DL, Kuwada S, Yin TCT, Haberly LB, Henkel CK. Dendritic and axonal morphology of HRP-injected neurons in the inferior colliculus of the cat. J. Comp. Neurol. 1991;303:75–100. doi: 10.1002/cne.903030108. [DOI] [PubMed] [Google Scholar]
- Oliver DL, Winer JA, Beckius GE, Saint Marie RL. Morphology of GABAergic neurons in the inferior colliculus of the cat. J. Comp. Neurol. 1994;340:27–42. doi: 10.1002/cne.903400104. [DOI] [PubMed] [Google Scholar]
- Oliver DL, Beckius GE, Bishop DC, Kuwada S. Simultaneous anterograde labeling of axonal layers from lateral superior olive and dorsal cochlear nucleus in the inferior colliculus of cat. J. Comp. Neurol. 1997;382:215–229. doi: 10.1002/(sici)1096-9861(19970602)382:2<215::aid-cne6>3.0.co;2-6. [DOI] [PubMed] [Google Scholar]
- Osen KK. Projection of the cochlear nuclei on the inferior colliculus in the cat. J. Comp. Neurol. 1972;144:355–372. doi: 10.1002/cne.901440307. [DOI] [PubMed] [Google Scholar]
- Park TJ. IID sensitivity differs between two principal centers in the interaural intensity difference pathway: the LSO and the IC. J. Neurophysiol. 1998;79:2416–2431. doi: 10.1152/jn.1998.79.5.2416. [DOI] [PubMed] [Google Scholar]
- Peruzzi D, Bartlett E, Smith PH, Oliver DL. A monosynaptic GABAergic input from the inferior colliculus to the medial geniculate body in rat. J. Neurosci. 1997;17:3766–3777. doi: 10.1523/JNEUROSCI.17-10-03766.1997. [DOI] [PMC free article] [PubMed] [Google Scholar]
- Peruzzi D, Sivaramakrishnan S, Oliver DL. Identification of cell types in brain slices of the inferior colliculus. Neurosci. 2000;101:403–416. doi: 10.1016/s0306-4522(00)00382-1. [DOI] [PubMed] [Google Scholar]
- Pollak GD, Burger RM, Park TJ, Klug A, Bauer EE. Roles of inhibition for transforming binaural properties in the brainstem auditory system. Hearing Res. 2002;168:60–78. doi: 10.1016/s0378-5955(02)00362-3. [DOI] [PubMed] [Google Scholar]
- Ramachandran R, Davis KA, May BJ. Single-unit responses in the inferior colliculus of decerebrate cats. I. Classification based on frequency response maps. J. Neurophysiol. 1999;82:152–163. doi: 10.1152/jn.1999.82.1.152. [DOI] [PubMed] [Google Scholar]
- Ramachandran R, May BJ. Functional segregation of ITD sensitivity in the inferior colliculus of decerebrate cats. J. Neurophysiol. 2002;88:2251–2261. doi: 10.1152/jn.00356.2002. [DOI] [PubMed] [Google Scholar]
- Ross LS, Pollak GD, Zook JM. Origin of ascending projections to an isofrequency region of the mustache bat's inferior colliculus. J. Comp. Neurol. 1988;270:488–505. doi: 10.1002/cne.902700403. [DOI] [PubMed] [Google Scholar]
- Ross LS, Pollak GD. Differential ascending projections to aural regions in the 60 kHz contour of the mustache bat's inferior colliculus. J. Neurosci. 1989;9:2819–2834. doi: 10.1523/JNEUROSCI.09-08-02819.1989. [DOI] [PMC free article] [PubMed] [Google Scholar]
- Roth GL, Aitkin LM, Andersen RA, Merzenich MM. Some features of the spatial organization of the central nucleus of the inferior colliculus of the cat. J. Comp. Neurol. 1978;182:661–680. doi: 10.1002/cne.901820407. [DOI] [PubMed] [Google Scholar]
- Ryan A. Hearing sensitivity of the Mongolian gerbil, Meriones unguiculatus. J. Acoust. Soc. Am. 1976;59:1222–1226. doi: 10.1121/1.380961. [DOI] [PubMed] [Google Scholar]
- Ryan AF, Woolf NK, Sharp FR. Tonotopic organization in the central auditory pathway of the Mongolian gerbil: a 2-deoxyglucose study. J. Comp. Neurol. 1982;207:369–380. doi: 10.1002/cne.902070408. [DOI] [PubMed] [Google Scholar]
- Ryan AF, Axelsson GA, Woolf NK. Central auditory metabolic activity induced by intense noise exposure. Hearing Res. 1992;61:24–30. doi: 10.1016/0378-5955(92)90032-i. [DOI] [PubMed] [Google Scholar]
- Saldaña E, Merchán MA. Intrinsic and commissural connections of the inferior colliculus. In: Winer JA, Schreiner CE, editors. The Inferior Colliculus. Springer; 2005. pp. 155–181. [DOI] [PubMed] [Google Scholar]
- Schreiner CE, Langner G. Periodicity coding in the inferior colliculus of the cat. II. Topographical organization. J. Neurophysiol. 1988;60:1823–1840. doi: 10.1152/jn.1988.60.6.1823. [DOI] [PubMed] [Google Scholar]
- Semple MN, Aitkin LM. Representation of sound frequency and laterality by units in central nucleus of cat inferior colliculus. J. Neurophysiol. 1979;42:1626–1639. doi: 10.1152/jn.1979.42.6.1626. [DOI] [PubMed] [Google Scholar]
- Shneiderman A, Henkel CK. Banding of lateral superior olivary nucleus afferents in the inferior colliculus: a possible substrate for sensory integration. J. Comp. Neurol. 1987;266:519–534. doi: 10.1002/cne.902660406. [DOI] [PubMed] [Google Scholar]
- Shneiderman A, Oliver DL, Henkel CK. Connections of the dorsal nucleus of the lateral lemniscus: an inhibitory parallel pathway in the ascending auditory system? J. Comp. Neurol. 1988;276:188–208. doi: 10.1002/cne.902760204. [DOI] [PubMed] [Google Scholar]
- Sivaramakrishnan S, Oliver DL. Distinct K currents result in physiologically distinct cell types in the inferior colliculus of the rat. J. Neurosci. 2001;21:2861–2877. doi: 10.1523/JNEUROSCI.21-08-02861.2001. [DOI] [PMC free article] [PubMed] [Google Scholar]
- Spirou GA, May BJ, Wright DD, Ryugo DK. Frequency organization of the dorsal cochlear nucleus in cats. J. Comp. Neurol. 1993;329:36–52. doi: 10.1002/cne.903290104. [DOI] [PubMed] [Google Scholar]
- Spitzer MW, Semple MN. Transformation of binaural response properties in the ascending auditory pathway: influence of time-varying interaural phase disparity. J. Neurophysiol. 1998;80:3062–3076. doi: 10.1152/jn.1998.80.6.3062. [DOI] [PubMed] [Google Scholar]
- Warr WB, de Olmos JS, Heimer L. Horseradish peroxidase. The basic procedure. In: Heimer L, Robards MJ, editors. Neuroanatomical Tract-Tracing Methods. Plenum Press; New York: 1981. pp. 207–262. [Google Scholar]
- Wenstrup JJ, Ross LS, Pollak GD. Binaural response organization within a frequency-band representation of the inferior colliculus: implications for sound localization. J. Neurosci. 1986;6:962–973. doi: 10.1523/JNEUROSCI.06-04-00962.1986. [DOI] [PMC free article] [PubMed] [Google Scholar]
- Winer JA, Schreiner CE, editors. The Inferior Colliculus. Springer; New York: 2005. [Google Scholar]
- Wong-Riley MTT. Changes in the visual system of monocularly sutured or enucleated cats demonstrable with cytochrome oxidase histochemistry. Brain Res. 1979;171::11–28. doi: 10.1016/0006-8993(79)90728-5. [DOI] [PubMed] [Google Scholar]