Abstract
Lymphoid tissue inducer (LTi) cells have a well established role in secondary lymphoid tissue development. Here, we report on the heterogeneity of LTi cells based on their CD4 and chemokine receptor expression. The CD4− LTi-cell population has a similar phenotype to the CD4+ population, with similar chemokine-receptor-expressing subsets. In both embryonic and adult spleen the CD4− LTi-cell population is comparable as a proportion of total splenocytes to its CD4+ counterpart. In contrast, different proportions of CD4+ and CD4− LTi cells are found in different lymph nodes. Both CD4+ and CD4− LTi cells share the anatomical location and are associated with vascular cell adhesion molecule-1-positive stromal cells in spleen and lymph nodes. The numbers of both CD4+ and CD4− LTi cells in adult spleen are augmented in the presence of B cells. With the exception of CD4, there is a strong correlation coefficient (0·89) for gene expression between the two populations. Polymerase chain reaction analysis of individual CD4+ and CD4− LTi cells shows that a similar proportion in embryonic and adult spleen co-expressed both CXCR5 and CCR7 or CXCR5 alone: 84·6% for adult CD4+ and 87·6% for adult CD4−; 95·3% for embryonic CD4+ and 91·5% for embryonic CD4−. Consistently fewer CCR7 single-positive cells were found in the CD4+ and CD4− fractions in the embryo.
Keywords: CCR7, CXCR5, lymphoid tissue inducer cell, tumour necrosis factor and tumour necrosis factor receptor family members
Introduction
The development of lymphoid tissues in embryonic life depends on a population of lymphoid tissue inducer (LTi) cells that colonize lymph node anlage and orchestrate the activation of stromal cell subpopulations.1,2 The activated stromal cells express the homeostatic chemokines that subsequently recruit lymphocytes and antigen-presenting cells to form lymphoid structures.1 Our studies have indicated that CD4+ LTi cells persist in adult life, where, in addition to their role in activating stromal cell expression of chemokines, they sustain primed CD4 T cells, particularly those linked with the generation of high-affinity memory antibody responses.3,4 T cells are only activated in the context of antigens presented by other cells. We have hypothesized that the dual function of adult LTi cells is in (1) activating the chemokine-mediated recruitment of T cells and antigen-presenting cells, and (2) enabling their survival, and is a cellular mechanism for creating microenvironments that support T-cell-dependent responses.5 The distinctive feature of CD4+ LTi cells is their constitutive antigen-independent expression of a set of tumour necrosis factor (TNF) family members. Although the receptors for these molecules share many common signalling pathways, the sets of TNF receptors through which CD4+ LTi cells activate stroma and T cells do not completely overlap. Our studies have linked the expression of OX40-ligand (L) and CD30L on these cells with the survival of CD4 T helper type 2 (Th2) primed cells in vitro and in vivo,3,6 and we have unpublished observations suggesting that sustained CD4 Th1 responses also depend on a combination of OX40 and CD30 signals.
Because previous studies have identified CD4− LTi-like cells in embryonic tissues,1,7–12 we sought to identify whether such a CD4− LTi population existed in adult lymphoid tissues. In this report we characterize a subset of CD4− adult LTi cells, and compare them with CD4− embryonic LTi cells and also embryonic and adult CD4+ LTi cells. With the exception of CD4, this population is genotypically and phenotypically very similar to CD4+ LTi cells, expressing identical profiles of TNF ligands and TNF receptors and common cytokine γ-chain receptors. This similarity extends to analysis of chemokine receptor genes expressed in single cells. Like embryonic CD4+ LTi cells, CD4− LTi cells lack expression of OX40L and CD30L, but the former is rapidly upregulated by signalling through the TNF receptor, DR3 (death receptor 3, TNFRSF25),13 expressed on CD4− LTi cells, as is the situation with CD4+ LTi cells. Both LTi populations are increased in the presence of B cells. In adult lymphoid tissues, CD4+ and CD4− LTi populations share similar locations, but compared with their embryonic counterparts, both have upregulated expression of CD69 and downregulated expression of the integrin α4/β7.
Materials and methods
Mice
All experiments were performed in accordance with UK laws and with the approval of the University of Birmingham Ethics Committee. Normal, RAG1−/− and T-cell-deficient mice14 were bred and maintained in our animal facility. T-cell-deficient mice generated by disturbing mouse CD3-ε expression with over 30 copies of the human CD3e gene have neither T cells nor natural killer cells.14
Preparation of CD4+ and CD4− LTi cells
Cell suspensions for isolation of CD4+ and CD4− LTi cells were made from the spleens of adult RAG−/− or T-cell-deficient mice. Briefly, CD11c+ cells were positively enriched by using CD11c-coated magnetic beads (Miltenyi Biotec, Bergisch Gladbach, Germany). Thy-1+ cells were enriched from CD11c+-depleted populations using Thy-1.2-coated magnetic beads (Miltenyi Biotec), and the resulting CD4+-enriched populations were sorted into CD4+ Thy-1+ CD3− CD27− B220− CD11c− (CD4+ LTi) and CD4− Thy-1+ CD3− CD27− B220− CD11c− (CD4− LTi) populations.
For the preparation of embryonic CD4+ and CD4− LTi cells, spleens were organ cultured in medium with or without 100 ng/ml interleukin-7 (IL-7; PeproTech EC, London, UK) on a 0·8-μm sterile nucleopore filter (Millipore, Watford, UK) in a 10% CO2 incubator for 7 days.
Fluorescence-activated cell sorting staining
Phycoerythrin (PE) -conjugated or biotinylated monoclonal antibodies (mAbs) against CD3 (145-2C11), CD8 (53-6.7), CD11c (HL3), CD27 (LG.3A10) and B220 (RA3-6B2) were used as exclusion markers, and allophycocyanin-conjugated anti-CD4 (GK1.5) and fluorescein isothiocyanate (FITC)-conjugated anti-Thy-1.2 FITC (30-H12) mAbs were used to detect CD4+ and CD4− LTi cells. The cells were stained with mAbs against α4/β7 integrin (DATK32), IL-7 receptor α (IL-7Rα; A7R34), CD69 (H1.2F3), OX40L (RM134L), CD30L (RM153), c-Kit (2B8) (BD Biosciences, Palo Alto, CA), and TRANCE (IK22/5) (eBiosciences, San Diego, CA).
Expression of DR3 was detected using polyclonal immunoglobulin G (IgG) goat anti-mouse DR3 (R&D Systems, Minneapolis, MN) and donkey anti-goat IgG Cy2 (Jackson Immunoresearch Laboratories, West Grove, PA).
To stain with lymphotoxin β-receptor–immunoglobulin (LTβR-Ig) or control-Ig fusion protein, cells were cultured in the presence of 100 ng/ml IL-7 for 7 days before staining with LTβR-Ig (a kind gift of Dr Jeff Browning; Biogen Idec, Cambridge, MA). The second-step reagent was goat anti-human IgG-FITC (Jackson Immunoresearch Laboratories). Prepared E15 cells were cultured with 100 ng/ml recombinant mouse TL1A (R&D Systems) for 2 days and then stained for flow cytometry analysis.
TaqMan low density array analysis
TaqMan primer sets are designed to work with an efficiency approaching 100%, enabling the quantitative comparison of messenger RNA (mRNA) expression for different genes not only within a cell type but also between cells of different lineages. Housekeeping genes (β-actin in these experiments) were used to correct for total mRNA (the level to which the β-actin signal was corrected in all mRNA samples).
TaqMan low-density real-time polymerase chain reaction (PCR) arrays (Applied Biosystems, Foster City, CA) were designed with a 96-gene format. A list of all the genes measured is as follows: chemokines (CCL19, CXCL12, CXCL13), chemokine receptors (CCR7, CXCR3, CXCR5), cytokines [IL-1α, IL-1β, IL-2, IL-3, IL-4, IL-5, IL-6, IL-7, IL-9, IL-10, IL-12p35, IL-12p40, IL-13, IL-15, IL-18, TSLP, interferon-α1 (IFN-α1), IFN-β, IFN-γ, transforming growth factor-β1), cytokine receptors (IL-2Rα, IL-2Rβ, IL-2Rγ, IL-4Rα, IL-7Rα, IL-10Rα, IL-10Rβ, IL-12Rβ1, IL-12Rβ2, IFN-γR1, IFN-γR2), costimulatory molecules (CD80, CD86, CTLA4, ICOS, ICOSL), dendritic cell marker (DC-SIGN, cathepsinS, integrin alpha x), house-keeping (CD4, β-actin, 18S), MHC class [β2-microglobulin (β2m), CD74], Toll-like receptor (TLR; MyD-88, TLR2, TLR3, TLR4, TLR5, TLR7, TLR9), TNF family (LTα, TNFα, LTβ, OX40L, CD40L, FASL, CD70, CD30L, 4-1BBL, TRANCE, TWEAK, APRIL, BAFF, LIGHT, TL1), TNFR family (TNFR1, TNFR2, LTβR, OX40, CD40, FAS, CD30, 4-1BB, RANK, TWEAKR, BAFFR, HVEM, GITR, DR3), transcription factor (Bcl-2, Bcl-6, Bcl-xL, RORγ, GATA3, foxP3, T-bet), others (perforin, granzymeB).
Complementary DNA (cDNA) was mixed with TaqMan Universal PCR Master Mix (Applied Biosystems). This was added to the TaqMan Low Density array, and PCR was performed in a 7900HT Fast Real-Time PCR System (Applied Biosystems) according to the manufacturer's recommendations.
The relative signal per cell was quantified by setting a threshold within the logarithmic phase of the PCR and determining the cycle number at which the fluorescence signal reached the threshold (Ct). The Ct for the target gene was subtracted from the Ct for β-actin. The relative amount was calculated as 2−ΔCt × 106.
Single-cell PCR analysis
Using an automatic cell deposition unit of a FACStar Plus (BD Biosciences) single cells were sorted into 384-well PCR plates containing 1 μl nuclease-free water. After sorting, the plates were stored frozen at −80°. Expression of CXCR5, CCR7 and β2m RNA was detected by real-time PCR. The following primers were used at limiting concentrations: CXCR5: forward ATATGGATGACCTGTACAAGGAACTG (60 nm), reverse CAGGCATGAATACCGCCTTAA (400 nm), CCR7: forward GGTGGCTCTCCTTGTCATTTTC (40 nm), reverse GTGGTATTCTCGCCGATGTAGTC (400 nm), β2m: forward CTGCAGAGTTAAGCATGCCAGTAT (100 nm), reverse ATCACATGTCTCGATCCCAGTAGA (100 nm).
The probe for CXCR5 was CCTTCTACAGTAACAGCACGGAGATTCCCCTAC labelled with CAL Fluor Orange 560 and Black Hole Quencher 1 (Biosearch Technologies, Novato, CA), for CCR7 it was TGCTTCTGCCAAGATGAGGTCACCG labeled with tetrachlorofluorescin (TET) and Black Hole Quencher 1 (Biosearch Technologies), and for β2m it was a NED labelled minor groove binder (MGB) probe CGAGCCCAAGACC (Applied Biosystems). Primers and probes were added to the lysate together with QuantiTect Multiplex reverse transcription-PCR buffer (Qiagen, Hilden, Germany) in a total volume of 5 μl. Reactions were run for 45 cycles in a 7500 Real-Time PCR System (Applied Biosystems). Relative quantification for gene expression in single cells was achieved by setting thresholds within the logarithmic phase of the PCR and determining the cycle number at which the threshold was reached (Ct). The relative amount of CXCR5 or CCR7 message to β2m in wells that showed a β2m product was plotted.
Immunofluorescence
Tissue samples for immunofluorescence were embedded in Tissue-Tek OCT compound (Bayer Healthcare, Newbury, UK) and 6-μm thick sections were cut and fixed in acetone. The mAbs used were anti-mouse Thy-1.2 biotin (clone 53-2.1), CD4 (clone GK1.5), and vascular cell adhesion molecule-1 (VCAM-1)-FITC (clone 429) (BD Biosciences). Anti-CD4 mAbs were directly conjugated using an Alexa Fluor 647 Monoclonal Antibody Labelling Kit (Invitrogen, Carlsbad, CA) according to the manufacturer's instructions. Biotinylated antibodies were detected using mouse anti-biotin-tetramethyl rhodamin isothiocyanate mAbs (Stratech Scientific Ltd, Newmarket, UK). The FITC-conjugated antibodies were detected using rabbit anti-FITC antibodies (Sigma, Welwyn Garden City, UK), then goat anti-rabbit-FITC antibodies (Southern Biotech, Birmingham, AL). Sections were mounted using Vectashield mounting medium (Vector Laboratories, Peterborough, UK). Confocal images were obtained at room temperature on a laser scanning microscope 510 Meta microscope (Zeiss, Welwyn Garden City, UK) equipped with either a 10 × and 40 × 1·4 numerical aperture water lens and 488, 543 and 633 lasers using Zeiss lsm software.
Results
CD4+ and CD4− LTi cells isolated from embryonic and adult spleens and lymph nodes display a similar phenotype
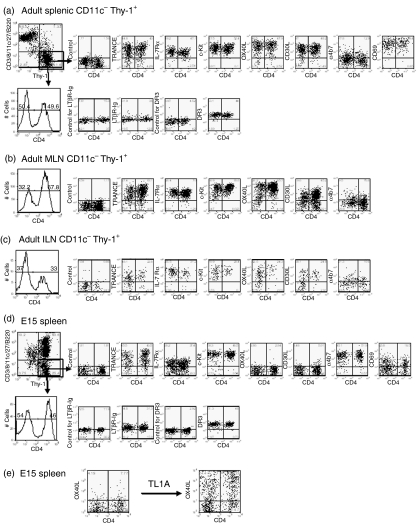
Because CD4+ LTi cells expressed Thy-1 at high levels,3 we reasoned that putative CD4− LTi populations would also express this molecule. To exclude T cells and dendritic cell (DC) populations, Thy-1+ cells were enriched from CD11c-depleted suspensions of T-cell-deficient adult mouse spleens. This population contained classical CD4+ LTi cells which expressed IL-7Rα, c-Kit and DR3 (TNFRSF25), as well as the classic set of TNF family members, lymphotoxin (LT) α1/β2, OX40L, CD30L and TNF-related activation-induced cytokine (TRANCE) (Fig. 1a). However, within the gated Thy-1+ fraction, we could identify a population with virtually identical phenotype that was clearly CD4− (Fig. 1a). CD4− LTi populations were also found in mesenteric and inguinal lymph nodes (Fig. 1b,c). Compared with spleen, which had similar numbers of CD4+ and CD4− LTi cells, mesenteric lymph nodes had proportionally more CD4+ LTi cells (two-fold), and inguinal lymph nodes had more CD4− LTi cells (two-fold).
Figure 1.
Phenotype of CD4+ and CD4− lymphoid tissue inducer (LTi) cells from adult and E15 spleens. (a–c) CD11c-depleted and Thy-1-enriched population from adult T-cell-deficient mouse spleens (a), mesenteric lymph nodes (b) and inguinal lymph nodes (c). (d) Embryonic (E15) splenocytes from wild-type mice cultured with interleukin-7 (IL-7) for 1 week. The results are representative of at least five separate experiments. For LTβR-Ig staining adult CD11c− Thy-1+ cells were cultured with IL-7 for 1 week. To test IL-7Rα surface expression, E15 spleens cultured with IL-7 were transferred into IL-7-free medium for 1 day before staining. (e) Upregulation of OX40L expression on E15 CD4+ and CD4− LTi cells after 2 days culture with 100 ng/ml TL1A. The results are representative of at least 10 separate experiments.
In the embryonic and neonatal spleen, CD4+ LTi cells lack expression of OX40L and CD30L and, unlike their adult counterparts, they lack expression of CD62L (data not shown), express low levels of CD69, and high levels of the mucosal addressin cell adhesion molecule-1 (MAdCAM-1) ligand, α4/β7. To identify whether CD4− LTi cells were also present in the embryo, we characterized Thy-1+ cells in the normal embryonic day 15 (E15) spleen. Lymphocytes and their precursors, DCs and plasmacytoid DCs, were excluded using an antibody cocktail of lineage markers: CD3, CD11c, CD8, CD27 and B220. The remaining Thy-1+ population could be divided by the cells’ expression of CD4 but they were identical to the embryonic CD4+ LTi cells by every other antibody criterion (Fig. 1d). In both adult and embryonic populations, similar numbers of CD4+ and CD4− LTi cells were identified: 11·7% CD4+ and 13·7% CD4− LTi cells in wild-type E15 splenocytes after culture with IL-7 for 7 days, and 0·7 to ∼ 0·8% CD4+ and 0·6 to ∼ 0·7% CD4− LTi cells in T-cell-deficient spleen by flow cytometry.
E15 embryonic CD4+ and CD4− LTi cells express comparable levels of TRANCE, IL-7Rα, c-Kit, LTα1/β2 and DR3 (TNFRSF25). As we have reported for CD4+ LTi cells,13 signalling through DR3 by recombinant TL1A (TNFSF15), the TNF ligand for DR3, upregulated the expression of OX40L on CD4− LTi cells (Fig. 1e).
CD4+ and CD4− LTi cells have near identical patterns of gene expression
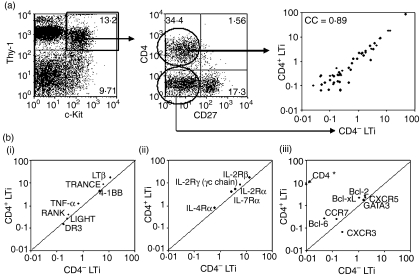
Our previous study had shown that the expression of mRNA in embryonic CD4+ LTi cells was strongly correlated with adult CD4+ LTi cells [correlation coefficient (CC) = 0·86] using TaqMan 96-gene arrays for a panel of immunity-related genes.13 These gene arrays were used to identify the genetic relationship between embryonic CD4+ and CD4− LTi cells. Thy-1+ c-Kit+ CD27− cells from E15 spleens were MoFlo™(BD Biosciences)-sorted on the basis of their expression of CD4 (Fig. 2a). The cross-correlation between gene expressions corrected to β-actin signals in CD4+ and CD4− LTi is very strong (CC = 0·89). The three groups of gene expression whose expression has been reported in CD4+ LTi cells3,15 were plotted; TNF and TNFR family members (Fig. 2b(i)), cytokine receptors of γc chain (Fig. 2b(ii)), and the chemokine receptors, Bcl-2 family members, GATA3 and CD4 (Fig. 2b(iii)). With the exception of CD4, the quantitative patterns of gene expression were virtually identical with the further exceptions of Bcl6 (more strongly expressed in CD4+ LTi cells) and CXCR3 (more strongly expressed in CD4− LTi cells). CD4 mRNA was undetectable in the CD4− LTi population (CD4 mRNA was 8·3% of the β-actin signal in CD4+ LTi cells) indicating that CD4 had not simply been shed or internalized on CD4− LTi populations.
Figure 2.
Correlation between gene expressions in CD4+ and CD4− lymphoid tissue inducer (LTi) cells isolated from wild-type E15 spleens. (a) CD4+ LTi (Thy-1+ CD4+ c-Kit+ CD27−) and CD4− LTi (Thy-1+ CD4−c-Kit+ CD27−) cells from wild-type E15 spleens were MoFlo-sorted and analysed their mRNA expressions by TaqMan 96-gene arrays for a panel of immunity-related genes (see Materials and methods). Over 0·01% expression of individual genes compared with β-actin mRNA signals (β-actin signal = 100%) was plotted. If the mRNA signal of a gene showed < 0·01% of β-actin signals, the gene was excluded from the plot. x and y axes show relative levels of mRNA expression of the two cell types being correlated by β-actin signals (β-actin signal = 100%). Correlation coefficient (CC) between CD4+ and CD4− LTi cells is 0·89. (b) Expression of (i) tumour necrosis factor (TNF) ligands and TNF receptors, (ii) common γ-chain cytokine receptors, and (iii) chemokine receptors, Bcl-2 family members, GATA, and CD4 in E15 CD4+ and CD4− LTi cells. * mRNA signals of CD4 in CD4− LTi cells were not detectable (below 0·01% of β-actin signals). Cross line inside graph indicates CC = 1.
Single-cell PCR on LTi-cell populations to examine the heterogeneity of CXCR5 and CCR7 expression
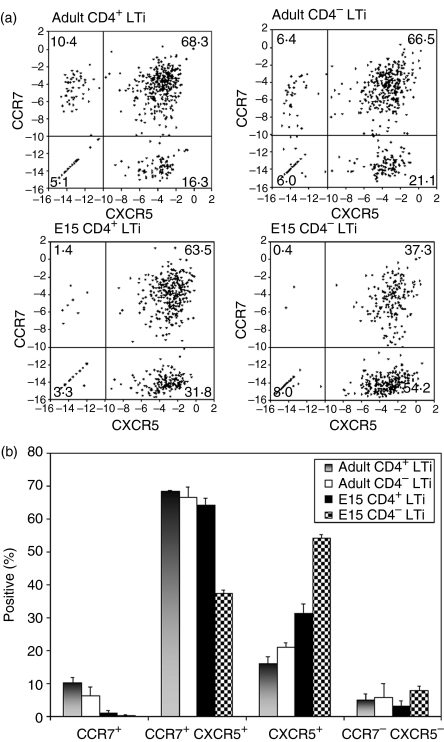
Although the CD4+ and CD4− LTi cells expressed similar genotypes and phenotypes at the population level (Figs 1 and 2), it was possible that they varied in their expression of chemokine receptors. For example, localization of lymphocytes is determined by relative levels of expression of CXCR5 and CCR7: CXCR5+ localizing in B follicles, CCR7+ localizing in the T-cell area, and CCR7+ CXCR5+ localizing at the B-cell : T-cell interface. We have described CD4+ LTi cells localizing in all of the above locations3 and anticipated therefore that, like lymphocytes, there might be differential expression of chemokine receptors. Comparing chemokine receptor expression in LTi-cell subsets was one way of discovering differences between them. Because the murine antibodies available to CXCR5 and CCR7 gave poor staining not only on LTi cells but also on lymphocytes, we quantified chemokine receptor mRNA expression in MoFlo-sorted single CD4+ and CD4− LTi cells (525 total for each population in three separate 175 cell sorts). Three genes were quantified by PCR in individual cells; β2m (control mRNA), CXCR5 and CCR7. The overall efficiency as assessed by positive β2m signal (cut-off Ct value of 34 for β2m) was 94% for CD4+ and 98% for CD4− adult LTi cells. The respective values for E15 populations were 93% and 92%. In these positive wells, the expression of CXCR5 was plotted against CCR7 after correction for β2m [Ct value of β2m – Ct value of chemokine receptor (log 2)]. A value of zero represents a level of chemokine receptor expression identical to that for β2m (100%), and of −3 equals 12·5% (Fig. 3a). A cut-off point for negative expression was made at −10 (∼ 0·1% of the β2m signal), clearly delineating four populations within the four quadrants (Fig. 3a). To assess inter-experiment variability, we compared the total quadrant distribution in the three separate experiments of 175 cells and measured the standard deviation in the percentages of the individual subsets (Fig. 3b). This revealed little experimental variation, increasing our confidence that the populations observed and the differences between LTi-cell subsets were real.
Figure 3.
Single-cell polymerase chain reaction for the expression of CCR7 and CXCR5 in CD4+ and CD4− lymphoid tissue inducer (LTi) cells isolated from adult T-cell-deficient but B-cell-sufficient spleens and wild-type E15 spleens. (a) Expression of CXCR5 and CCR7 in 492 adult CD4+ LTi, 516 adult CD4− LTi, 488 E15 CD4+ LTi, and 485 E15 CD4− LTi cells. The expression of CXCR5 (x axis) was plotted against CCR7 (y axis) after normalization to β2-microglobulin (β2m) signals [Ct value of β2m –Ct value of chemokine receptor (log 2)]. Each dot indicates the gene expression of a single cell. For each population, 525 total single cells were MoFlo-sorted in three separate plates (175 cells/plate). (b) Percentage of CCR7+ CXCR5−, CCR7+ CXCR5+, CCR7− CXCR5+, and CCR7− CXCR5− cells in four LTi populations from the three separate experiments. Error bar shows the standard deviation.
The proportion of chemokine-receptor-negative cells did not vary significantly between LTi-cell subsets and probably represents technical failures rather than revealing a real population, as the chemokine receptors are expressed at a lower level than β2m. All E15 and adult LTi-cell populations clearly have two distinct populations that either express CXCR5+ alone or are dual expressers (CXCR5+ CCR7+). This is consistent with our initial observation that CD4+ LTi cells localize both within B follicles and at the B-cell : T-cell interface3, and suggests that adult CD4− LTi cells have a similar distribution. There was no significant difference in the proportions of adult LTi cells expressing both CXCR5 and CCR7 (68·3% for CD4+ LTi versus 66·5% for CD4− LTi) but CD4− LTi cells had more CXCR5+ LTi cells (21·1% versus 16·3%) (P < 0·05). This trend was reversed for the small CCR7+ population present in both adult populations but missing from E15 populations.
E15 LTi cells had a higher proportion of single-positive CXCR5+ LTi cells than their respective adult counterparts [31·8% for E15 versus 16·3% for adult CD4+ LTi cells (P = 0·003); 54·2% for E15 versus 21·1% for adult CD4− LTi cells (P = 0·002)]. The E15 CD4− LTi cells were also more frequently CXCR5+ than their E15 CD4+ counterparts (54·2% versus 31·8% (P = 0·001).
Whereas the adult LTi cells populations were broadly similar, the E15 CD4+/− LTi cells were more often CXCR5+, and this positivity was biased to the CD4− subset. A less marked bias in the same direction was also evident in adult CD4− cells. Compared with CD4− LTi cells, CD4+ LTi cells were more likely to be CCR7+ and the single-positive CCR7+ population only clearly appeared in adult spleen.
CD4+ and CD4− LTi cells are mainly found at the B-cell : T-cell interface in lymph nodes and spleen and interact with VCAM-1+ stroma
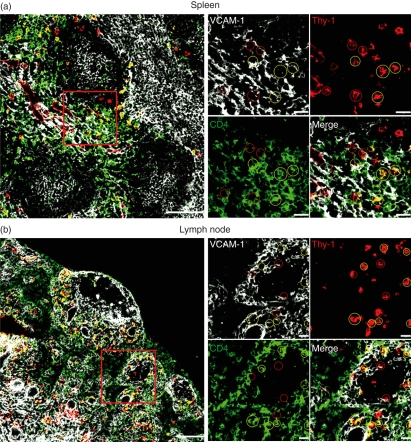
The majorities of both LTi subpopulations co-expressed CXCR5 and CCR7, a phenotype that localizes lymphocytes at the B-cell : T-cell interface.16 Consistent with this, confocal microscopy of adult spleen and mesenteric lymph nodes showed that most LTi cells (defined by their expression of Thy-1 and CD4) were located at the B-cell : T-cell interface. These cells also expressed high levels of IL-7Rα (not depicted). Both CD4+ and CD4− LTi cells in spleen and lymph nodes were co-localized with VCAM-1+ stromal cells (Fig. 4).
Figure 4.
Both CD4+ and CD4− lymphoid tissue inducer (LTi) cells interact with vascular cell adhesion molecule 1-positive (VCAM-1+) stroma in the spleen and lymph node. Spleen (a) and mesenteric lymph node (b) from T-cell-deficient mice stained for expression of VCAM-1 (white), Thy-1 (red) and CD4 (green). CD4+ LTi cells are indicated in yellow circles, and CD4− LTi cells in red circles. Left-hand panels show low-power image, scale bar represents 100 μm; right-hand panels show high-power image of demarcated area, scale bar represents 20 μm.
Lack of evidence for a precursor product relationship between LTi subpopulations
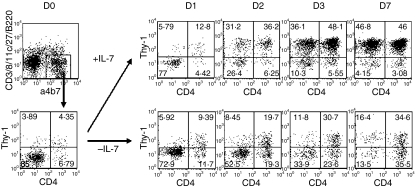
Freshly isolated E15 splenocytes contain a similar number of CD4+ and CD4− LTi cells (1·14% and 1·02% of total splenocytes) (Fig. 5). Previous experiments have indicated that IL-7 increases the numbers of CD4+ LTi cells.17 To test the effect of IL-7 on the development of CD4− LTi cells, E15 spleens were organ-cultured with or without IL-7 for up to 7 days. After 2 days, the number of α4 β7+ lineage− LTi cells was increased by IL-7 (CD4+ : CD4− LTi cells = 6·05% : 5·21% of total splenocytes) and 7 days after culture, CD4+ and CD4− LTi cells reached 11·94% and 12·85% of total splenocytes, respectively. Under all culture conditions, there was no cell population which expressed intermediate levels of CD4, indicating a transition from CD4+ to CD4− LTi cells, or vice versa (Figs 1d and 5). In the absence of IL-7, the viability of CD4− LTi cells was less than of CD4+ LTi cells, but both populations showed better survival than other populations: CD4− LTi cells were 3·00% and CD4+ LTi cells were 6·33% of total splenocytes.
Figure 5.
Development of embryonic CD4+ and CD4− lymphoid tissue inducer (LTi) cells by interleukin-7 (IL-7). E15 spleens were organ cultured with or without IL-7 up to 7 days and stained for α4 β7, lineage marker (lin; CD3, CD8, CD11c, CD27, and B220), CD4 and Thy-1. The α4 β7+ lin− cells were gated. The results are representative of at least three separate experiments.
The numbers of CD4+ and CD4− LTi cells in the spleen are augmented in the presence of B cells
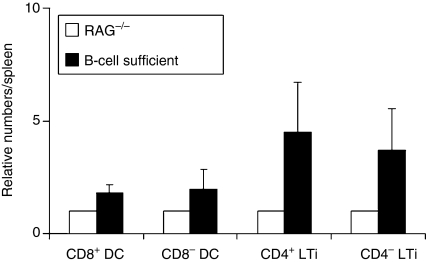
Previously, we have reported that the yield of CD4+ LTi cells from B-cell sufficient mice was greater than from RAG−/− mice, suggesting that the presence of lymphocytes influences LTi cell numbers.17 Because of the difficulties in isolating LTi cells from mice with T cells, we used T-cell-deficient mice to examine the effects of B cells on CD4− total LTi cell numbers and compared them with CD4+ LTi cells. To control for differences in isolation procedures, we made a cell preparation from spleens that were age- and sex-matched: one from a CD45.2 RAG−/− mouse and one from a CD45.1 T-cell-deficient but B-cell-sufficient mouse.14 Isolation of CD4+ and CD4− LTi cells from this mixture revealed that on average there were 4·5 : 1 and 3·7 : 1, respectively, excess of cells derived from the B-cell-sufficient mouse, indicating a clear effect of B cells on splenic CD4+ and CD4− LTi cell numbers (Fig. 6). In comparison, the numbers of CD8+ or CD8− DCs in this mixture showed less difference (1·79 : 1 and 1·93 : 1, respectively).
Figure 6.
Relative cell numbers of adult CD8+ DCs, CD8− DCs, CD4+ and CD4− lymphoid tissue inducer (LTi) cells in B-cell-sufficient mice to RAG−/− mice. Age- and sex-matched RAG−/− (CD45.2) and B-cell-sufficient (CD45.1) adult mouse spleens were mixed and prepared for the isolation of the cells. The mixed cells were distinguished by allotypic marker, CD45. CD11c-enriched population was stained for CD45.1, CD11c, and CD8 (CD45.1+ CD11c+ CD8+ = CD8+ DCs and CD45.1+ CD11c+ CD8− = CD8− DCs from B-cell-sufficient mouse, and CD45.1− CD11c+ CD8+ = CD8+ DCs and CD45.1− CD11c+ CD8− = CD8− DCs from RAG−/− mouse). CD11c-depleted and Thy-1-enriched population was stained for CD45.1, Thy-1, CD4, and all lineage (lin) makers (CD45.1+ Thy-1+ CD4+ lin− = CD4+ LTi and CD45.1+ Thy-1+ CD4− lin− = CD4− LTi cells from B-cell-sufficient mouse, and CD45.1− Thy-1+ CD4+ lin− = CD4+ LTi and CD45.1− Thy-1+ CD4− lin− = CD4− LTi cells from RAG−/− mouse). The relative cell number of each population from B-cell-sufficient mouse was corrected to that from RAG−/− mouse (the cell number of each population from RAG−/− mouse is 1). The results are the average of five separate experiments and error bar shows the standard deviation.
Discussion
In this report, we have characterized a distinct CD4− LTi cell-subset with a phenotype that is shared with the CD4+ LTi cells characterized previously by us3,4,13,17 and others1,7–12 in the developing immune system. This population is present in both embryonic and adult spleen in similar proportions to the CD4+ population. The important differences that we have identified between adult and embryonic populations are shared between the LTi subsets: adult LTi populations express higher levels of CD69 and lack expression of α4/β7, the integrin ligand for MAdCAM-1. We have reported that adult CD4+ LTi cells are found tightly associated with VCAM-1+ stromal cells;4 their high expression of CD69 is consistent with the described function of this molecule in retention in lymphoid tissues.18 In contrast, although E15 embryonic LTi cells have colonized the mouse embryonic spleen, they do not express CD69, but do express high levels of α4/β7 and interact with stromal populations expressing MAdCAM-1, the α4/β7 ligand.7
Detailed phenotypic expression of a range of surface molecules revealed no significant differences between CD4+ and CD4− LTi-cell populations in either the embryo or adult. In particular, we found no evidence of transition from a CD4− to a CD4+ phenotype or vice versa, either by surface staining for protein or by CD4 mRNA expression, indicating that the CD4− fraction had not simply downregulated expression of CD4 protein from the cell surface. Previously we have demonstrated that TL1A, the ligand for the TNF receptor family member DR3, upregulates the expression of the TNF ligand, OX40L on E15 CD4+ LTi cells:13 this was also the case for the CD4− subset.
Phenotypic similarities were confirmed by a strong correlation in the quantitative pattern of expression for an array of immunity-related genes.13 This was particularly strong for expression of the TNF family members and the common γ-chain cytokine receptors, but was also true for other immune genes, the exception being CD4. Unlike CD4+ LTi cells, adult CD4− LTi cells in lymph nodes showed some heterogeneity in expression of CD30L and OX40L, whereas all CD4− LTi cells in the spleen expressed CD30L and OX40L. We have previously reported that in neonatal life, LTi cells lack expression of CD30L and OX40L,17 and this helps to explain neonatal tolerance. One interesting possibility is that the CD4− LTi cells in lymph nodes might be important for maintaining self-tolerance to peripherally expressed antigens. The questions are under investigation and remain to be answered.
We have previously found that B lymphocytes positively affect the yield of CD4+ LTi cells,17 indicating potential feedback between these two cell types. Although T cells might also affect LTi-cell numbers, this is hard to test for because it is technically very difficult to isolate LTi populations in the presence of T cells. However, we did find that CD4− LTi-cell numbers were similarly augmented if they developed in the presence of B cells. Proportions of CD8+ and CD8− DC subsets were also positively affected by B cells but to little more than half the extent of LTi-cell populations, with little difference observed for CD4+ and CD4− LTi cells.
Using CXCR5 and CCL19-IgG to stain CD4+ LTi-cell populations, others have concluded that LTi cells express both CXCR5 and CCR7.19 However, the level of staining was not clear enough to identify the heterogeneity. We found three populations of LTi cells: single expressers expressing CXCR5+ or CCR7+ and dual expressers, CXCR5+ CCR7+, with the latter the major population. We do not think this result is an artefact because consistent inter-experimental results were obtained, and there were clear and consistent differences between embryonic and adult LTi cells. Furthermore, because the PCR was quantitative, one would have expected a smear between the chemokine-receptor-expressing populations if this was an artefact, but the three populations were quite clearly defined. Consistent with the dual expression of CXCR5 and CCR7 on the majority of CD4+ and CD4− LTi cells, both subpopulations were concentrated at the B-cell : T-cell interface in spleen and lymph node, but some were also found in B-cell follicles and the central T-cell zone.
In the embryo, a higher proportion of LTi cells, particularly those that are CD4−, express CXCR5 only. It is possible that some of these cells are in transit to other locations. For example, CXCR5 expression in LTi cells is important for Peyer's patch formation.20 What is striking is that very few embryonic LTi cells express CCR7 alone.
In summary, we demonstrate the existence of a second LTi subset present in adult spleen and lymph node. The fact that there exist two LTi populations distinguished by CD4 suggests that there is a functional role for this molecule. This is under investigation.
Acknowledgments
This work was supported by a Wellcome Programme Grant to P. Lane and G. Anderson, and by the Soongsil University Research Fund to M-Y. Kim.
References
- 1.Mebius RE. Organogenesis of lymphoid tissues. Nat Rev Immunol. 2003;3:292–303. doi: 10.1038/nri1054. [DOI] [PubMed] [Google Scholar]
- 2.Cupedo T, Mebius RE. Cellular interactions in lymph node development. J Immunol. 2005;174:21–5. doi: 10.4049/jimmunol.174.1.21. [DOI] [PubMed] [Google Scholar]
- 3.Kim MY, Gaspal FM, Wiggett HE, et al. CD4(+)CD3(−) accessory cells costimulate primed CD4 T cells through OX40 and CD30 at sites where T cells collaborate with B cells. Immunity. 2003;18:643–54. doi: 10.1016/s1074-7613(03)00110-9. [DOI] [PubMed] [Google Scholar]
- 4.Kim MY, McConnell FM, Gaspal FM, et al. Function of CD4 + CD3− cells in relation to B- and T-zone stroma in spleen. Blood. 2007;109:1602–10. doi: 10.1182/blood-2006-04-018465. [DOI] [PubMed] [Google Scholar]
- 5.Lane PJ, Gaspal FM, Kim MY. Two sides of a cellular coin: CD4(+)CD3− cells regulate memory responses and lymph-node organization. Nat Rev Immunol. 2005;5:655–60. doi: 10.1038/nri1665. [DOI] [PMC free article] [PubMed] [Google Scholar]
- 6.Gaspal FM, Kim MY, McConnell FM, Raykundalia C, Bekiaris V, Lane PJ. Mice deficient in OX40 and CD30 signals lack memory antibody responses because of deficient CD4 T cell memory. J Immunol. 2005;174:3891–6. doi: 10.4049/jimmunol.174.7.3891. [DOI] [PubMed] [Google Scholar]
- 7.Mebius RE, Rennert P, Weissman IL. Developing lymph nodes collect CD4 + CD3− LTbeta+ cells that can differentiate to APC, NK cells, and follicular cells but not T or B cells. Immunity. 1997;7:493–504. doi: 10.1016/s1074-7613(00)80371-4. [DOI] [PubMed] [Google Scholar]
- 8.Eberl G, Marmon S, Sunshine MJ, Rennert PD, Choi Y, Littman DR. An essential function for the nuclear receptor RORgamma(t) in the generation of fetal lymphoid tissue inducer cells. Nat Immunol. 2004;5:64–73. doi: 10.1038/ni1022. [DOI] [PubMed] [Google Scholar]
- 9.Eberl G, Littman DR. Thymic origin of intestinal alphabeta T cells revealed by fate mapping of RORgammat+ cells. Science. 2004;305:248–51. doi: 10.1126/science.1096472. [DOI] [PubMed] [Google Scholar]
- 10.Yoshida H, Honda K, Shinkura R, Adachi S, Nishikawa S, Maki K, Ikuta K, Nishikawa SI. IL-7 receptor alpha+ CD3(−) cells in the embryonic intestine induces the organizing center of Peyer's patches. Int Immunol. 1999;11:643–55. doi: 10.1093/intimm/11.5.643. [DOI] [PubMed] [Google Scholar]
- 11.Yoshida H, Kawamoto H, Santee SM, et al. Expression of alpha(4)beta(7) integrin defines a distinct pathway of lymphoid progenitors committed to T cells, fetal intestinal lymphotoxin producer, NK, and dendritic cells. J Immunol. 2001;167:2511–21. doi: 10.4049/jimmunol.167.5.2511. [DOI] [PubMed] [Google Scholar]
- 12.Luther SA, Ansel KM, Cyster JG. Overlapping roles of CXCL13, interleukin 7 receptor alpha, and CCR7 ligands in lymph node development. J Exp Med. 2003;197:1191–8. doi: 10.1084/jem.20021294. [DOI] [PMC free article] [PubMed] [Google Scholar]
- 13.Kim MY, Toellner KM, White A, et al. Neonatal and adult CD4 + CD3− cells share similar gene expression profile, and neonatal cells up-regulate OX40 ligand in response to TL1A (TNFSF15) J Immunol. 2006;177:3074–81. doi: 10.4049/jimmunol.177.5.3074. [DOI] [PubMed] [Google Scholar]
- 14.Wang B, Biron C, She J, Higgins K, Sunshine MJ, Lacy E, Lonberg N, Terhorst C. A block in both early T lymphocyte and natural killer cell development in transgenic mice with high-copy numbers of the human CD3E gene. Proc Natl Acad Sci USA. 1994;91:9402–6. doi: 10.1073/pnas.91.20.9402. [DOI] [PMC free article] [PubMed] [Google Scholar]
- 15.Lane PJ, Kim MY, Gaspal FM, McConnell FM. CD4(+)CD3(−) cells regulate the organization of lymphoid tissue and T-cell memory for antibody responses. Int J Hematol. 2006;83:12–6. doi: 10.1532/IJH97.05117. [DOI] [PubMed] [Google Scholar]
- 16.Reif K, Ekland EH, Ohl L, Nakano H, Lipp M, Forster R, Cyster JG. Balanced responsiveness to chemoattractants from adjacent zones determines B-cell position. Nature. 2002;416:94–9. doi: 10.1038/416094a. [DOI] [PubMed] [Google Scholar]
- 17.Kim MY, Anderson G, White A, Jenkinson E, Arlt W, Martensson IL, Erlandsson L, Lane PJ. OX40 ligand and CD30 ligand are expressed on adult but not neonatal CD4 + CD3– inducer cells: evidence that IL-7 signals regulate CD30 ligand but not OX40 ligand expression. J Immunol. 2005;174:6686–91. doi: 10.4049/jimmunol.174.11.6686. [DOI] [PubMed] [Google Scholar]
- 18.Shiow LR, Rosen DB, Brdickova N, Xu Y, An J, Lanier LL, Cyster JG, Matloubian M. CD69 acts downstream of interferon-alpha/beta to inhibit S1P1 and lymphocyte egress from lymphoid organs. Nature. 2006;440:540–4. doi: 10.1038/nature04606. [DOI] [PubMed] [Google Scholar]
- 19.Ohl L, Henning G, Krautwald S, Lipp M, Hardtke S, Bernhardt G, Pabst O, Forster R. Cooperating mechanisms of CXCR5 and CCR7 in development and organization of secondary lymphoid organs. J Exp Med. 2003;197:1199–204. doi: 10.1084/jem.20030169. [DOI] [PMC free article] [PubMed] [Google Scholar]
- 20.Forster R, Mattis AE, Kremmer E, Wolf E, Brem G, Lipp M. A putative chemokine receptor, BLR1, directs B cell migration to defined lymphoid organs and specific anatomic compartments of the spleen. Cell. 1996;87:1037–47. doi: 10.1016/s0092-8674(00)81798-5. [DOI] [PubMed] [Google Scholar]


