

Abstract
Polymer therapeutics has emerged as a new clinical option for the treatment of human diseases. However, little is known about pharmacogenetic responses to drugs formulated with polymers. In this study, we demonstrate that a formulation containing the block copolymer Pluronic P85 and antineoplastic drug, doxorubicin (Dox), prevents the development of multidrug resistance in the human breast carcinoma cell line, MCF7. Specifically, MCF7 cells cultured in the presence of Pluronic were unable to stably grow in concentrations of Dox that exceeded 10ng Dox/ml of culture media. In sharp contrast, MCF7 cells cultured in the absence of the block copolymer resulted in the selection and stable growth of cells that tolerated 1000 times higher concentration of the drug (10,000ng Dox/ml culture media). Detailed characterization of the isolated sublines demonstrated that those cells selected in the polymer-drug formulation did not show amplification of the MDR1 gene, likely resulting in their high sensitivity to the drug. Conversely, cells selected with Dox alone showed an elevated level in the expression of the MDR1 gene along with a corresponding increase in the expression level of the drug efflux transporter, Pgp, and likely contributing to the high resistance of the cells to Dox. Global analysis of the expression profiles of 20K genes by DNA microarray revealed that the use of Pluronic in combination with Dox drastically changed the direction and magnitude of the genetic response of the tumor cells to Dox and may potentially enhance therapeutic outcomes. Overall, this study reinforces the need for a thorough assessment of pharmacogenomic effects of polymer therapeutics.
Keywords: multidrug resistance, P-glycoprotein, Pluronic, poloxamer, polymer genomics
Introduction
Polymer-based drug delivery systems have emerged from the laboratory bench in the 90’s as a promising therapeutic strategy for the treatment of cancer and other devastating diseases.1–4 The polymers used in such formulations are considered as biologically inert components that protect drugs from degradation, prolong exposure of drugs to tissues, and enhance the transport of drugs into cells. However, this paradigm is undergoing a substantial evolution due to growing evidence that synthetic polymers when combined with biological agents (DNA, low molecular mass drugs, or antigens) can alter specific cellular responses to these agents. One notable example is A-B-A block copolymers of poly-(ethylene oxide) (A) and poly-(propylene oxide) (B), termed “Pluronics” or “poloxamers”, which were shown to sensitize multidrug resistant (MDR) cancer cells to antineoplastic agents.5–8 Pluronics, due to their lipid-like amphiphilic nature, effectively incorporate into cellular membranes and inhibit drug efflux transport proteins, such as P-glycoprotein (Pgp) that hinder entry of antineoplastic agents in MDR cells.8 In addition Pluronic induces intracellular ATP depletion in MDR cells thus depriving these cells from the source of energy necessary for the function of Pgp and other cellular defense mechanisms.7 The synergy between these two effects results in the strong chemosensitization of MDR tumors. The use of Pluronic in chemotherapy of the MDR tumors has reached clinical evaluation stages.9,10 In the current study, we demonstrate for the first time that Pluronic P85 (P85) alters genetic responses of cancer cells to the antineoplastic agent, doxorubicin (Dox), and prevents the development of multidrug resistance in the cells exposed to the drug.
Experimental Section
Development of the Resistant Cell Lines
Human breast carcinoma MCF7 cells were seeded (1×10⁶) in a 75-cm2 tissue culture flask containing DMEM with 10% FBS and supplemented with either Dox alone or Dox formulated with 0.001% P85 and incubated at 37°C in a humidified, 5% CO2 atmosphere. When the cells grew to at least 80% confluency, they were harvested by trypsinization, 1×10⁶ cells were reseeded, and the Dox dose was increased. In this manner, several cell lines, MCF7/Dox, MCF7/Dox-P85, and MCF7/P85 were developed. The maximally tolerated drug doses during the selection process were 10,000ng/ml for Dox alone and only 10ng/ml Dox in P85 solution.
Western Blot Analysis
Determination of Pgp expression levels in the selected cell lines was performed using the immunoblot technique described previously.7 The monoclonal antibodies to Pgp, C219 (Dako Corp., Carpinteria, CA), were used at 1:100 dilution. The monoclonal antibodies to β-actin, anti-β-1-chicken integrin (Sigma, Inc.), were used at 1:200 dilution. The secondary horseradish peroxide anti-mouse Ig antibodies (1:1500 dilution) were purchased from Amersham Life Sciences (Cleveland, OH). Specific protein bands were visualized using a chemiluminescence kit (Pierce, Rockford, IL). The levels of Pgp expression were quantitated by densitometry (Nucleo Vision, Nucleo Tech, Curitiba-Pr., Brazil). To correct for loading differences, the levels of proteins were normalized to the constitutively expressed β-actin.
Rhodamine 123 (R123) Accumulation Studies
R123 accumulation in the cells was examined as previously described.11 Briefly, confluent cell monolayers were preincubated for 30 min at 37°C in assay buffer containing: 122 mM sodium chloride, 25 mM sodium bicarbonate, 10 mM glucose, 10 mM HEPES, 3mM potassium chloride, 1.2 mM magnesium sulfate, 1.4 mM calcium chloride, and 0.4 mM potassium phosphate dibasic, pH 7.4. Subsequently, the assay buffer was removed and the cell monolayers were exposed to 3.2 μM R123 in fresh assay buffer for 60 min. After incubation, the cell monolayers were washed three times with ice-cold PBS and solubilized in Triton X-100 (1.0 %). Aliquots were removed for determination of the cellular dye content using a Shimadzu RF5000 fluorescent spectrophotometer (λex = 505 nm, λem = 540 nm) and for determination of the cellular protein content using the Pierce BCA assay. All experiments were performed in quadruplicate.
Real-Time RT-PCR (RT2-PCR)
Total RNA was isolated from each cell line using TRIzol reagent (Life Technologies, Inc., Gaithersburg, MD) according to the manufacturer’s protocol. The RNA samples were treated with DNase I and transcribed into cDNA using reverse transcriptase (M-MLV), as described elsewere.12 The level of expression of MDR1 and GSTP1 genes relative to the housekeeping gene, GAPDH (glyceraldehyde-3-phosphate dehydrogenase), were measured using an ABI Prism 7000 sequence detector (Applied Biosystems, Foster City, CA). Primers for target and housekeeping genes were designed using Primer Express software (Applied Biosystems), as shown in Table 1. Real-time PCR was performed with the SYBR Green PCR Master Mix (Applied Biosystems). Serial dilutions of cDNA from MCF7/Dox (10,000ng/ml) were used to construct standard curves for the target genes and the endogenous reference gene (GAPDH). For each unknown sample, the relative amount of target cDNAs and reference cDNAs applied to the PCR reaction system were calculated using linear regression analysis from the corresponding standard curves.
Table 1.
Primers Used for Real-Time RT-PCR
Cytotoxicity assay
To examine the levels of resistance in the selected cell lines, the cells were seeded in 96-well plates at a density of 5000 cells/well and allowed to attach overnight. The following day, cells were treated with either Dox alone or Dox formulated with 0.1 % wt P85 and incubated for 2 hours at 37°C in a humidified, 5% CO2 atmosphere. Following treatment, the cells were washed three times and cultured for three days in fresh medium absent of the drug and P85. The cytotoxic activity of Dox was then evaluated using a standard MTT assay.13 The absorbency at λ = 450nm was determined using a microKinetics Reader BT 2000. Each concentration point was determined from samplings from eight separate wells. SEM values were less than 10%.
Determination of intracellular ATP
Cell monolayers were grown in 24-well plates until confluent. On the day of treatment, the medium was replaced with the assay buffer for 30 minutes. Subsequently, the assay buffer was removed and the cells were exposed to various P85 solutions (0.0001 % to 5 % wt.) for 2 hr. Following treatment, the cells were washed two times with ice-cold PBS, solubilized in Triton X-100 (1%), and frozen immediately for subsequent ATP quantification (conducted within 24 hr following sample collection). ATP was determined using a luciferin/luciferase assay.14 For this purpose, 100 μL aliquots of cell lysates were mixed with 100 μL of ATP assay mix (# FL-AAM, Sigma, Inc.). Light emission was measured with a Turner Designs luminometer (model 20/20). Raw data measurements were collected as relative light units integrated over 20 sec for samples, and converted to ATP concentrations with the aid of a standard calibration curve obtained using an ATP standard (# FL-AAS, Sigma, Inc.). ATP levels were normalized for protein content, and each data point represented the mean ± SEM of a minimum of four replicates.
Fluorescent Microscopy
For this study, MCF7 parental, MCF7/Dox (1000 ng/ml), MCF7/Dox (10 ng/ml), MCF7/Dox-P85 (10 ng/ml in 0.001% P85), and MCF7/P85 (0.001%) cell sublines were grown to approximately 80% confluency on chamber slides (Fisher, St. Louis, MO). Cells were fixed with a 4% formaldehyde solution, and then stained with F-actin–specific Oregon Green 488 phalloidin and G-actin–specific Texas Red deoxyribonuclease I (Molecular Probes, Inc., Eugene, OR). After staining, the loading solution was removed, the cells were washed three times with ice-cold PBS containing 1% bovine serum albumin, and examined by confocal laser microscope (ACAS-570 Meridian Instruments; Okimos, MI).
Oligonucleotide Array Gene Expression Assay
Human oligonucleotide probes (60mers) were designed for each target gene (Compugen, Inc., Rockville, MD) and manufactured by Sigma-Genosys, Inc. (The Woodlands, Huston, TX). Oligonucleotides were spotted onto poly-L-lysine coated slides using a MagnaSpotter robot (BioAutomation Corp., Dallas, TX), UV-crosslinked, blocked by succinic anhydride treatment, and rinsed in ethanol. The printed arrays were boxed and stored desiccated at room temperature. Total RNA was isolated from each cell line using TRIzol reagent (Life Technologies, Inc., Gaithersburg, MD) according to the manufacturer’s protocol. The fluorescently-labeled single-stranded cDNA target was generated using an indirect or “two-step” labeling procedure.15 Typically, cDNA synthesis was performed on total RNA (40 μg) using anchored oligo(dT) primers, Stratascript reverse transcriptase (Stratagene Corp., La Jolla, CA), a dNTP formulation containing amino allyl-dUTP (Sigma, Inc., St. Louis, MO), and RNAsin (Promega, Madison, WI). Residual RNA was hydrolyzed by treatment with NaOH and EDTA, and unincorporated nucleotides removed by QiaQuick PCR Purification Kit (Qiagen Inc.,Valencia, CA) using a potassium phosphate buffering system. Fluorescent targets were generated by chemically coupling either Cy3 or Cy5 dyes to the reactive amino-allyl groups of the cDNA with 0.05M sodium carbonate (pH9). Uncoupled dye material was removed by QiaQuick PCR purification column (Qiagen Inc.) and the purified dye-labeled cDNAs concentrated by vacuum centrifugation. Cy3- and Cy5-coupled cDNAs were combined and diluted to 50μl with 4.4X SSC, 50% formamide, and 4.1X Denhardt’s hybridization solution and incubated at 42°C for 16–20 hours, then excess target was removed by repeated washings in increasingly stringent SSC/SDS solutions and dried by centrifugation. The microarrays were scanned with a ScanArray 4000 confocal laser system (Perkin-Elmer, Wellesly, MA). Fluorescent intensities were background subtracted and normalization and filtering of the data were performed using the QuantArray software package (Perkin-Elmer). After normalization, expression ratios were calculated for each feature.
Data Analyses
The expression ratio values in each sample were log2 transformed. The comparison of expression data for the samples was presented using the bivariate scatter plots. The self-organizing map (SOM) was used to present the clusters of the multi-dimensional gene expression data by the ordered grid-layout units. For SOM analysis the normalized expression ratio values were log2 transformed and centered by subtracting the sample-wise median from the expression values in each sample of data, so that the median value of each sample is zero.16 The nearest clusters were mapped onto nearby grid-layout units of the map.17 The mathematical software MATLAB (The MathWorks, Inc., Natick, MA) and SOM toolbox for MATLAB (http://www.cis.hut.fi/projects/somtoolbox) were employed for the data analyses.
Results
Selection of MCF7 Cells with Dox and Dox-P85
The human breast carcinoma MCF7 cell line was cultured in either increasing concentrations of 1) Dox or 2) Dox formulated with 0.001% P85 (Dox-P85) in the medium. After 305 days of escalating the drug exposure, the cells selected with Dox alone (MCF7/Dox) showed stable growth in the presence of 10,000 ng/ml Dox (Figure 1). In sharp contrast, cells selected with Dox in the presence of P85 (MCF7/Dox-P85) could only maintain growth at a dramatically lower (1000-fold) concentration of the drug (10 ng/ml Dox). To better evaluate the development of drug resistance, the cells were harvested at different points of selection as shown in Figure 1 and characterized by a number of different methods as described below. Additionally, in parallel experiments the cells were cultured for 305 days in 1) drug-free medium containing 0.001% P85 (MCF-7/P85) and 2) 10 ng/ml Dox without Pluronic.
Figure 1.

Time course of the development of drug resistance in MCF7 cell lines cultured with Dox either alone (filled diamonds) or in combination with 0.001% P85 (open diamonds). [Dox] is the concentration of Dox in the growth medium. Arrows (1–7) indicate where cells at different points of selection were used in further experiments.
Expression of Pgp
Exposure of human breast carcinoma cells to Dox leads to overexpression of the MDR1 gene product: the multidrug transporter Pgp (ABCB1).18 The level of Pgp in MCF7/Dox cells was determined by Western blot analysis. Importantly, increases in the level of Pgp detected in the cells showed a strong correlation with the increase in the amount of Dox tolerated by the cells in the culture media (Figure 2). Specifically, increased Pgp expression was observed in MCF7/Dox cells at 200 ng/ml Dox and above, while at an earlier point of selection (10 ng/ml Dox) Pgp was not significantly expressed or different from untreated control MCF7 cells. MCF7/Dox-P85 cells selected at 10 ng/ml Dox, also showed little, if any, Pgp expression.
Figure 2.

Western blot data for expression of Pgp in MCF7 parental cells, and selected MCF7 cells tolerating: 10ng/ml Dox; 200ng/ml Dox; 1000ng/ml Dox; 5000ng/ml Dox; 10,000ng/ml Dox; and 10ng/ml Dox with 0.001% P85. The cells were harvested at different points of selection as presented in Figure 1.
To confirm the functional activity of the Pgp, we examined the accumulation of the Pgp substrate, R123, in the selected cell sublines, as previously described.11 Figure 3 demonstrates that MCF7/Dox cells selected at higher drug concentration (200 ng/ml Dox and higher) accumulated much less R123 compared to the parental MCF7 cells. This effect was particularly pronounced at 1000 ng/ml Dox and higher, while at 200 ng/ml Dox the decrease in R123 accumulation was only about 2-fold. This argues strongly that the increased expression of Pgp resulted in the increased efflux of R123 in the selected cells. Notably, MCF7/Dox cells assayed at the early point of selection (10 ng/ml Dox) displayed similar R123 levels as the parental cells. Furthermore, accumulation of R123 was not affected in MCF7/Dox-P85. Therefore, MCF7 cells grown in the presence of Dox-P85 appear to be unable to overexpress Pgp and progress to a state where they are able to tolerate higher drug concentrations.
Figure 3.

R123 accumulation in the selected cell sublines tolerating various concentrations of Dox in the culture media (same sample assignment as designated in Figure 2).
Expression of MDR1 and GSTP1 Genes
The selected cells were further characterized by real-time reverse-transcription polymerase chain reaction (RT2-PCR).12,19 This study measured the expression levels of MDR1, as well as glutathione S-transferase pi (GSTP1), which was chosen as an additional clinically relevant indicator for resistance to chemotherapy.20 The expression levels of these genes were normalized to glyceraldehyde-3-phosphate dehydrogenase (GAPDH) as a housekeeping gene. As shown in Table 2, expression of the MDR1 gene was up-regulated in MCF7/Dox cells selected at Dox concentrations of 200 ng/ml and higher. In contrast, MDR1 mRNA was undetectable in parental MCF7 cells, MCF7/P85 cells cultured with P85 alone, or MCF7/Dox cells cultured with 10 ng/ml Dox without Pluronic. Although a detectable level of MDR1 mRNA was found in MCF7/Dox-P85 cells, it was considerably less (by two orders of magnitude) than the levels in MCF7/Dox cells grown at higher concentrations of Dox. A similar pattern of gene expression was found for GSTP1 (Table 2). Specifically, the level of GSTP1 mRNA in MCF7/Dox-P85 cells was at least 1000-times less than levels in MCF7/Dox cells selected at 200 ng/ml and higher concentrations of Dox. Together, these findings reinforce the conclusion that Pluronic hinders development of drug resistance in MCF-7 cells.
Table 2.
Relative expression levels of MDR1 and GSTP1 normalized to the housekeeping gene GAPDH in the various selected cell sublines
| Cell subline | MDR1 | GSTP1 |
|---|---|---|
| MCF7 parental | Undetectable | 0.0001 |
| MCF7/P85* | Undetectable | 0.0007 |
| MCF7/Dox | ||
| 10 ng/ml Dox* | Undetectable | 0.0005 |
| 200 ng/ml Dox | 0.27 | 0.94 |
| 1,000 ng/ml Dox | 0.19 | 1.27 |
| 5,000 ng/ml Dox | 0.4 | 1.15 |
| 10,000 ng/ml Dox | 1.3 | 1.27 |
| MCF7/Dox-P85 | 0.01 | 0.0013 |
MCF7/Dox cells were harvested at the different points of selection as indicated in Figure 1 except for MCF7/Dox at 10 ng/ml Dox, which were cultured with this concentration of the drug for the same period as MCF7/Dox-P85 cells (305 days). MCF7/P85 cells were cultured with 0.001% P85 without the drug for 305 days.
Cytotoxicity of Dox in the Selected Cells
The IC50 values of Dox for the parental and selected MCF7 cells are presented in Table 3. The MCF7/Dox-P85 cells, MCF7/P85 cells and MCF7/Dox cells selected at 10 ng/ml and 200 ng/ml Dox did not show any significant differences in IC50 compared to parental MCF7 cells. However, the IC50 values increased by over two orders of magnitude in MCF7/Dox cells selected at higher drug concentrations (1,000–10,000 ng/ml Dox), suggesting that a profound resistance to the drug was developed in these cells. P85 has shown to be a potent sensitizer of MDR cells.8 Therefore, we examined whether the addition of Pluronic to the drug formulation would alter the sensitivity of the Dox resistant cells to the drug. For this purpose, IC50 values were determined by exposing the cells to Dox formulated with 0.1% P85, a dose that was most effective in the prior resistance reversion studies.7 While the addition of P85 had no appreciable effect on IC50 values in non-resistant parental or selected cells (MCF7, MCF7/Dox-P85, MCF7/P85 and MCF7/Dox at 10 ng/ml or 200 ng/ml Dox), the block copolymer had a profound effect on the IC50 values of highly resistant CF7/Dox cells (1,000 – 10,000 ng/ml Dox). In these cells, P85 restored the cytotoxicity of Dox to the level observed in non-resistant MCF7 parental cells (Table 3).
Table 3.
Cytotoxicity of Dox in parental and selected MCF7 cells
| Cell subline |
IC50, μg/ml
|
|
|---|---|---|
| No P85 | In presence of P85 | |
| MCF7 parental | 4.4 ± 0.3 | 6.0 ± 0.5 |
| MCF7/P85* | 5.5 ± 0.5 | 5.0 ± 0.5 |
| MCF7/Dox 10 ng/ml Dox* | 5.0 ± 0.4 | 4.4 ± 0.4 |
| 200 ng/ml Dox | 7.8 ± 0.6 | 5.4 ± 0.4 |
| 1,000 ng/ml Dox | 600.0 ± 5 | 5.5 ± 0.2 |
| 5,000 ng/ml Dox | 2,500.0 ± 5 | 5.0 ± 0.3 |
| 10,000 ng/ml Dox | 10,000.0 ± 10 | 18.0 ± 0.6 |
| MCF7/Dox-P85 | 5.0 ± 0.3 | 6.0 ± 0.5 |
MCF7/Dox cells were harvested at different points of selection as indicated in Figure 1 except for MCF7/Dox at 10 ng/ml Dox, which were cultured with this concentration of the drug for the same period as MCF7/Dox-P85 cells. Similarly MCF7/P85 cells were cultured with 0.001% P85 without the drug for the same period as MCF7/Dox-P85 cells.
ATP Depletion in Selected Cells
A pivotal factor in the chemosensitizing activity of Pluronic is its ability to induce ATP depletion in MDR cells.7,21 Moreover, the potency of Pluronic in ATP depletion appears to be strongly associated with the level of expression of the MDR1 gene and its product, Pgp. Specifically, higher Pgp levels correlated directly with greater ATP depletion. The concentration of Pluronic that induced a 50% decrease in intracellular ATP levels (termed EC50) was used as a measurement of Pluronic potency in a given cell line. As seen in Table 4, the parental MCF7, MCF7/Dox-P85 and MCF7/P85 cells as well as MCF7/Dox cells selected at 10 ng/ml of Dox were non-responsive to P85 in the ATP depletion test. In contrast, MCF7/Dox cells selected with higher concentrations of Dox (200 – 10,000 ng/ml) all displayed profound ATP depletion and had low EC50 values, similar to that observed for the MCF7/ADR cell line used in our previous study that overexpresses Pgp.7 Thus, our observation of the amplification of the MDR gene in MCF7/Dox cells during Dox selection parallels the appearance of the ATP depletion response to P85. Notably, the MCF7/Dox-P85 cells selected with Dox-P85 were non-MDR and non-responsive to further P85 treatment.
Table 4.
Effect of P85 on ATP levels in parental and selected MCF7 cells.
| Cell subline | EC50, wt. % |
|---|---|
| MCF7 parental | 1.0 ± 0.2 |
| MCF7/P85* | 0.8 ± 0.1 |
| MCF7/ADR | 0.009 ± 0.001 |
| MCF7/Dox | |
| 10 ng/ml Dox* | 1.0 ± 0.1 |
| 200 ng/ml Dox | 0.04 ± 0.002 |
| 1,000 ng/ml Dox | 0.03 ± 0.001 |
| 5,000 ng/ml Dox | 0.03 ± 0.001 |
| 10,000 ng/ml Dox | 0.01 ± 0.002 |
| MCF7/Dox-P85 | 1.0 ± 0.2 |
MCF7/Dox cells were harvested at different points of selection as indicated in Figure 1 except for MCF7/Dox at 10 ng/ml Dox, which were cultured with this concentration of the drug for the same period as MCF7/Dox-P85 cells. Similarly MCF7/P85 cells were cultured with 0.001% P85 without the drug for the same period as MCF7/Dox-P85 cells.
Morphology of the Selected Cells
Confocal microscopy images of the Dox sensitive and resistant cell lines and sublines used in this study are presented in Figure 4. The cells were fixed and visualized with F- and G-actin-specific dyes. The parental MCF7, MCF7/Dox (10 ng/ml and 1000 ng/ml) and MCF7/P85 cells each displayed a similar morphology and had a “diamond-like shape”. In contrast, MCF7/Dox-P85 cells exhibited profound morphological changes and had a “star-like shape”.
Figure 4.

Morphological changes in MCF7 cells selected with Dox formulated with P85. (A) parental MCF7, (B) MCF7/Dox (10 ng/ml), (C) MCF7/Dox (1000 ng/ml), (D) MCF7/Dox-P85 and (E) MCF7/P85. Cells were visualized using F-actin–specific Oregon Green 488 phalloidin and G-actin–specific Texas Red deoxyribonuclease I. The bar is 25 μm in length.
DNA Microarray Analyses of Selected Cells
Global expression profiles of 20K genes were characterized by DNA microarray. Relative levels of expression were determined for each gene in direct comparisons of parental MCF7 cells against MCF7/Dox (10 ng/ml, 200 ng/ml and 1000 ng/ml), MCF7/Dox-P85, and MCF7/P85 cells. Positive or negative changes in the expression of a gene of greater than two-fold in multiple analyses were considered significant. Significant changes were observed in the overall gene expression profiles in MCF7/Dox (10 ng/ml, 200 ng/ml and 1000 ng/ml Dox) and MCF7/Dox-P85 cells compared to parental MCF7 cells. The total numbers of genes showing significant change versus parental MCF7 were as follows: 665 (MCF7/Dox, 10 ng/ml Dox), 452 (MCF7/Dox, 200 ng/ml Dox), 894 (MCF7/Dox, 1000 ng/ml Dox) and 525 (MCF7/Dox-P85). Notably, few, if any, genes were altered in MCF-7/P85 cells cultured with P85 without the drug.
Analysis of Gene Expression Using SOM
SOM analysis allows visual examination of gene alterations grouped in different map units.17 Examples of such maps derived for MCF7, MCF7/Dox (10 ng/ml and 1000 ng/ml) and MCF7/P85 cells are presented in Figure 5. Each colored octagon unit contains a group of genes that are affected to a different extent. The vertical colored bar chart represents the normalized expression values of the genes in comparison with parental MCF7 cells. Three different patterns can be determined using these maps. One pattern represents MCF7/Dox (200 ng/ml and 1000 ng/ml Dox) (Figure 5B,C) and MCF7/Dox-P85 cells (Figure 5D). This pattern exhibits the upregulated genes (red) in the right bottom corner and the downregulated genes (blue) in the left top corner. A strikingly different pattern is displayed for MCF7/Dox cells (Dox 10 ng/ml) (Figure 5A). It exhibits upregulated genes in the left bottom corner and downregulated genes in the right top corner. A similar pattern was observed in the MCF7/P85, although in this case the changes in gene expression appeared to be much less significant (Figure 5E). Thus, by comparing the SOM for different selected cell samples, one can see the differences in gene expression and relate the colored areas to the gene groups affected.
Figure 5.
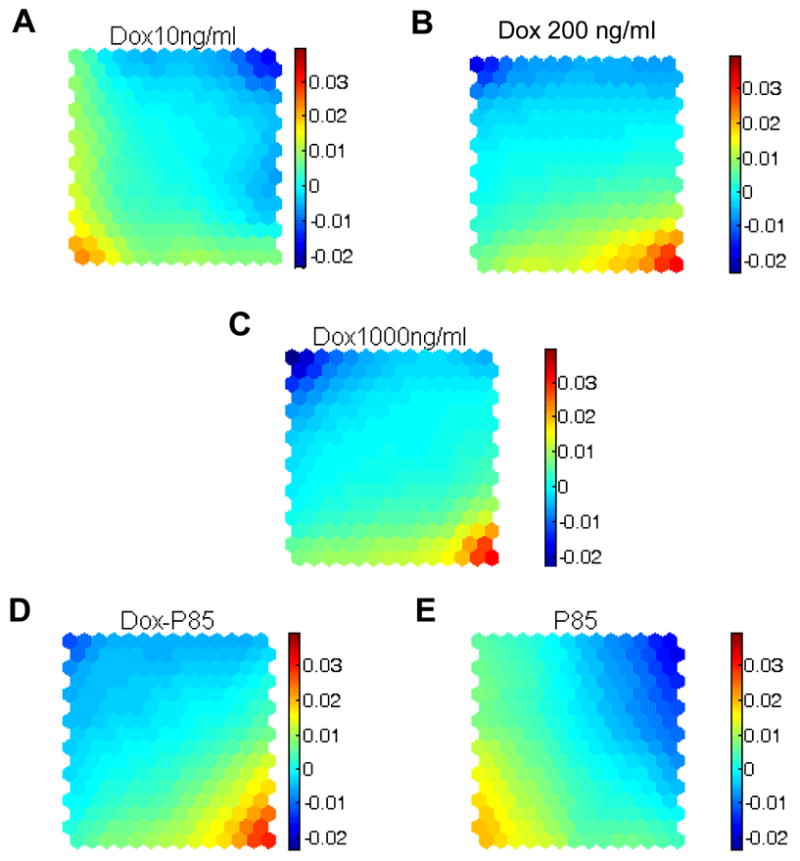
SOM analysis of gene expression in (A) MCF7/Dox (10 ng/ml), (B) MCF7/Dox (200 ng/ml), (C) MCF7/Dox (1000 ng/ml), (D) MCF7/Dox-P85 and (E) MCF7/P85 cells. To increase the accuracy of the analysis, the data were first log2 transformed and then centered by the median of each sample as described in Materials and Methods. The color code assigned to each unit represents normalized gene expression averaged for all the genes contained in this unit The positive and negative values in the color bars correspond to the extent of increase (positive) or decrease (negative) in gene expression levels (different scale than in Figures 6 and 7). The complete analysis of the SOM data and a listing of all the genes in each octagonal unit can be found at: http://nanomedicine.unmc.edu.
Comparison of the Selected Cell Pairs Using the Bivariate Scatter Plots
To further analyze the relative differences between pairs of cells the bivariate scatter plots method was employed. In this method, the X- and Y-axis present the normalized levels of gene expression for each of the two cell samples compared (Figure 6). Thus, the position of each gene in X-Y plot allows one to determine whether this gene is up- or downregulated, or not changed relative to parental MCF7 cells. For example, Figure 6A presents several hypothetical situations for a pair of cells CX and CY. Arrows 1 and 1′ correspond to equal alterations (up- or down-) in both cells compared. Arrows 2 and 2′ indicate that the gene expression is altered in CX but not in CY. Similarly, arrows 3 and 3′ indicate alterations in CY, but not CX. Finally, arrows 4 and 4′ would correspond to opposite directions of changes in CX and CY. Using this consideration, we compared the MCF7/Dox-P85 cells to the following three sublines: 1) the highly resistant MCF7/Dox cells selected at 1000 ng/ml Dox (Figure 6B); 2) the MCF7/Dox cells selected at 10 ng/ml Dox (Figure 6C); and 3) the MCF7/P85 cultured in the drug free media in the presence of the same concentration of P85 (Figure 6D). (This analysis did not include MCF7/Dox (200 ng/ml) cells, which, as we believe, represent some transitory state between MCF7/Dox cells selected at 10 ng/ml and 1000 ng/ml.) The dotted horizontal and vertical lines in Figures 6B–D indicate significant deviation (2-fold) of gene expression compared to the parental cells. There was a considerable group of genes that were altered in resistant MCF7/Dox cells selected at 1000 ng/ml Dox, but not in MCF7/Dox-P85 cells (Figure 6B). At the same time, there were genes altered in the same direction as well as to the same extent in both cell sublines. Notably, there was a distinct group of genes that were increased in MCF7/Dox-P85 cells, but not in MCF7/Dox cells. Comparison of MCF7/Dox-P85 cells with non-resistant MCF7/Dox cells selected at 10 ng/ml Dox also revealed substantial differences between these sublines (Figure 6C). In this case, there were clearly many genes that were selectively altered in each of the sublines, however, there were far fewer genes displaying the same direction of change in both sublines compared to the previous case. Finally, comparison of MCF7/Dox-P85 and MCF7/P85 cells suggest that almost no genes were changed coherently in both sublines and only very few genes changed in cells treated by P85 in the absence of the drug.
Figure 6.
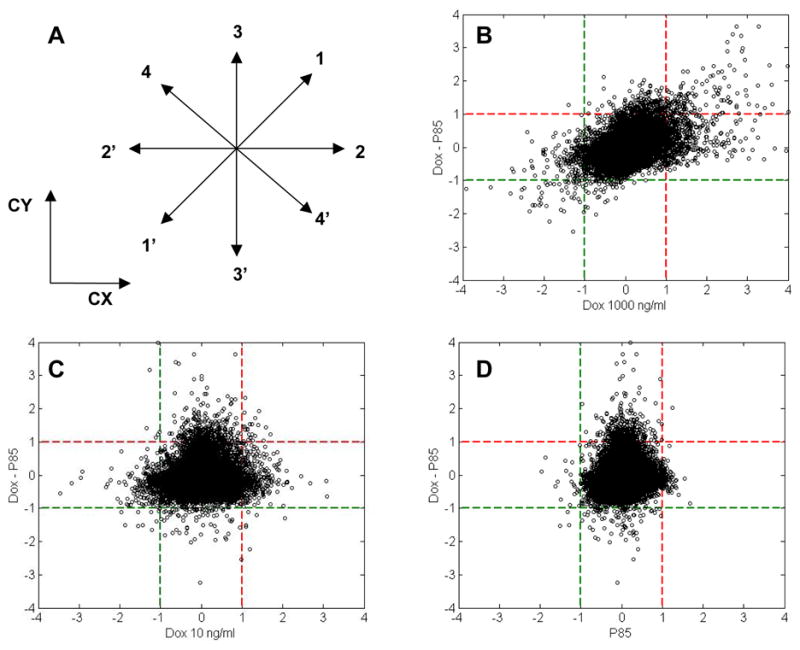
Multivariate scatter plots of gene expression. (A) Comparison of a hypothetical pair of cells CX and CY where arrows depict upregulation (1–4) or down regulation (1′–4′) of genes. (B) comparison of MCF7/Dox-P85 cells to (B) MCF7/Dox (1000 ng/ml), (C) MCF7/Dox (10 ng/ml); and (D) MCF7/P85 cells. The data are log2 transformed expression ratio values. The changes exceeding ±1 (1=log2(2),−1=log2(0.5)), shown by dotted lines, correspond to over 2-fold increase or decrease in expression ratio values and are considered significant.
Analysis of the Selected Gene Alterations
Figure 8 presents data on the expression of selected genes that have a defined function and/or are implicated in drug resistance in four sublines: MCF7/Dox (10 ng/ml); MCF7/Dox (1000 ng/ml); MCF7/Dox-P85; and MCF7/P85, each in comparison with the parental MCF7 cells. The following genes were upregulated in highly resistant MCF7/Dox (1000 ng/ml) cells, but not in MCF7/Dox-P85, MCF7/Dox (10 ng/ml) or MCF7/P85 cells: 1) GSTP1, 2) ABCB4, also known as MDR3, a member of MDR/TAP subfamily,22 3) NSEP1 involved in transcriptional regulation of MDR1,23 and 4) CTGF, a connective tissue growth factor involved in the progression of breast cancer.24 (MDR1 was not included in this array, but its upregulation was demonstrated above by RT2-PCR and Western blot.) Collectively, these observations reinforce the conclusion that Pluronic can prevent the emergence of the MDR1-related phenotype in MCF7 cells. At the same time, there were practically no changes in the expression of drug efflux transporters ABCC1 (a multidrug resistance protein 1 (MRP1)), and ABCG2 (a breast cancer resistance protein (BCRP)) in either cell line. Similarly, there were no alterations in major vault protein (MVP), also known as a lung resistance protein (LRP). However, some other genes involved in metabolic drug resistance (cytochrome P450, thioredoxin reductase, superoxide dismutase 1), apoptosis (cytochrome C), and transcriptional factors (zinc finger proteins ZNF22, ZNF198) were upregulated in MCF7/Dox (1000 ng/ml) cells, while MCF7/Dox-P85 cells displayed little if any changes. Notably, MCF7/Dox (10 ng/ml) cells also revealed considerable changes in the expression of some of these genes. In contrast, several other genes, possibly involved in drug resistance, such as members of the metallothionein family (MT2A, MT1R, MT1g), the heat shock proteins (HSJ2, HSC71), the vacuolar proton pump group and β-tubulin were up-regulated in both MCF7/Dox (1000 ng/ml) and MCF7/Dox-P85 cells. Thus, the formulation of Dox with P85 abolished some, but not all of the potential mechanisms for drug resistance. Moreover, comparing the level of each of these genes expression in MCF7/Dox (10 ng/ml) and MCF7/Dox-P85 cells (also selected at 10 ng/ml Dox), the alterations in the cells selected in Pluronic-free drug were much less than those in the cells selected in the presence of the block copolymer, suggesting that P85 amplified the effect of the drug to the same extent as the use of the high dose of Dox alone. Another example, was TFF1, an estrogen-dependent factor, which was strongly downregulated in MCF7/Dox (1000 ng/ml) and MCF7/Dox-P85 cells but not changed in MCF7/Dox (10 ng/ml) cells. Notably, Pluronic alone did not alter the expression of these genes. The few genes that were downregualted in MCF7/P85 cells included nuclear respiratory factor (NRF1) and succinate dehydrogenase complex II protein (SDHC). Finally, some genes were not affected in cells cultured with P85 or Dox alone but were upregulated in MCF7/Dox-P85 cells. These genes included cytochrome C oxidase assembly protein (Cox11), programmed cell death 5 (PDCD5) and tumor necrosis factor receptor (TNFSF10A).
Discussion
Pluronics have been shown to sensitize MDR1 tumors, resulting in increased cytotoxic activity of Dox, paclitaxel, vinblastine, and other drugs by 2–3 orders of magnitude.5,6 Similar effects of Pluronics have also been reported using in vivo tumor models.25, 26 The depletion of ATP combined with simultaneous inhibition of Pgp ATPase activity by Pluronics, result in a potent inhibition of the Pgp drug efflux system and chemosensitization of MDR1 cells. Notably, Pluronics display profound selectivity with respect to MDR cells and selectively induce ATP depletion in MDR cells, but not in parental cells.7,21 Based on the ability of Pluronics to sensitize MDR cancer cells, the block copolymer formulation of Dox comprising a mixture of Pluronic L61 and F127, SP1049C, was developed for treatment of tumors with a high incidence of MDR. An open labeled two-site Phase I clinical trial of SP1049C demonstrated evidence of antitumour activity in patients with advanced resistant solid tumours.9 A phase II study of this formulation to treat inoperable metastatic adenocarcinoma of the oesophagus is close to completion.10
The results presented in this paper for the first time suggest that the formulation of the antineoplastic drug, Dox, with Pluronic, also prevents the development of MDR in breast cancer cells. This further reinforces the potential benefits of using such formulations for chemotherapy of cancer tumors. Specifically, if resistance is intrinsic, Pluronic sensitizes the tumor, whereas if resistance is acquired, MDR cells no longer have a selective advantage. In addition, this work provides an indication of the mechanism by which P85 prevents development of MDR. Initially, during the process of cell selection at low drug concentrations, e.g. 10 ng/ml Dox, the MDR phenotype does not develop. Subsequently, as the cells are selected with higher concentrations of the drug, e.g. 1000 ng/ml Dox alone, the cells display amplification of MDR1, overexpression of Pgp, decreased uptake of a Pgp-specific probe and elevated resistance to Dox. P85 “re-sensitizes” these resistant cells to the level observed for parental cells (Table 3), suggesting that in the presence of the copolymer these cells have no advantage. As a result, when selection is carried out in the presence of Pluronic, resistant cells do not develop and the cells are able to grow only at a maximal dose of 10 ng/ml Dox. A more detailed analysis also suggests that the MCF7/Dox cells selected at 200 ng/ml Dox although they display elevated Pgp levels, their IC50 did not change and they are not sensitized by P85 in the cytotoxicity test. It appears that Pgp in these cells is less functionally active since the uptake of the Pgp substrate, R123 is decreased by only about 2.2-folds compared to 15-folds in MCF7/Dox cells (1000 ng/ml Dox). This observation raises a question why are the cells selected in the presence of Pluronic limited to grow at 10 ng/ml of Dox and cannot progress towards 200 ng/ml Dox? The answer is perhaps related to the fact that the profound effect on ATP depletion by Pluronic already observed in MCF7/Dox cells (200 ng/ml Dox) may result in slower cell growth in the presence of the copolymer.
Beside the amplification of the MDR1 gene, a number of other mechanisms of resistance are known to be triggered in cancer cells in response to exposure to an antineoplastic agent. These include altered expression and mutations of topoisomerase II and I,27 activation of metabolic enzymes such as cellular retinoic binding protein, epoxide hydrolase and thioredoxin,28, 29 and inhibition of apoptotic signal transduction pathways in the affected cells.28,30,31 Given the high level of genomic instability and mutations in cancer cells, these mechanisms are often displayed in complex and multifactorial fashion, allowing the cancer cell many escape routes to survive the chemotherapy. This reinforces the relevance of the analysis of the global profile of genes expressed in the selected sublines. Clearly, the analysis has suggested that a set of MDR1-related genes that are upregulated in Dox-selected cells cannot develop when Pluronic is present. In view of the fact that MDR1 is found at high levels or more frequently in recurrent or relapsed cancers as well as after the initial chemotherapy treatment,32 Pluronic may be of substantial benefit in cancer chemotherapy.
An unexpected result of the microarray analyses is that selection of the cells with the drug in the presence of Pluronic led to profound alterations in the levels of genes that were not affected in the cells selected with the drug alone or with the block copolymer alone. In other words, formulation of a chemotherapeutic drug with a polymer excipient, which is not even covalently bound to this drug, and when alone has little if any affect on gene expression, can drastically change the pharmacogenomic responses to the drug. Notably, in some cases Pluronic appeared to enhance the effect of the drug on gene expression. Examples include genes related to drug resistance, such as the vacuolar proton pump that may promote degradation of the drugs in the lysosomes,33 and β-tubulin that may result in appearance of drug resistance to paclitaxel via altered microtubule assembly, drug binding and dynamics.34 In addition, increased expression of an estrogen-dependent factor gene TFF1 may result in enhanced cell proliferation and invasiveness.18, 35 Another group of genes up-regulated in MCF7/Dox-P85 cells is involved in signaling and regulation of apoptosis, such as programmed cell death 5 (PDCD5) and tumor necrosis factor receptors (TNFSF10A). Overall, these results reinforce a need to consider the pharmacogenomic effects of polymer excipients, including a potential for development of new resistance mechanisms, which are not found with the low molecular mass drugs. This conclusion may be of general significance for other polymer therapeutics and drug delivery systems, such as polymer-drug conjugates and drugs entrapped in polymer micelles, liposomes and other nanoformulations.
Supplementary Material
Supporting information is available on the World Wide Web at http://nanomedicine.unmc.edu/
Figure 7.
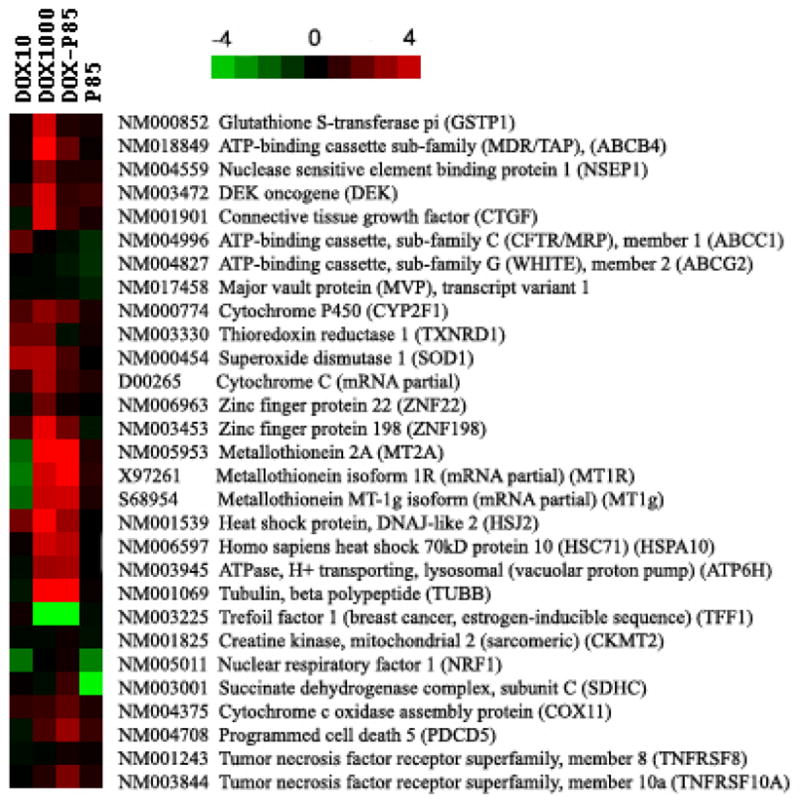
Comparative analysis of the expression of selected genes in MCF7/Dox (10 ng/ml); MCF7/Dox (1000 ng/ml), MCF7/Dox-P85 and MCF7/P85 cells. The color scale is based on the log2 transformed expression ratio values. The changes exceeding ± 1, correspond to over 2-fold increase or decrease in expression ratio values and are considered significant. (same scale as in Figure 6).
Acknowledgments
This study was supported by a National Institutes of Health grant CA89225.
References
- 1.Langer R. Drug delivery and targeting. Nature. 1998;392:5–10. [PubMed] [Google Scholar]
- 2.Savic R, Luo L, Eisenberg A, Maysinger D. Micellar nanocontainers distribute to defined cytoplasmic organelles. Science. 2003;300:615–618. doi: 10.1126/science.1078192. [DOI] [PubMed] [Google Scholar]
- 3.Duncan R. The dawning era of polymer therapeutics. Nat Rev Drug Discov. 2003;2:347–360. doi: 10.1038/nrd1088. [DOI] [PubMed] [Google Scholar]
- 4.Nishiyama N, Okazaki S, Cabral H, Miyamoto M, Kato Y, Sugiyama Y, Nishio K, Matsumura Y, Kataoka K. Novel cisplatin-incorporated polymeric micelles can eradicate solid tumors in mice. Cancer Res. 2003;63:8977–8983. [PubMed] [Google Scholar]
- 5.Alakhov V, Moskaleva E, Batrakova E, Kabanov A. Hypersensitization of multidrug resistant human ovarian carcinoma cells by Pluronic P85 block copolymer. Bioconjug Chem. 1996;7:209–216. doi: 10.1021/bc950093n. [DOI] [PubMed] [Google Scholar]
- 6.Venne A, Li S, Mandeville R, Kabanov A, Alakhov V. Hypersensitizing effect of Pluronic L61 on cytotoxic activity, transport, and subcellular distribution of doxorubicin in multiple drug-resistant cells. Cancer Res. 1996;56:3626–3629. [PubMed] [Google Scholar]
- 7.Batrakova EV, Li S, Elmquist WF, Miller DW, Alakhov VY, Kabanov AV. Mechanism of sensitization of MDR cancer cells by Pluronic block copolymers: Selective energy depletion. Br J Cancer. 2001;85:1987–1997. doi: 10.1054/bjoc.2001.2165. [DOI] [PMC free article] [PubMed] [Google Scholar]
- 8.Kabanov A, Batrakova E, Alakhov V. Pluronic block copolymers for overcoming drug resistance in cancer. Adv Drug Deliv Rev. 2002;54:759–779. doi: 10.1016/s0169-409x(02)00047-9. [DOI] [PubMed] [Google Scholar]
- 9.Danson S, Ferry D, Alakhov V, Margison J, Kerr D, Jowle D, Brampton M, Halbert G, Ranson M. Phase I dose escalation and pharmacokinetic study of pluronic polymer-bound doxorubicin (SP1049C) in patients with advanced cancer. Br J Cancer. 2004;90:2085–2091. doi: 10.1038/sj.bjc.6601856. [DOI] [PMC free article] [PubMed] [Google Scholar]
- 10.Valle JW, Lawrance J, Brewer J, Clayton A, Corrie P, Alakhov V, Ranson M. A phase II, window study of SP1049C as first-line therapy in inoperable metastatic adenocarcinoma of the oesophagus. J Clin Oncol ASCO Annual Meeting Proceedings (Post-Meeting Edition) 2004;22:4195. [Google Scholar]
- 11.Miller D, Batrakova E, Waltner T, Alakhov V, Kabanov A. Interactions of Pluronic block copolymers with brain microvessel endothelial cells: evidence of two potential pathways for drug absorption. Bioconjugate Chem. 1997;8:649–657. doi: 10.1021/bc970118d. [DOI] [PubMed] [Google Scholar]
- 12.Pan Z, Shen Y, Du C, Zhou G, Rosenwald A, Staudt LM, Greiner TC, McKeithan TW, Chan WC. Two newly characterized germinal center B-cell-associated genes, GCET1 and GCET2, have differential expression in normal and neoplastic B cells. Am J Pathol. 2003;163:135–144. doi: 10.1016/S0002-9440(10)63637-1. [DOI] [PMC free article] [PubMed] [Google Scholar]
- 13.Ferrari M, Fornasiero M, Isetta A. MTT colorimetric assay for testing macrophage cytotoxic activity in vitro. J Immunol Methods. 1990;131:165–172. doi: 10.1016/0022-1759(90)90187-z. [DOI] [PubMed] [Google Scholar]
- 14.Garewal H, Ahmann F, Schifman R, Celniker A. ATP assay: ability to distinguish cytostatic from cytocidal anticancer drug effects. J Natl Cancer Inst. 1986;77:1039–1045. [PubMed] [Google Scholar]
- 15.Wang HY, Malek RL, Kwitek AE, Greene AS, Luu TV, Behbahani B, Frank B, Quackenbush J, Lee NH. Assessing unmodified 70-mer oligonucleotide probe performance on glass-slide microarrays. Genome Biol. 2003;4:R5. doi: 10.1186/gb-2003-4-1-r5. [DOI] [PMC free article] [PubMed] [Google Scholar]
- 16.Eisen MB, Spellman PT, Brown PO, Botstein D. Cluster analysis and display of genome-wide expression patterns. Proc Natl Acad Sci U S A. 1998;95:14863–14868. doi: 10.1073/pnas.95.25.14863. [DOI] [PMC free article] [PubMed] [Google Scholar]
- 17.Xiao L, Wang K, Teng Y, Zhang J. Component plane presentation integrated self-organizing map for microarray data analysis. FEBS Lett. 2003;538:117–124. doi: 10.1016/s0014-5793(03)00156-x. [DOI] [PubMed] [Google Scholar]
- 18.Turton NJ, Judah DJ, Riley J, Davies R, Lipson D, Styles JA, Smith AG, Gant TW. Gene expression and amplification in breast carcinoma cells with intrinsic and acquired doxorubicin resistance. Oncogene. 2001;20:1300–1306. doi: 10.1038/sj.onc.1204235. [DOI] [PubMed] [Google Scholar]
- 19.Le Jeune IR, Shepherd M, Van Heeke G, Houslay MD, Hall IP. Cyclic AMP-dependent transcriptional up-regulation of phosphodiesterase 4D5 in human airway smooth muscle cells. Identification and characterization of a novel PDE4D5 promoter. J Biol Chem. 2002;277:35980–35989. doi: 10.1074/jbc.M204832200. [DOI] [PubMed] [Google Scholar]
- 20.Su F, Hu X, Jia W, Gong C, Song E, Hamar P. Glutathion S transferase pi indicates chemotherapy resistance in breast cancer. J Surg Res. 2003;113:102–108. doi: 10.1016/s0022-4804(03)00200-2. [DOI] [PubMed] [Google Scholar]
- 21.Kabanov AV, Batrakova EV, Alakhov VY. An essential relationship between ATP depletion and chemosensitizing activity of Pluronic block copolymers. J Control Release. 2003;91:75–83. doi: 10.1016/s0168-3659(03)00211-6. [DOI] [PMC free article] [PubMed] [Google Scholar]
- 22.Lincke CR, Smit JJ, van der Velde-Koerts T, Borst P. Structure of the human MDR3 gene and physical mapping of the human MDR locus. J Biol Chem. 1991;266:5303–5310. [PubMed] [Google Scholar]
- 23.Saji H, Toi M, Saji S, Koike M, Kohno K, Kuwano M. Nuclear expression of YB-1 protein correlates with P-glycoprotein expression in human breast carcinoma. Cancer Lett. 2003;190:191–197. doi: 10.1016/s0304-3835(02)00590-6. [DOI] [PubMed] [Google Scholar]
- 24.Xie D, Nakachi K, Wang H, Elashoff R, Koeffler HP. Elevated levels of connective tissue growth factor, WISP-1, and CYR61 in primary breast cancers associated with more advanced features. Cancer Res. 2001;61:8917–8923. [PubMed] [Google Scholar]
- 25.Batrakova EV, Dorodnych TY, Klinskii EY, Kliushnenkova EN, Shemchukova OB, Goncharova ON, Arjakov SA, Alakhov VY, Kabanov AV. Anthracycline antibiotics non-covalently incorporated into the block copolymer micelles: in vivo evaluation of anti-cancer activity. Br J Cancer. 1996;74:1545–1552. doi: 10.1038/bjc.1996.587. [DOI] [PMC free article] [PubMed] [Google Scholar]
- 26.Alakhov V, Klinski E, Li S, Pietrzynski G, Venne A, Batrakova EV, Bronitch T, Kabanov A. Block copolymer-based formulation of Doxorubicin. From cell screen to clinical trials. Colloids Surf B: Biointerfaces. 1999;16:113–134. [Google Scholar]
- 27.Nielsen D, Maare C, Skovsgaard T. Cellular resistance to anthracyclines. Gen Pharmacol. 1996;27:251–255. doi: 10.1016/0306-3623(95)02013-6. [DOI] [PubMed] [Google Scholar]
- 28.Kudoh K, Ramanna M, Ravatn R, Elkahloun AG, Bittner ML, Meltzer PS, Trent JM, Dalton WS, Chin KV. Monitoring the expression profiles of doxorubicin-induced and doxorubicin-resistant cancer cells by cDNA microarray. Cancer Res. 2000;60:4161–4166. [PubMed] [Google Scholar]
- 29.Sinha BK, Mimnaugh EG, Rajagopalan S, Myers CE. Adriamycin activation and oxygen free radical formation in human breast tumor cells: protective role of glutathione peroxidase in adriamycin resistance. Cancer Res. 1989;49:3844–3848. [PubMed] [Google Scholar]
- 30.Licht T, Fiebig HH, Bross KJ, Herrmann F, Berger DP, Shoemaker R, Mertelsmann R. Induction of multiple-drug resistance during anti-neoplastic chemotherapy in vitro. Int J Cancer. 1991;49:630–637. doi: 10.1002/ijc.2910490427. [DOI] [PubMed] [Google Scholar]
- 31.Cocker HA, Tiffin N, Pritchard-Jones K, Pinkerton CR, Kelland LR. In vitro prevention of the emergence of multidrug resistance in a pediatric rhabdomyosarcoma cell line. Clin Cancer Res. 2001;7:3193–3198. [PubMed] [Google Scholar]
- 32.Fojo T, Bates S. Strategies for reversing drug resistance. Oncogene. 2003;22:7512–7523. doi: 10.1038/sj.onc.1206951. [DOI] [PubMed] [Google Scholar]
- 33.Ouar Z, Bens M, Vignes C, Paulais M, Pringel C, Fleury J, Cluzeaud F, Lacave R, Vandewalle A. Inhibitors of vacuolar H+-ATPase impair the preferential accumulation of daunomycin in lysosomes and reverse the resistance to anthracyclines in drug-resistant renal epithelial cells. Biochem J. 2003;370:185–193. doi: 10.1042/BJ20021411. [DOI] [PMC free article] [PubMed] [Google Scholar]
- 34.Ranganathan S, Benetatos CA, Colarusso PJ, Dexter DW, Hudes GR. Altered beta-tubulin isotype expression in paclitaxel-resistant human prostate carcinoma cells. Br J Cancer. 1998;77:562–566. doi: 10.1038/bjc.1998.91. [DOI] [PMC free article] [PubMed] [Google Scholar]
- 35.Sasaki M, Tsuneyama K, Nakanuma Y. Aberrant expression of trefoil factor family 1 in biliary epithelium in hepatolithiasis and cholangiocarcinoma. Lab Invest. 2003;83:1403–1413. doi: 10.1097/01.lab.0000092230.59485.9e. [DOI] [PubMed] [Google Scholar]
Associated Data
This section collects any data citations, data availability statements, or supplementary materials included in this article.
Supplementary Materials
Supporting information is available on the World Wide Web at http://nanomedicine.unmc.edu/