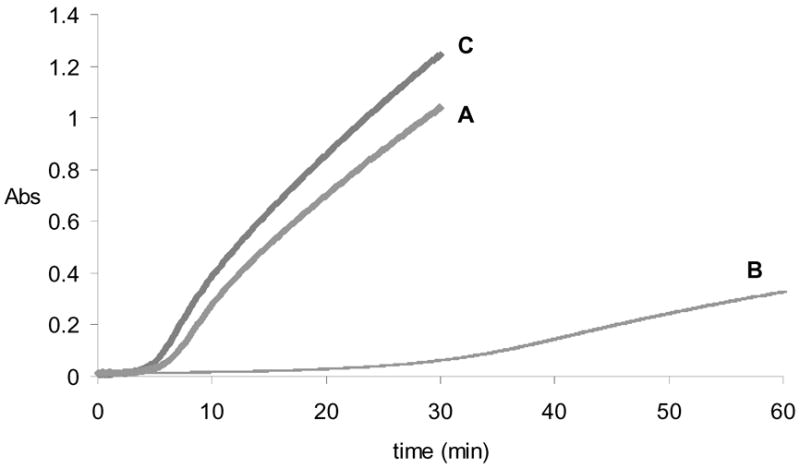
Figure 4.

Time course of aspartoacylase activity after treatment with PNGase F to remove N-glycosyl groups. Curve A: rate of aspartic acid production after addition of PNGase F to aspartoacylase at time = 0. Curve B: rate of aspartic acid production one hour after addition of PNGase F, showing an extended lag and decreased catalytic activity. Curve C: control rate of aspartic acid production after one hour incubation of aspartoacylase in the absence of PNGase F.
