

Abstract
Myo1c is an unconventional myosin involved in cell signaling and membrane dynamics. Calcium binding to the regulatory-domain-associated calmodulin affects myo1c motor properties, but the kinetic details of this regulation are not fully understood. We performed actin gliding assays, ATPase measurements, fluorescence spectroscopy, and stopped-flow kinetics to determine the biochemical parameters that define the calmodulin-regulatory-domain interaction. We found calcium moderately increases the actin-activated ATPase activity, and completely inhibits actin gliding. Addition of exogenous calmodulin in the presence of calcium fully restores the actin gliding rate. A fluorescently labeled calmodulin mutant (N111C) binds to recombinant peptides containing the myo1c IQ motifs at a diffusion limited rate in the presence and absence of calcium. Measurements of calmodulin dissociation from the IQ motifs in the absence of calcium show that the calmodulin bound to the IQ motif adjacent to the motor domain (IQ1) has the slowest dissociation rate (0.0007 s−1), and the IQ motif adjacent to the tail domain (IQ3) has the fastest dissociation rate (0.5 s−1). When the complex is equilibrated with calcium, calmodulin dissociates most rapidly from IQ1 (60 s−1). However, this increased rate of dissociation is limited by a slow calcium-induced conformational change (3 s−1). Fluorescence anisotropy decay of fluorescently labeled N111C bound to myo1c did not depend appreciably on Ca2+. Our data suggest that the calmodulin bound to the IQ motif adjacent to the motor domain is rapidly exchangeable in the presence of calcium and is responsible for regulation of myo1c ATPase and motile activity.
Myo1c is a member of the myosin-I family of molecular motors that functions in mechano-signal transduction (1, 2), membrane dynamics (3–5), protein trafficking (6), and nuclear transcription (7). Myo1c contains a conserved motor domain, a calmodulin-binding regulatory domain (or lever arm), and a tail domain responsible for subcellular targeting and phosphoinositide binding (3, 4, 8).
The regulatory domain of myo1c contains three IQ motifs, which are sequences of ~ 23 amino acids with a core consensus sequence that binds calmodulin (Figure 1;(9, 10)). This domain acts as a lever arm, amplifying conformational changes in the motor to produce a force-generating power stroke (11). The regulatory domain is composed of a single α-helix and requires calmodulin binding to stabilize its structure and to give it mechanical stiffness(12–14).
Figure 1. Domain structure of myo1c and IQ-motif expression constructs used in this study.
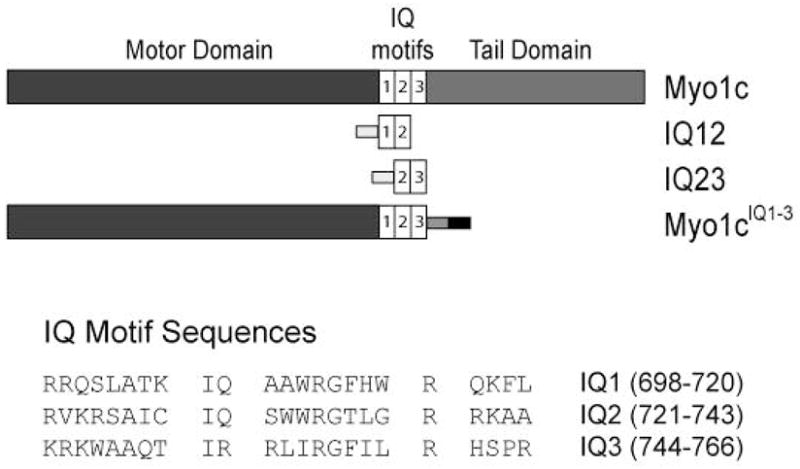
Light gray and dark gray boxes represent 6x-His and FLAG tags, respectively, used for purification. The black box represents an Avi-tag used for site-specific biotinylation. The protein sequences of the individual IQ motifs are shown.
Calcium binding to the high-affinity binding sites of calmodulin change the interaction between calmodulin and the myo1c regulatory domain (15, 16), resulting in the apparent weakening of the affinity of at least one IQ-bound calmodulin. The dissociation of calmodulin inhibits myo1c dependent actin gliding in the in vitro motility assay (15), and similar regulation has also been observed for myo1a and myo1b (17–19). Gillespie and Cyr (20) measured the affinity of calmodulin for peptides with sequences of each of the myo1c IQ motifs and found calcium weakens the affinity of calmodulin for the IQ motifs closest to the motor domain (IQ1 and IQ2), but not the IQ motif closest to the tail domain (IQ3). However, the reported affinities are much weaker than one would expect based on other experiments (15, 16).
Given the localization of myo1c to membranes in dynamic regions of the cell (3, 21, 22), it is likely that myo1c experiences transient changes of calcium concentration within a range that is capable of regulating motor activity. Indeed, it has been proposed that calcium regulates the fast-adaptation response in sensory hair cells (23) by binding directly to myo1c-bound calmodulin. However, nothing is known about the rates at which calcium affects calmodulin binding and dissociation to myo1c, and little is known about calcium-induced structural transitions within the regulatory domain.
Our goal is to characterize the effect of calcium and calmodulin on the regulation of myo1c by measuring the binding and kinetics of the association of calmodulin with each of the myo1c IQ motifs in the presence and absence of calcium, and to determine the rate at which calcium affects the affinity of the IQ-calmodulin interaction.
MATERIALS AND METHODS
Expression and Purification of IQ12 and IQ23
Truncated regulatory domain expression constructs for IQ12 (698 – 743) and IQ23 (721 – 767) were created by cloning the appropriate myo1c cDNA into a pET-28 vector (Novagen) that contains an N-terminal 6-His tag for purification (Figure 1). BL21(DE3) pLysS cells (Stratagene) were transformed with IQ12 or IQ23 and a vector for expression of vertebrate calmodulin. Expression of soluble IQ12 and IQ23 requires the protein to be co-expressed with calmodulin. Protein expression was induced by addition of 1 mM IPTG when the optical density of the bacterial culture was 0.5 – 0.6. Induced cells were further cultured with shaking for 3 h at 37 °C. Cells were lysed with lysis buffer (20 mM imidazole, 150 mM NaCl, 0.5 mM EGTA, 1 mM β-mercaptoethanol (BME), 0.5 % Igepal, 1 mM phenylmethanesulfonyl fluoride, 0.01 mg/ml aprotinin, 0.01 mg/ml leupeptin, 15 mM Tris, pH 7.5) on ice and sonicated. Cell extract was collected after spinning the lysed cells at 10,000 × g for 30 min. The supernatant was passed through a 1 × 1.5 ml Ni-NTA agarose column (Qiagen) and calmodulin-bound IQ12 or IQ23 was eluted from the column with 10 ml of elution buffer (EB: 200 mM Imidazole, 150 mM NaCl, 0.5 mM EGTA, and 1 mM BME, 25 mM Tris pH 8). The protein was dialyzed against 1 L HNa100 buffer (10 mM HEPES, 100 mM NaCl, 1 mM EGTA, 1 mM DTT, pH 7.0) overnight and precipitate was removed by sedimentation. Calmodulin-bound IQ12 or IQ23 was further purified by anion-exchange chromatography (MonoQ; Amersham Pharmacia Biosciences). The identity and molecular weight of IQ12 and IQ23 were verified by Western blot using anti-His antibodies and MALDI analysis (not shown).
Calmodulin was removed from IQ peptides after the monoQ step by loading the protein complex on a Ni-NTA agarose column (1 × 1.5 ml) and removing the calmodulin by washing the column with 10 ml of 8 M urea. The peptide was eluted with 10 ml of EB. The calmodulin-free IQ peptide was immediately loaded on to an HPLC reverse-phase column (PLRP-S column; Polymer Laboratories), where the mobile phase was 10 – 90 % acetonitrile and 0.1 % TFA. We found that calmodulin-free IQ12 and IQ23 in solution non-specifically bound to polypropylene tubes. Therefore, lyophilized IQ motifs were stored at −20 °C until use. High concentrations of solubilized protein kept in glass vials were stable for at least one hour on ice, which is the duration of our experiments. Adsorption of IQ12 and IQ23 to assay tubes was not observed when the peptides were bound to calmodulin.
Purification of Myo1c-motorIQ1-3
A mouse myo1c construct containing residues 1 – 767 (myo1cIQ1-3), which includes the motor domain, three calmodulin-binding IQ motifs, a C-terminal tag for site-specific biotinylation, and a C-terminal FLAG sequence for purification, was expressed and purified in the presence of calmodulin as described (3). Myo1cIQ1-3 was biotinylated as described (19).
Purification and labeling of calmodulin
Wildtype and mutant (N111C-Cam) recombinant chicken calmodulin were expressed and purified from bacterial lysates as described (24). The concentration of calmodulin was determined by absorbance (ε275 = 3300 M−1cm−1).
N111C-CaM was labeled on cysteine-111 with the thiol-reactive dye, 5-((((2-iodoacetyl)amino)ethyl)amino)naphthalene-1-sulfonic acid (IAEDANS). N111C-CaM (50 μM) in labeling buffer (25 mM Tris, pH 7.4, 100 mM NaCl, 2 mM EGTA) was incubated with tris(2-carboxyethyl) phosphine hydrochloride (TCEP) for 60 min at room temp, followed by incubation with 500 μM IAEDANS for 3 hr. The labeling reaction was quenched with 3 mM 2-mercaptoethanesulfonic acid. Free label was removed by gel filtration, and the AEDANS-labeled calmodulin (L-Cam) was concentrated. The AEDANS concentration was determined by absorbance (ε336 = 5700 M−1cm−1), and the L-CaM concentration was determined using [L-Cam] = (A275-(2360 M−1cm−1*[AEDANS]))/3300 M−1cm−1.
ATPase and motility assays
Steady-state ATPase activities were measured in KMg25 (10 mM Mops, pH7.0, 25 mM KCl, 1 mM MgCl2, 1 mM EGTA, 1 mM DTT) at 37° C using the NADH-coupled assay as described (25). The final protein concentrations after mixing were 100 nM myo1cIQ1-3, 50 μM actin, and ± 10 μM calmodulin. Free calcium concentrations were calculated using MaxChelator (26). Calculations took into account the total calcium, magnesium, ATP, and EGTA concentrations, as well as the ionic strength, pH, and temperature. The calcium concentrations are buffered with 1 mM EGTA, so the inclusion of 10 μM calmodulin only marginally changed the free calcium concentration (< 0.5 uM).
In vitro motility assays using biotinylated myo1bIQ1-3 were performed in the absence and presence of calcium in standard motility chambers at 37° C as described (19). The temperature was controlled using an objective heater (Bioptechs). Nitrocellulose-coated coverslips were exposed to 0.1 mg/mL streptavidin and then blocked with 1 mg/mL BSA. Biotinylated myo1cIQ1-3 (250 nM) was added to the coverslip and allowed to bind to the immobilized streptavidin. Free calcium concentrations were determined as described above. The rate of actin filament gliding was determined using Metamorph (Universal Imaging).
Steady-State Fluorescence Binding Assays
Binding of calmodulin to IQ12 and IQ23 was determined by monitoring the steady-state fluorescence of the intrinsic tryptophans of the IQ peptides as a function of calmodulin concentration. Trp residues were excited at 295 nm and fluorescence spectra were collected between 310 and 450 nm. Excitation and emission slits were 6 nm.
Binding of L-CaM to IQ12 and IQ23 was determined by monitoring the steady-state fluorescence of the AEDANS probe excited by fluorescence resonance energy transfer (FRET) from the tryptophans in the IQ peptides to the AEDANS bound to the L-CaM (calmodulin does not contain tryptophans). Tryptophans were excited at 295 nm and fluorescence spectra were collected from 310–600 nm. Data were corrected for the small amount of fluorescence obtained by the 295 nm excitation of L-CaM by subtracting the contribution of the fluorescence spectra of samples containing only L-CaM (0–3 μM).
Sedimentation Assays
The stoichiometry of calmodulin binding to myo1cIQ1-3 was determined using actomyosin spin-down assays as described previously (19). Phalloidin-stabilized actin (4 μM) was incubated with 1 μM myo1cIQ1-3 and titrated with calmodulin (0 – 10 μM) in the absence and presence of 100 μM free calcium. The actomyosin complexes were centrifuged at 250,000 g for 20 min at 25 °C. Supernatants were immediately removed, and the pellets were resuspended in SDS-PAGE sample buffer. Samples were boiled for 3 min, resolved by SDS-PAGE, and visualized by staining with SYPRO-red (Invitrogen). Consistent lane-to-lane loading on the gels was confirmed by monitoring the myosin and actin bands. Gel-band intensities were detected with a Typhoon 8600 imager (GE Healthcare) and were quantified using Metamorph (Universal Imaging) with known quantities of calmodulin as standards resolved on the same gel.
Calmodulin association and dissociation kinetics
The rates of association were determined by monitoring the increase in FRET upon mixing of IQ12 or IQ23 with L-CaM in an Applied Photophysics SX.18MV instrument with λex = 295 nm and fluorescence emission detected using a 475 nm long-pass filter. Data were fit to Scheme 1 using Berkeley Madonna. The rates k1 and k2 were allowed to vary, as were normalization factors for assigning biochemical states to fluorescence intensities.
The rates of dissociation of L-CaM from IQ12, and IQ23 were determined by monitoring the decrease in FRET after the protein complex was mixed with a 50-fold excess of unlabeled calmodulin in HNa100 in the absence or presence of 2 mM CaCl2. Manual mixing in a PTI fluorometer was used to measure the dissociation of L-CaM from IQ12 in the absence of calcium λex = 295 nm and λem = 490 nm. All other measurements were made by stopped-flow as described above. Data were fit to single or double exponential functions and the results are reported as mean ± SD of multiple experiments. Fits to double exponential functions are reported if there was a significant improvement in the chi-squared values and observed residuals over the single exponential fits. The concentrations reported in the text and figure legends are after mixing.
Time-resolved fluorescence anisotropy
Myo1cIQ1-3 was exchanged with L-CaM by mixing 10 μM myo1cIQ1-3, 60 μM L-Cam, in 10 mM Tris, 100 mM NaCl, 1 mM EGTA, 1 mM DTT, 1 mM MgCl2, 1.1 mM CaCl2. After 1 min, EGTA was added to a final concentration of 2 mM. Myo1cIQ1-3 was mixed with phalloidin stabilized actin, and centrifuged to separate the myosin from free L-Cam. The actin-myo1cIQ1-3 pellet was washed and resuspended in the same buffer, but with the addition of 200 mM NaCl and 1 mM ATP. The mixture was centrifuged to separate the actin (pellet) from the myo1cIQ1-3 with bound L-CaM (supernatant).
Time-resolved fluorescence anisotropy was performed using a Photon Technology International (PTI) QuantaMaster fluorometer with polarizers in T-format with a pulsed 337 nm nitrogen laser as the excitation source. Fluorescence emission was collected at 490 ± 2 nm by a time-delay gated photomultiplier tube, and the g-factor was calculated using the instrument software as described (27). The instrument response function at 337 nm was determined using a dilute solution of nonfat dry milk as a scatterer. Data were analyzed by Felix (PTI, inc.) and Globals (Laboratory for Fluorescence Dynamics, Univ. of IL) software.
RESULTS
ATPase and Motile activity of Myo1c
The actin-activated ATPase activity of 100 nM myo1cIQ1-3 was determined as a function of calcium concentration. The ATPase rate increased less than 1.5-fold as the concentration of free calcium was increased to 100 μM (Figure 2). The addition of 10 μM calmodulin resulted in a slight increase in the ATPase rate at all calcium concentrations tested.
Figure 2. Effect of calcium and calmodulin on myo1cIQ1-3.
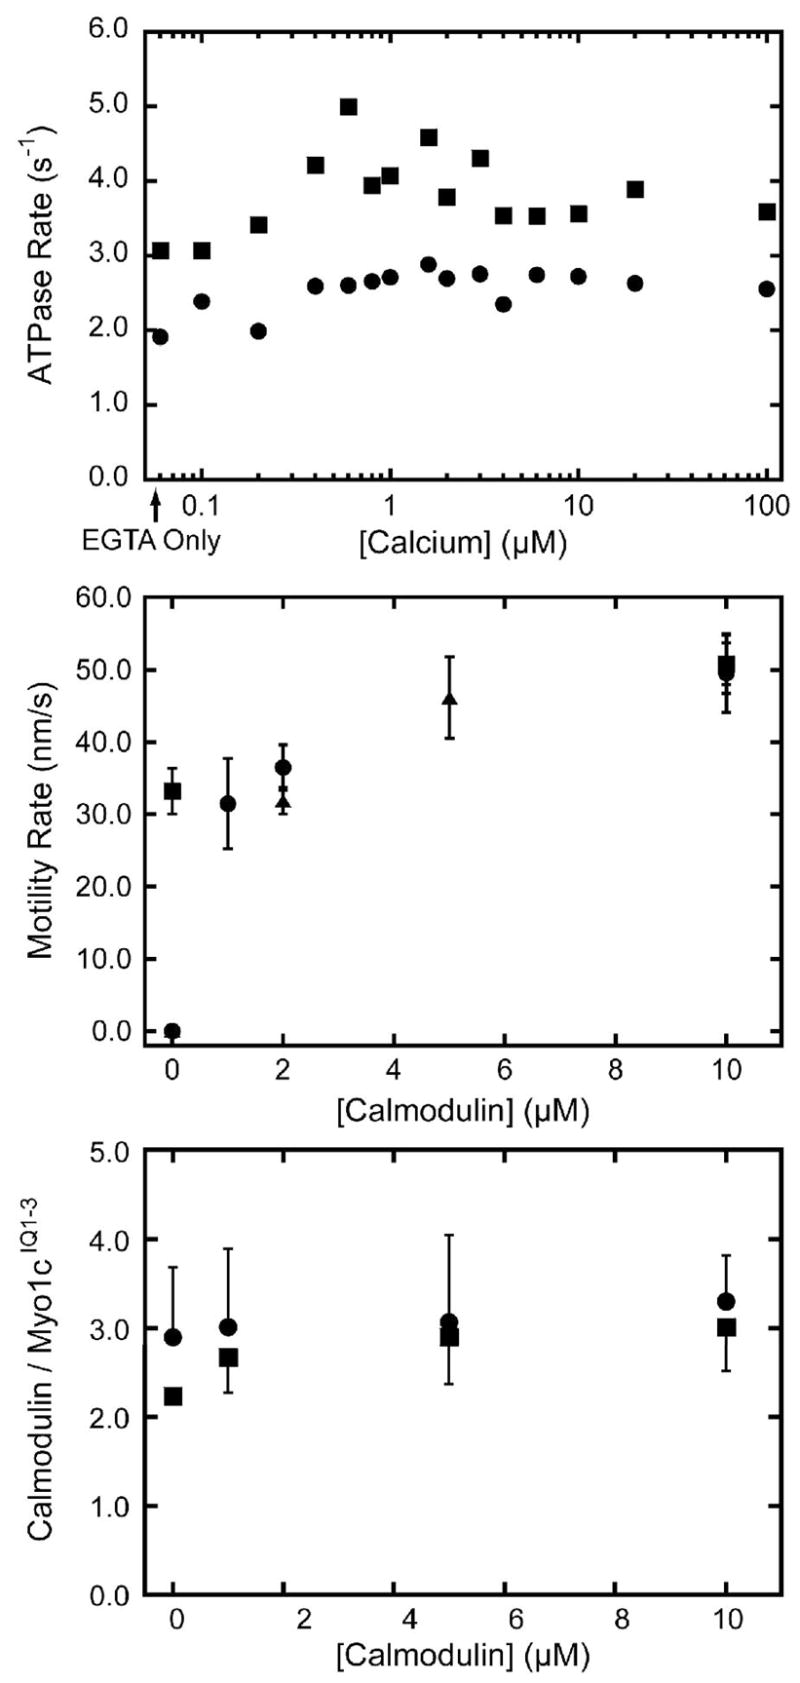
(Top) Actin-activated ATPase activity of 100 nM myo1cIQ1-3 in the presence of 50 μM actin as a function of the concentration of free calcium in the (●) absence and (■) presence of 10 μM calmodulin. The first point represents the ATPase activity in the absence of added calcium. (Center) Velocity of actin filament gliding, measured by the in vitro motility assay, as a function of calmodulin concentration in the (■) absence and presence of (●) 10 μM and (▲) 100 μM free calcium. No motility was detected in the absence of calmodulin and presence of 10 μM or 100 μM calcium. Each point and error bar represents the average and standard deviation of 50 filaments (Bottom) Number of calmodulin molecules bound to myo1cIQ1-3 as a function of calmodulin concentration in the (●) absence and (■) presence of 100 μM free calcium. The calmodulins bound at the zero point co-purifed with the myosin. Error bars represent the range of duplicate experiments.
The rate of actin gliding in the in vitro motility assay in the absence of calcium increased ~ 1.5 fold as the calmodulin concentration was increased from 0 to 10 μM (Figure 2). Calcium inhibited actin gliding in the absence of exogenously added calmodulin. The addition of calmodulin resulted in restoration of actin gliding to rates that were identical to calcium-free conditions (Figure 2), which is in agreement with previous studies (15).
Myo1c binds three calmodulins in the absence and presence of calcium
We determined the number of calmodulins bound to myo1cIQ1-3 by sedimentation assays. Myo1cIQ1-3 (1 μM) was mixed with 0 – 10 μM calmodulin and bound to 4 μM actin. The actomyosin complexes were pelleted in the absence or presence of 100 μM free calcium, and the proteins were resolved by SDS-PAGE along with calmodulin standards for the determination of protein concentration. Since myo1c-IQ1-3 was expressed and purified in the presence of calmodulin, we expected calmodulin to be bound even in the absence of exogenously added calmodulin. We found three calmodulins bound to myo1cIQ1-3 in the absence and presence of 100 μM free calcium (Figure 2). Although calcium apparently weakens the affinity of calmodulin for the IQ motifs (Figure 2; (15, 20)), binding in the absence and presence of calcium is tight. Because myo1c-IQ1-3 is calmodulin-saturated at the lowest concentration tested (1 μM), we estimate the dissociation constants (Kd’s) for the IQ motifs to be at least 5-fold lower than this calmodulin concentration (< 0.2 μM). These affinities are > 5-fold tighter than determined by previous binding measurements (20).
Stoichiometry of calmodulin and L-CaM binding to IQ12 and IQ23
To better facilitate investigation of the biochemical properties of the individual IQ-motif-calmodulin interactions, we expressed peptides composed of the first two (IQ12) and second two (IQ23) IQ-motifs of myo1c (Figure 1). We monitored the intrinsic tryptophan fluorescence of 0.5 μM IQ12 and IQ23 as the peptides were titrated with 0 – 6 μM calmodulin (Figure 3). Calmodulin does not contain tryptophans, so changes in fluorescence are due to environmental changes around the tryptophans in the IQ peptides. In the absence and presence of 100 μM free calcium, the fluorescence of IQ12 increased upon calmodulin binding until the calmodulin to IQ-motif ratio was 1:1, which is 2 calmodulins per peptide. Titrations performed with 0.25 μM and 2.5 μM IQ12 (not shown) also showed saturation at 1:1 calmodulin to IQ-motif ratios, indicating that the peptide concentration is greater than the Kd for calmodulin binding. The fluorescence of IQ23 decreased in intensity upon calmodulin binding in the absence of calcium until the calmodulin to IQ-motif ratio reached 1:1 (Figure 3). In the presence of calcium, the fluorescence increased upon calmodulin binding, and this increase also saturated at a calmodulin to IQ-motif ratio of 1:1. This difference in the direction of change of the fluorescence intensity upon calcium addition indicates that calcium alters the conformation of the IQ-bound calmodulin.
Figure 3. Binding of calmodulin to IQ12 and IQ23 as determined by changes in intrinsic tryptophan fluorescence.
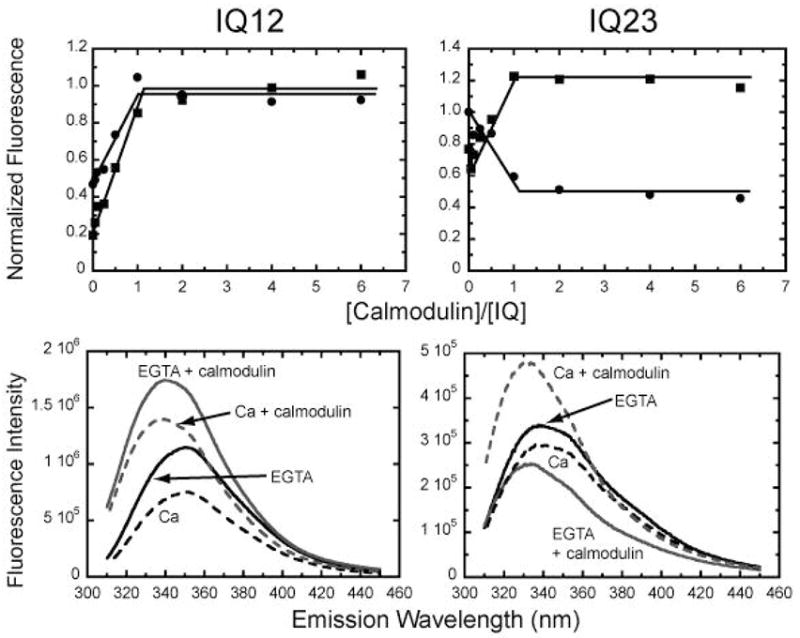
(Top) Fluorescence intensity (λex = 295 nm, λem = 350 nm) of (left) 0.5 μM IQ12 and (right) 0.5 μM IQ23 titrated with 0 – 6 μM calmodulin in the (●) absence and (■) presence of 100 μM free calcium. Data were normalized to the average maximum intensity of the fluorescence emission in the absence of calcium. Lines are drawn by eye to show stoichiometric binding of calmodulin to the IQ motifs. (Bottom) Fluorescence emission spectra of (left) IQ12 and (right) IQ23 in the absence and presence of calmodulin.
Kinetics of L-CaM binding to IQ12 and IQ23
We used FRET from the tryptophans in IQ12 and IQ23 to L-CaM to measure the kinetics of the IQ-calmodulin interaction (see Methods). We confirmed that we could detect L-CaM binding to IQ12 and IQ23 with the same stoichiometry as observed by monitoring the tryptophan fluorescence. The fluorescence of L-CaM increased with increasing concentrations of IQ12 until it reached saturation at a ratio of one calmodulin per IQ-motif (2 calmodulins per peptide) in the absence and presence of 100 μM free calcium (Figure 4). The fluorescence of L-CaM also increased with increasing concentrations of IQ23 until it reached saturation at one calmodulin per IQ motif (2 L-CaM per peptide) in the absence and presence of calcium (Figure 4).
Figure 4. Binding of L-CaM to IQ12 and IQ23 as determined by FRET.
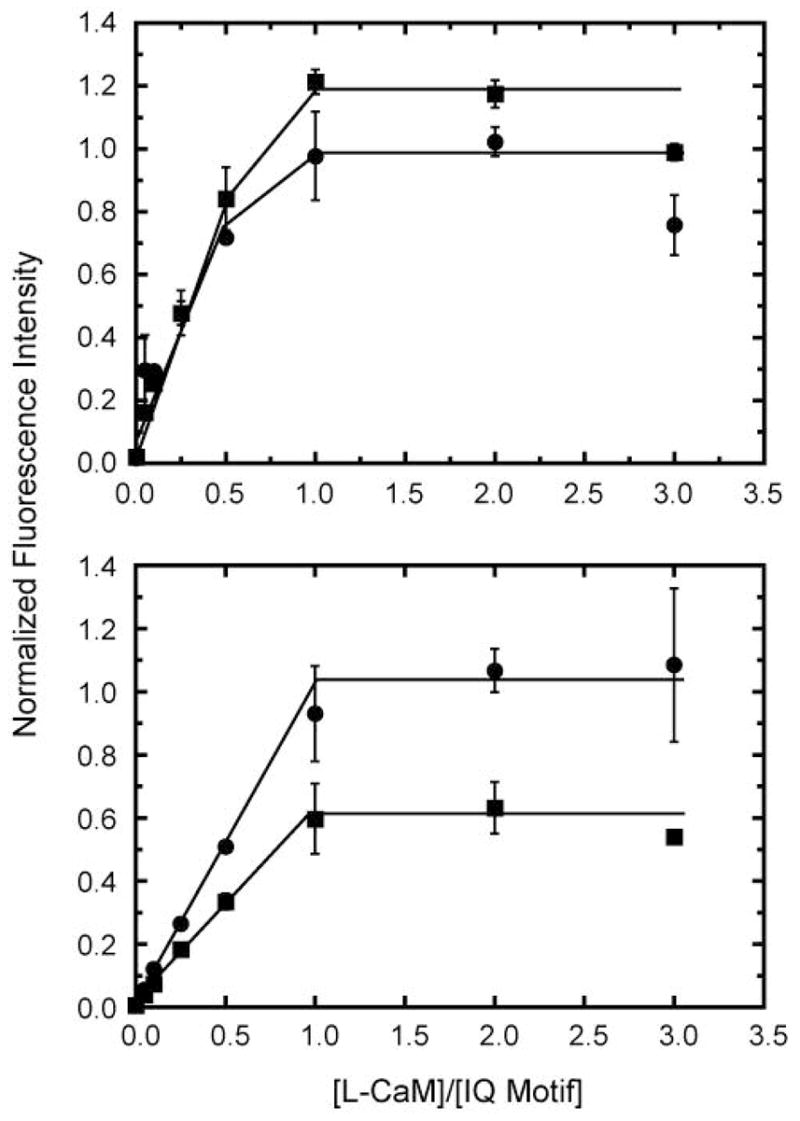
FRET emission intensity (λex = 295 nm, λem = 490 nm) of 0 – 3 μM L-CaM and (top) 0.5 μM IQ12 and (bottom) 0.5 μM IQ23 in the (●) absence and (■) presence of 100 μM free calcium. Lines are drawn by eye and show stoichiometric binding of calmodulin to the IQ motifs.
Stopped-flow fluorescence measurements were used to follow the time course of L-CaM binding to IQ12 and IQ23. We were unable to use pseudo-first-order kinetic methods to determine rate constants for L-Cam-IQ binding, because the FRET signal intensities were too low or the FRET transients were too fast at concentrations that satisfied pseudo-first-order conditions. Therefore, we followed the FRET signal after mixing 0.1 μM L-CaM with 0.05 μM IQ12 or IQ23 in a second-order reaction. We observed biphasic transients in the absence of calcium for both peptides with the fast rising phases occurring largely within the instrument dead-time (Figure 5). The half-times of the increases were ~ 1.5 ms for IQ12 and IQ23. A second, slower phase in which the FRET signal decreased was observed for both IQ12 and IQ23. The relative amplitude of the decrease was smaller for the reaction with IQ23. We were unable to assign spectroscopic changes to specific IQ motifs, so we modeled the reaction as:
| (1) |
where (L-Cam)-IQ** is collision complex, L-Cam-IQ* is a calmodulin-bound state with a lower FRET signal, k1 is the effective rate of binding of the collision complex, and k2 is the effective rate of the conformational change. We are not able to determine reverse rate constants from this experiment. Fitting this model to the IQ12 transient yielded effective rate constants of k1 = 8 × 10⁹ M−1s−1 and k2 = 170 s−1 with the L-Cam-IQ* state having 47% the fluorescence intensity of the (L-Cam)IQ** state. The effective rate contants for L-CaM binding to IQ23 were k1 = 8 × 10⁹ M−1s−1 and k2 = 87 s−1 with the L-Cam-IQ* having 60% the fluorescence intensity of the (L-Cam)IQ* state. Rates of k2 were the same when binding reactions were performed with twice the protein concentrations (not shown), supporting the proposal that k2 reports the rate of a conformational change that occurs after L-CaM binding.
Figure 5. Kinetics of L-CaM binding to IQ12 and IQ23.
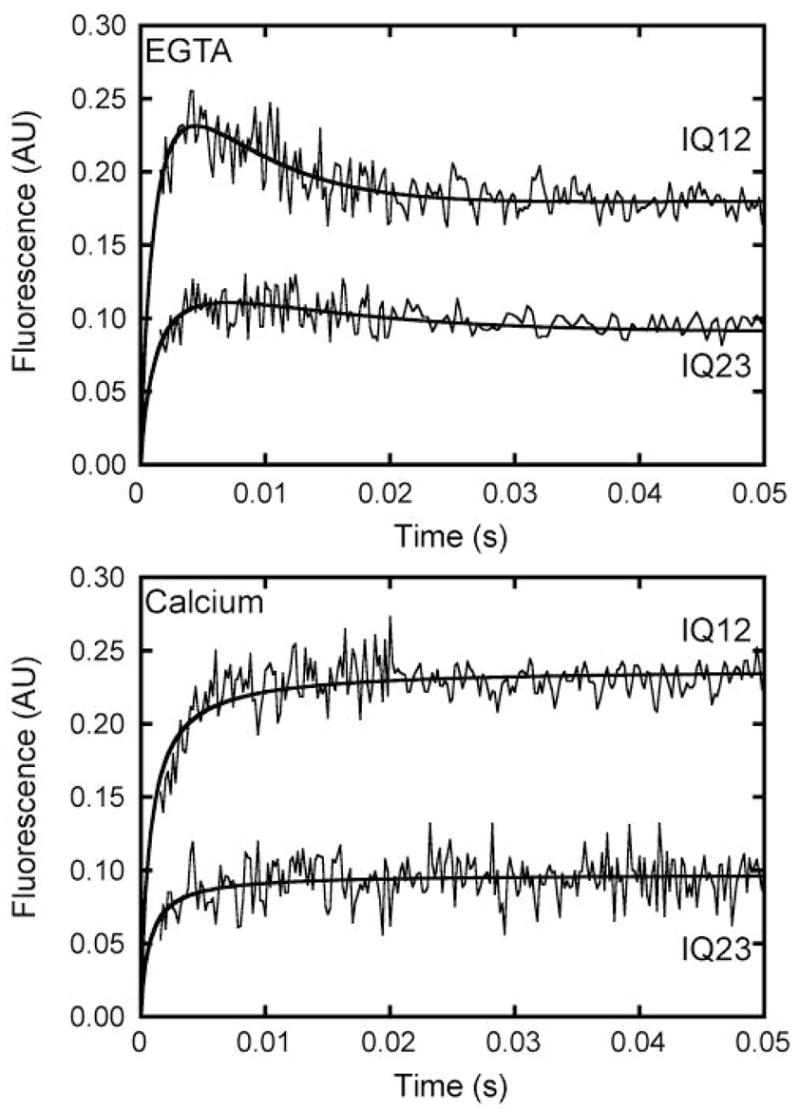
Time courses of FRET emission intensity obtained after mixing 0.05 μM IQ12 or IQ23 with 0.1 μM L-CaM in the (Top) absence or (Bottom) presence of 100 μM free calcium. The solid lines are the best fits to the data as described in the text. Transients are the averages of 14 – 26 individual traces.
In the presence of 100 μM free calcium, FRET signals observed during the binding of 0.1 μM L-CaM to 0.05 μM IQ12 or IQ23 increased in a single phase (Figure 5). The transients were fit to a simple second-order binding reaction resulting in effective rate constants of k1 = 8 × 10¹⁰ M−1 s−1 for IQ12 and k1 = 1 × 10¹⁰ M−1s−1 for IQ23.
Kinetics of L-CaM dissociation from IQ12 and IQ23
The rate of L-CaM dissociation from IQ12 or IQ23 was measured by competition after mixing an equilibrated mixture of 1.25 μM L-CaM plus 0.5 μM IQ12 or 0.5 μM IQ23 with a 50-fold excess of unlabeled calmodulin (concentrations after mixing). The dissociation of the L-CaM from IQ12 or IQ23 was detected by a decrease in FRET from the tryptophans in the IQ motifs to the L-Cam. Mixing the L-CaM - IQ12 complex with unlabeled calmodulin resulted in a fluorescence decrease that reached a final fluorescence level of that found for 0.5 μM IQ12 premixed with 50-fold excess unlabeled calmodulin then mixed with 1.25 μM L-Cam, indicating that the labeled calmodulins were displaced from the peptide. The time course of the fluorescence decrease is best fit to the sum of two exponentials that differ in rate 10-fold, kslow = 0.00067 s−1 and kfast = 0.0065 s−1 (Figure 6; Table 1). When the L-Cam-IQ12 complex was equilibrated with calcium before mixing with the unlabeled calmodulin, the rates were greatly increased to kslow = 0.49 s−1 and kfast = 59 s−1 (Figure 6 and Table 1).
Figure 6. Kinetics of L-CaM dissociation from IQ12 and IQ23.
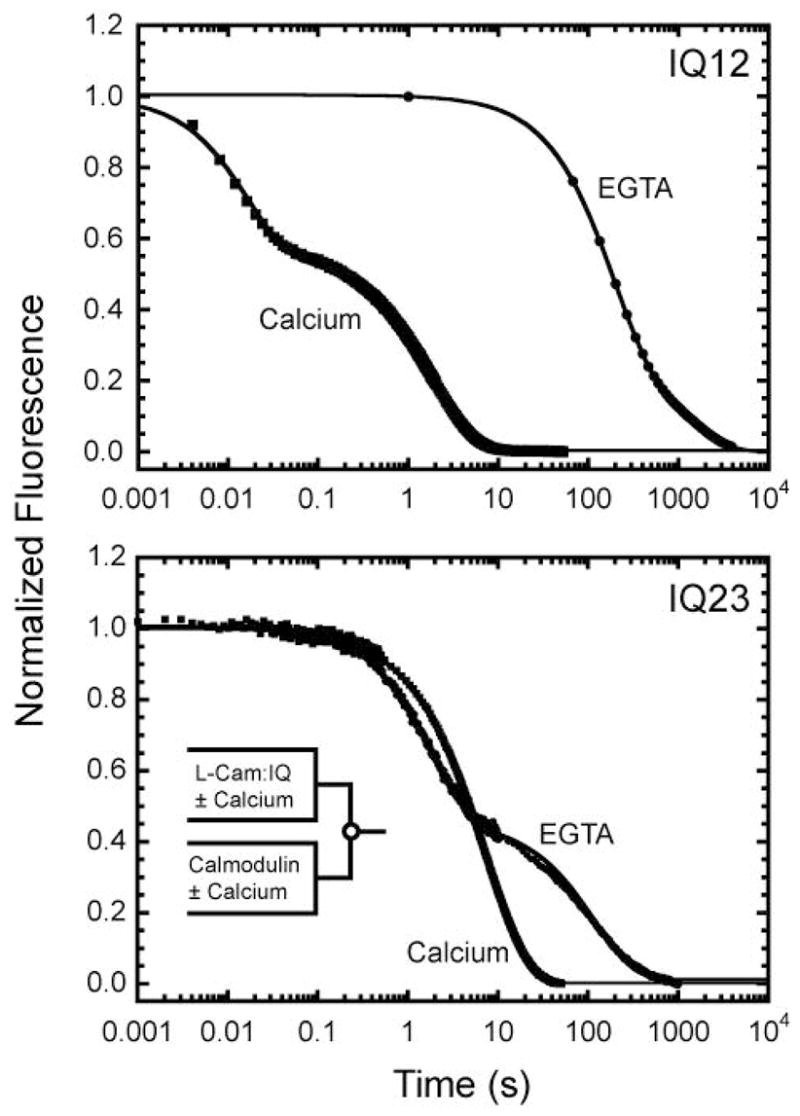
Time courses of FRET emission intensity obtained after mixing equilibrated mixtures of 1.25 μM L-CaM plus (top) 0.5 μM IQ12 or (bottom) 0.5 μM IQ23 in the absence or presence of 100 μM free calcium with a 50-fold excess of unlabeled calmodulin. Solid lines are the best fits to two exponential rate functions. Transients are the averages of five traces.
Table 1.
Dissociation Rates of L-CaM from IQ12 and IQ23a
| EGTA | Calcium | |||
|---|---|---|---|---|
| kslow(s−1) | kfast(s−1) | kslow(s−1) | kfast(s−1) | |
| IQ12 | 0.00067 ± 0.00015 (33 ± 7.4) | 0.0065 ± 0.0015 (66 ± 7.4) | 0.49 ± 0.062 (48 ± 9.2) | 59 ± 4.1 (52 ± 9.2) |
| IQ23 | 0.0071 ± 0.0014 (55 ± 3.4) | 0.53 ± 0.11 (45 ± 3.4) | 0.12 ± 0.01 (79 ± 5.5) | 0.32 ± 0.045 (21 ± 5.5) |
Values are presented as the averages and standard deviations of 10 transients performed on two preparations. Relative amplitudes are given in the parentheses.
Mixing of the L-CaM and IQ23 complex with unlabeled calmodulin also resulted in a decrease in the fluorescence to the level expected for complete exchange of the L-CaM with unlabeled calmodulin (Figure 6). The time course of the fluorescence decrease was best fit by the sum of two exponentials with rates of kslow = 0.0071 s−1 and kfast = 0.53 s−1 (Table 1). The rate of the slow component is similar to kfast observed in the IQ12 experiment (Figure 6), so we propose that this component represents the rate of L-CaM dissociation from IQ2. The time course of the decrease in the presence of calcium was best fit to the sum of two exponentials with rates kslow = 0.12 s−1 and kfast = 0.32 s−1 (Table 1). This kfast is similar to the kslow in the experiment performed with IQ12 in the presence of calcium, so we propose that this component represents the rate of L-CaM dissociation from IQ2.
Kinetics of calcium-induced L-CaM dissociation from IQ12
The rate of L-CaM dissociation from IQ12 was measured upon mixing with calcium (Figure 7). An equilibrated mixture of 0.75 μM L-CaM plus 0.3 μM IQ12 was mixed with a 50-fold excess of unlabeled calmodulin and 100 μM or 1 mM free calcium (concentrations after mixing). High calcium concentrations were used to ensure rapid saturation of calcium binding sites. The time course of the fluorescence decrease due to the dissociation of L-CaM was best fit by the sum of two exponentials with rates kslow = 0.23 s−1 and kfast = 3.3 s−1 at both calcium concentrations (Figure 7). The fast component is > 10-fold slower than the kfast observed when L-CaM dissociated from IQ12 complex pre-equilibrated with calcium. This result suggests that a slow calcium-induced conformational change (3.3 s−1) in the IQ-calmodulin complex precedes rapid dissociation (~ 60 s−1) of calmodulin from IQ1.
Figure 7. Kinetics of calcium-induced dissociation of calmodulin from IQ12.
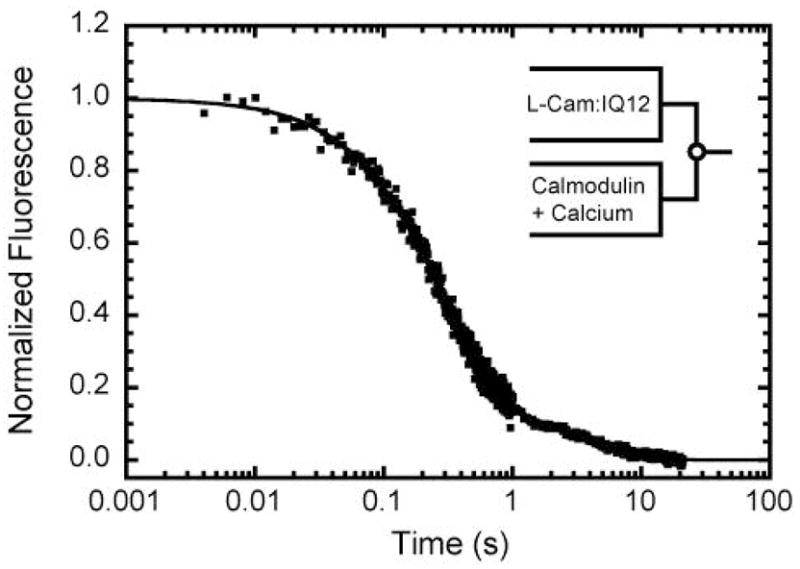
Time course of FRET emission intensity obtained after mixing an equilibrated mixture of 0.75 μM L-CaM and 0.3 μM IQ12 with a 50-fold excess of unlabeled calmodulin and 100 μM free calcium. The solid line is the best fit to a two exponential rate function.
Rotational Dynamics of IQ-motif-bound L-Cam
We used time-resolved fluorescence anisotropy to determine if L-CaM is rigidly bound to myo1cIQ1-3 in the absence and presence of calcium (Figure 8). L-CaM was exchanged onto the regulatory domain of myo1c as described in the Methods. Because of the dynamic nature of calmodulin binding (Table 1), and the long fluorescence acquisition times, the L-CaM is likely distributed onto all three IQ motifs.
Figure 8. Time-resolved fluorescence anisotropy.
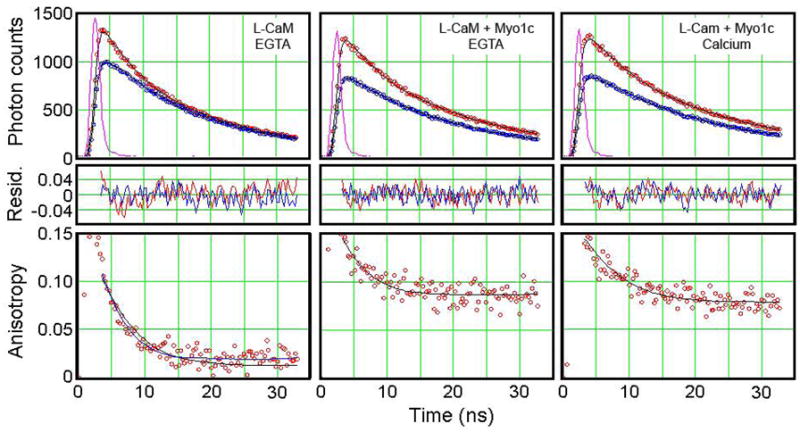
(Top) Time course of fluorescence decay after brief excitation at 337 nm. The samples were L-CaM in the absence of myo1cIQ1-3 (left), L-CaM in the presence of myo1cIQ1-3 and 1 mM EGTA (center), and L-CaM in the presence of myo1cIQ1-3, 1.1 mM calcium, and 1 mM EGTA (right). The instrument response function (IRF) is the ~2 ns intensity spike near zero time. The upper red decay curve in each panel is IVV and the lower blue decay curve is IVH. Symbols are the recorded intensities and the lines are the convolutions of the IRF with a restricted rotational diffusion model. (Center) Plots of normalized residuals [(photon counts - fit)/fit]. (Bottom) Time-resolved anisotropies calculated with a restricted rotational diffusion model with r(0) and r(∞) values given in the text (solid black lines). A model assuming a single rotational decay for L-CaM in the absence of myo1cIQ1-3 (blue line) gives identical results.
In the absence of myosin, the r(0) value of the anisotropy for L-CaM was 0.13 with a rotational correlation time (τ) of 6.0 ns. When bound to myo1cIQ1-3 in the absence of calcium, r(0) = 0.16, τ= 4.0 ns, and r(∞) = 0.08. Assuming a hindered rotational diffusion model (27), these values indicate that binding of the calmodulin to myo1cIQ1-3 restricts rapid rotations of the C-terminal lobe of L-CaM to a cone of half-width 37°. The addition of calcium did not appreciably affect these values, with r(0) = 0.15, τ= 6.3 ns, and r(∞) = 0.07. Thus, in the presence of calcium, the C-terminal lobe of L-CaM remains tightly bound to the myo1c regulatory domain.
DISCUSSION
ATPase and motile activity of myo1c
Calcium increases the actin-activated ATPase activity of myo1cIQ1-3 < 1.5-fold, which is significantly less than the calcium activation of myo1b, where the actin-activated ATPase is increased > 4-fold by calcium (19). Addition of 10 μM calmodulin did not affect the calcium dependence of the ATPase rate, but did result in a ~1.5-fold increase in activity. Additionally, inclusion of calmodulin increased the rate of actin gliding in the in vitro motility assay. These increases are likely due to the replacement of calmodulins that dissociated from the regulatory domain during protein and motility chamber preparation (19). Sedimentation assays indicate that purified myo1b can be purified with fewer than three calmodulins per myosin (see the zero calmodulin point in Figure 2, bottom). The loss of calmodulin may lead to aggregation or inactivation of the molecules in solution, and to lower motility rates due to changes of lever arm structure and stiffness.
Calcium inhibited actin gliding in the in vitro motility assay (Figure 2). This inhibition has been attributed to calcium-induced dissociation of one or more calmodulins from the regulatory domain (15, 17). Motility is rescued in the presence of calcium by the addition of calmodulin at concentrations ≤1 μM. Thus, even though the affinity of calmodulin for the myo1c IQ motifs is apparently weakened by calcium, calmodulin will still bind the IQ motifs in a 1:1 stoichiometry (Figure 2) and thus will support motility.
Our spectroscopic (Figure 3) and kinetic experiments (Figure 6) show that calcium affects the conformation of IQ-motif-bound calmodulin. However, the rate of actin gliding in the presence of calcium and calmodulin is identical to the rate in the absence of calcium (Figure 2). Therefore, in the nearly unloaded conditions of the actin-gliding assay, calcium does not affect myo1c kinetics or step size. This finding contrasts with single-molecule experiments that reported an increase in the myo1c step size from 4.2 nm to 7.2 nm in the presence of calcium (28). We would have expected an increase in the rate of actin gliding with an increase in step size, which was not observed. It is possible that calcium affects the step size when it is generating force under load, but it is also possible that the reported change in step-size is due to non-specific effects of surface attachment used in the single molecule experiments.
The inhibition of actin gliding by calcium in the absence of added calmodulin suggests a loss of lever arm function. This disruption may be due to large-scale conformational changes in the regulatory domain or to the uncoupling of lever arm rotation from the conformational changes in the motor domain. Loss of calmodulin from the IQ motif nearest the motor (IQ1) is suggested by our kinetic experiments (see below). It is unlikely that the inhibition of motility is due only to the dissociation of calmodulins from IQ2 or IQ3, since the loss of the distal calmodulins may simply result in lever arms that are effectively shorter, which would result in slower motility. For example, the loss of distal calmodulins for the myo1b myosin-I isoforms results in a decrease in motility rate, rather than a complete inhibition of motility (19).
Kinetics of calmodulin binding and dissociation
Binding of L-CaM to IQ12 and IQ23 is fast, with the initial phases of the transients occurring largely within the dead-time of the stopped flow instrument (Figure 5). Similar fast, diffusion-limited rates have been observed for calmodulin binding to peptides derived from M13, myosin light chain kinase, and adenylate cyclase (29–31). In the absence of calcium, a second phase is observed in the association transient, which is likely due to a conformational change in the IQ-calmodulin complex that leads to tight binding. The second phase is not observed in the presence of calcium, but it is possible that conformational changes occur after formation of the collision complex that are not detected by changes in FRET. Additionally, a second phase of positive amplitude is not observed in the dissociation reaction indicating that the higher fluorescence state is not significantly populated during dissociation and that k-2 (Scheme 1) is rate-limiting for this reaction. It is important to note that since the rate k1 reports the formation of a collision complex, not a stable equilibrium complex, we can not determine equilibrium dissociation constants for calmodulin binding to the IQ motifs from the ratios of the dissociation rates (Table 1) and these on-rates.
L-CaM dissociation from IQ1 and IQ2 in the absence of calcium is remarkably slow (Table 1). By comparing the dissociation rates from IQ12 and IQ23, we can propose an IQ-specific dissociation model (Figure 9). The rates of dissociation of L-CaM from IQ1 and IQ2 are dramatically increased when complexes are preincubated with calcium, while the rate of dissociation from IQ3 is relatively insensitive to calcium. If we assume that the association rates for all the IQ motifs are similar, then IQ1 has the tightest calmodulin affinity in the absence of calcium and the weakest affinity in the presence of calcium. We therefore propose that motility is inhibited in the presence of calcium at low calmodulin concentrations due to the dissociation of the calmodulin from IQ1. This dissociation results in the uncoupling of the rotation of the lever arm from conformational changes in the motor domain.
Figure 9.
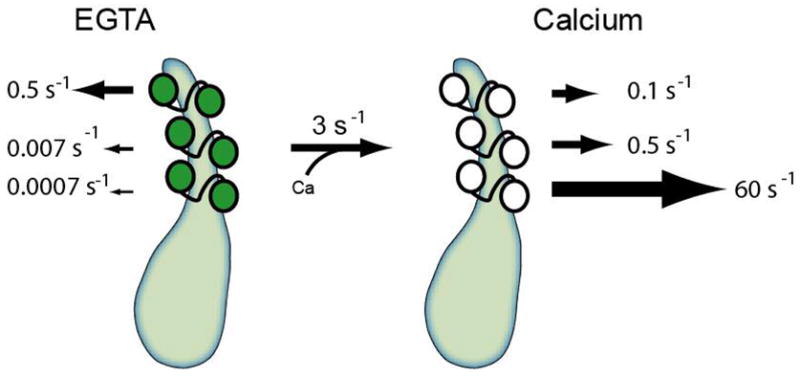
Scheme of calmodulin dissociation from myo1c.
Kinetics of calcium-induced calmodulin dissociation
The kfast rate observed in calcium-induced calmodulin dissociation from IQ12 is > 10-fold slower (Figure 7) than kfast from complexes preincubated with calcium (Figure 6), while the rates of kslow are similar. We propose that the decrease in kfast is due to a calcium-induced conformational change in calmodulin that precedes its dissociation from IQ1 as follows:
| (2) |
where Ca·CaM represents calmodulin saturated with calcium, and Camstrong and Camweak are conformational states of calmodulin that bind strongly and weakly to IQ1. Although this is the simplest scheme that describes the data, it is possible that calcium binding and the Camstrong to Camweak transition occurs in multiple steps. An examination of the calcium concentration dependence of the Camstrong and Camweak transition would help resolve this pathway.
The major interaction of calmodulin with IQ motifs of myosin-V has been shown to be mediated by the C-terminal lobe of calmodulin, where it wraps around the IQ motif in a semi-open conformation (14, 32). The N-terminal lobe is in a closed conformation and interacts more weakly with the myosin-V IQ motif. Thus, if the IQ-calmodulin interaction in myo1c is similar, the slow calcium-induced change in affinity is probably due to a conformational rearrangement of the C-terminal lobe into a weak-binding open conformation. Although this weak-binding state dissociates more rapidly from the IQ motifs, the rotational dynamics of the IQ-bound C-terminal lobes are not affected by calcium binding (Figure 8). Interesting new structural work with myosin-V shows that calcium not only weakens the affinity of calmodulin for the IQ motif, but it can also induces a rotation of the calmodulin relative to the IQ motif resulting in a conformational change in the lever arm (33).
The rate of calcium-induced dissociation of calmodulin from IQ2 is within a factor of 2 of the rate of dissociation of calcium-saturated calmodulin, implying that the calcium-induced conformational change that leads to the weaker affinity must be faster than the dissociation rate, and it is not resolvable. The rate of L-CaM dissociation from IQ3 is relatively insensitive to calcium, so if a similar calcium-induced conformational change occurs, it does not affect the dissociation rate.
Cellular implications
Calcium dramatically increases the rate at which calmodulin dissociates from IQ1 (Figure 6, Table 1), which likely results in a large decrease in IQ-calmodulin affinity. It has been reported that the free calmodulin concentration in live cells decreases to < 200 nM in the presence of 4 μM calcium (34). Under such conditions, it is possible that IQ1 would be calmodulin-free, and motility would be inhibited. Thus, transient changes in the cellular calcium concentration may act to inhibit myo1c activity, in a calmodulin concentration dependent manner, at a maximum rate of 3 s−1.
Myo1c has been implicated in mechano-signal transduction in sensory hair cells, and calcium binding to calmodulin-bound myo1c has been proposed to mediate fast adaptation by affecting the stiffness of the actomyosin crossbridge (2, 23). However, the rate of fast adaptation is significantly faster in vestibular hairs cells (> 10 s−1; (23)) and auditory hair cells (> 100 s−1; (35)) than the rate of the calcium-induced conformational change in calmodulin that precedes dissociation (3 s−1; Figure 7). If these kinetics apply within cells, it is not likely that fast adaptation is the result of calmodulin dissociation. If fast adaptation is due to calcium binding to myo1c-bound calmodulin, a distinct conformational state must be populated at a rate faster than the population of Camweak state (Scheme 2).
While it is clear that unloaded mechanical activity is unchanged by calcium binding under saturating calmodulin concentrations, it is not known if calcium affects the mechanical properties of the motor when it is under strain. It is likely that the actin-detachment kinetics of myo1c are load dependent, with resisting loads markedly decreasing detachment rate from actin (28). Calcium binding may affect the stiffness of the actomyo1c crossbridge and thereby attachment lifetime. Further mechanical experiments are required to better understand this regulation.
ABBREVIATIONS
- IAEDANS
5-((((2-iodoacetyl)amino)ethyl)amino)naphthalene-1-sulfonic acid
- IQ12
truncated regulatory domain residues 698–743
- IQ23
truncated regulatory domain residues 721–767
- L-Cam
N111C-CaM labeled with IAEDANS
- N111C-Cam
calmodulin with a cystein point mutation
- myo1cIQ1-3
expressed myo1c protein construct containing the motor domain and a regulatory domain with bound calmodulin
Footnotes
EMO was supported by grants from the National Institutes of Health (GM57247 and AR051174). JHL was supported by a training grant from the National Institute of Arthritis and Musculoskeletal and Skin Diseases (AR053461).
References
- 1.Gillespie PG. Myosin I and adaptation of mechanical transduction by the inner ear. Philos Trans R Soc Lond B Biol Sci. 2004;359:1945–1951. doi: 10.1098/rstb.2004.1564. [DOI] [PMC free article] [PubMed] [Google Scholar]
- 2.Holt JR, Gillespie SK, Provance DW, Shah K, Shokat KM, Corey DP, Mercer JA, Gillespie PG. A chemical-genetic strategy implicates myosin-1c in adaptation by hair cells. Cell. 2002;108:371–381. doi: 10.1016/s0092-8674(02)00629-3. [DOI] [PubMed] [Google Scholar]
- 3.Hokanson DE, Ostap EM. Myo1c binds tightly and specifically to phosphatidylinositol 4,5-bisphosphate and inositol 1,4,5-trisphosphate. Proc Natl Acad Sci U S A. 2006;103:3118–3123. doi: 10.1073/pnas.0505685103. [DOI] [PMC free article] [PubMed] [Google Scholar]
- 4.Hokanson DE, Laakso JM, Lin T, Sept D, Ostap EM. Myo1c Binds Phosphoinositides through a Putative Pleckstrin Homology Domain. Mol Biol Cell. 2006;17:4856–4865. doi: 10.1091/mbc.E06-05-0449. [DOI] [PMC free article] [PubMed] [Google Scholar]
- 5.Bose A, Robida S, Furcinitti PS, Chawla A, Fogarty K, Corvera S, Czech MP. Unconventional myosin Myo1c promotes membrane fusion in a regulated exocytic pathway. Mol Cell Biol. 2004;24:5447–5458. doi: 10.1128/MCB.24.12.5447-5458.2004. [DOI] [PMC free article] [PubMed] [Google Scholar]
- 6.Bose A, Guilherme A, Robida SI, Nicoloro SM, Zhou QL, Jiang ZY, Pomerleau DP, Czech MP. Glucose transporter recycling in response to insulin is facilitated by myosin Myo1c. Nature. 2002;420:821–824. doi: 10.1038/nature01246. [DOI] [PubMed] [Google Scholar]
- 7.Pestic-Dragovich L, Stojiljkovic L, Philimonenko AA, Nowak G, Ke Y, Settlage RE, Shabanowitz J, Hunt DF, Hozak P, de Lanerolle P. A myosin I isoform in the nucleus. Science. 2000;290:337–341. doi: 10.1126/science.290.5490.337. [DOI] [PubMed] [Google Scholar]
- 8.Tang N, Lin T, Ostap EM. Dynamics of myo1c (myosin-ibeta) lipid binding and dissociation. J Biol Chem. 2002;277:42763–42768. doi: 10.1074/jbc.M206388200. [DOI] [PubMed] [Google Scholar]
- 9.Houdusse A, Silver M, Cohen C. A model of Ca(2+)-free calmodulin binding to unconventional myosins reveals how calmodulin acts as a regulatory switch. Structure. 1996;4:1475–1490. doi: 10.1016/s0969-2126(96)00154-2. [DOI] [PubMed] [Google Scholar]
- 10.Bahler M, Rhoads A. Calmodulin signaling via the IQ motif. FEBS Lett. 2002;513:107–113. doi: 10.1016/s0014-5793(01)03239-2. [DOI] [PubMed] [Google Scholar]
- 11.Holmes KC, Geeves MA. The structural basis of muscle contraction. Philos Trans R Soc Lond B Biol Sci. 2000;355:419–431. doi: 10.1098/rstb.2000.0583. [DOI] [PMC free article] [PubMed] [Google Scholar]
- 12.Rayment I, Rypniewski WR, Schmidt-Base K, Smith R, Tomchick DR, Benning MM, Winkelmann DA, Wesenberg G, Holden HM. Three-dimensional structure of myosin subfragment-1: a molecular motor. Science. 1993;261:50–58. doi: 10.1126/science.8316857. [DOI] [PubMed] [Google Scholar]
- 13.Terrak M, Rebowski G, Lu RC, Grabarek Z, Dominguez R. Structure of the light chain-binding domain of myosin V. Proc Natl Acad Sci U S A. 2005;102:12718–12723. doi: 10.1073/pnas.0503899102. [DOI] [PMC free article] [PubMed] [Google Scholar]
- 14.Houdusse A, Gaucher JF, Krementsova E, Mui S, Trybus KM, Cohen C. Crystal structure of apo-calmodulin bound to the first two IQ motifs of myosin V reveals essential recognition features. Proc Natl Acad Sci U S A. 2006;103:19326–19331. doi: 10.1073/pnas.0609436103. [DOI] [PMC free article] [PubMed] [Google Scholar]
- 15.Zhu T, Beckingham K, Ikebe M. High affinity Ca2+ binding sites of calmodulin are critical for the regulation of myosin Ibeta motor function. J Biol Chem. 1998;273:20481–20486. doi: 10.1074/jbc.273.32.20481. [DOI] [PubMed] [Google Scholar]
- 16.Zhu T, Sata M, Ikebe M. Functional expression of mammalian myosin I beta: analysis of its motor activity. Biochemistry. 1996;35:513–522. doi: 10.1021/bi952053c. [DOI] [PubMed] [Google Scholar]
- 17.Collins K, Sellers JR, Matsudaira P. Calmodulin dissociation regulates brush border myosin I (110-kD-calmodulin) mechanochemical activity in vitro. J Cell Biol. 1990;110:1137–1147. doi: 10.1083/jcb.110.4.1137. [DOI] [PMC free article] [PubMed] [Google Scholar]
- 18.Williams R, Coluccio LM. Novel 130-kDa rat liver myosin-1 will translocate actin filaments. Cell Motil Cytoskeleton. 1994;27:41–48. doi: 10.1002/cm.970270105. [DOI] [PubMed] [Google Scholar]
- 19.Lin T, Tang N, Ostap EM. Biochemical and motile properties of Myo1b splice isoforms. J Biol Chem. 2005;280:41562–41567. doi: 10.1074/jbc.M508653200. [DOI] [PubMed] [Google Scholar]
- 20.Gillespie PG, Cyr JL. Calmodulin binding to recombinant myosin-1c and myosin-1c IQ peptides. BMC Biochem. 2002;3:31. doi: 10.1186/1471-2091-3-31. [DOI] [PMC free article] [PubMed] [Google Scholar]
- 21.Wagner MC, Barylko B, Albanesi JP. Tissue distribution and subcellular localization of mammalian myosin I. J Cell Biol. 1992;119:163–170. doi: 10.1083/jcb.119.1.163. [DOI] [PMC free article] [PubMed] [Google Scholar]
- 22.Ruppert C, Godel J, Muller RT, Kroschewski R, Reinhard J, Bahler M. Localization of the rat myosin I molecules myr 1 and myr 2 and in vivo targeting of their tail domains. J Cell Sci. 1995;108(Pt 12):3775–3786. doi: 10.1242/jcs.108.12.3775. [DOI] [PubMed] [Google Scholar]
- 23.Stauffer EA, Scarborough JD, Hirono M, Miller ED, Shah K, Mercer JA, Holt JR, Gillespie PG. Fast adaptation in vestibular hair cells requires myosin-1c activity. Neuron. 2005;47:541–553. doi: 10.1016/j.neuron.2005.07.024. [DOI] [PMC free article] [PubMed] [Google Scholar]
- 24.Putkey JA, Slaughter GR, Means AR. Bacterial expression and characterization of proteins derived from the chicken calmodulin cDNA and a calmodulin processed gene. J Biol Chem. 1985;260:4704–4712. [PubMed] [Google Scholar]
- 25.De La Cruz EM, Sweeney HL, Ostap EM. ADP inhibition of myosin V ATPase activity. Biophys J. 2000;79:1524–1529. doi: 10.1016/S0006-3495(00)76403-4. [DOI] [PMC free article] [PubMed] [Google Scholar]
- 26.Patton C, Thompson S, Epel D. Some precautions in using chelators to buffer metals in biological solutions. Cell Calcium. 2004;35:427–431. doi: 10.1016/j.ceca.2003.10.006. [DOI] [PubMed] [Google Scholar]
- 27.Lakowicz JR. Principles of Fluorescence Spectroscopy. 2. Kluwer Academic/Plenum Publishers; New York: 1999. [Google Scholar]
- 28.Batters C, Arthur CP, Lin A, Porter J, Geeves MA, Milligan RA, Molloy JE, Coluccio LM. Myo1c is designed for the adaptation response in the inner ear. Embo J. 2004;23:1433–1440. doi: 10.1038/sj.emboj.7600169. [DOI] [PMC free article] [PubMed] [Google Scholar]
- 29.Brown SE, Martin SR, Bayley PM. Kinetic control of the dissociation pathway of calmodulin-peptide complexes. J Biol Chem. 1997;272:3389–3397. doi: 10.1074/jbc.272.6.3389. [DOI] [PubMed] [Google Scholar]
- 30.Torok K, Trentham DR. Mechanism of 2-chloro-(epsilon-amino-Lys75)-[6-[4-(N, N - diethylamino)phenyl]-1,3,5-triazin-4-yl]calmodulin interactions with smooth muscle myosin light chain kinase and derived peptides. Biochemistry. 1994;33:12807–12820. doi: 10.1021/bi00209a012. [DOI] [PubMed] [Google Scholar]
- 31.Craescu CT, Bouhss A, Mispelter J, Diesis E, Popescu A, Chiriac M, Barzu O. Calmodulin binding of a peptide derived from the regulatory domain of Bordetella pertussis adenylate cyclase. J Biol Chem. 1995;270:7088–7096. doi: 10.1074/jbc.270.13.7088. [DOI] [PubMed] [Google Scholar]
- 32.Terrak M, Wu G, Stafford WF, Lu RC, Dominguez R. Two distinct myosin light chain structures are induced by specific variations within the bound IQ motifs-functional implications. Embo J. 2003;22:362–371. doi: 10.1093/emboj/cdg058. [DOI] [PMC free article] [PubMed] [Google Scholar]
- 33.Trybus KM, Gushchin MI, Lui H, Hazelwood L, Krementsova EB, Volkmann N, Hanein D. Effect of calcium on calmodulin bound to the IQ motifs of myosin V. J Biol Chem. 2007 doi: 10.1074/jbc.M701636200. [DOI] [PubMed] [Google Scholar]
- 34.Black DJ, Tran QK, Persechini A. Monitoring the total available calmodulin concentration in intact cells over the physiological range in free Ca2+ Cell Calcium. 2004;35:415–425. doi: 10.1016/j.ceca.2003.10.005. [DOI] [PubMed] [Google Scholar]
- 35.Kennedy HJ, Evans MG, Crawford AC, Fettiplace R. Fast adaptation of mechanoelectrical transducer channels in mammalian cochlear hair cells. Nat Neurosci. 2003;6:832–836. doi: 10.1038/nn1089. [DOI] [PubMed] [Google Scholar]