

Abstract
The promise of mass spectrometry as a tool for probing signal-transduction is predicated on reliable identification of post-translational modifications. Phosphorylations are key mediators of cellular signaling, yet are hard to detect, partly because of unusual fragmentation patterns of phosphopeptides. In addition to being accurate, MS/MS identification software must be robust and efficient to deal with increasingly large spectral data sets. Here, we present a new scoring function for the Inspect software for phosphorylated peptide tandem mass spectra for ion-trap instruments, without the need for manual validation. The scoring function was modeled by learning fragmentation patterns from 7677 validated phosphopeptide spectra. We compare our algorithm against SEQUEST and X!Tandem on testing and training data sets. At a 1% false positive rate, Inspect identified the greatest total number of phosphorylated spectra, 13% more than SEQUEST and 39% more than X!Tandem. Spectra identified by Inspect tended to score better in several spectral quality measures. Furthermore, Inspect runs much faster than either SEQUEST or X!Tandem, making desktop phosphoproteomics feasible. Finally, we used our new models to reanalyze a corpus of 423 000 LTQ spectra acquired for a phosphoproteome analysis of Saccharomyces cerevisiae DNA damage and repair pathways and discovered 43% more phosphopeptides than the previous study.
Keywords: Phosphoproteomics, Scoring, High-throughput proteomics, Post-translational modifications
1. Introduction
Finding sites of protein modification has been of great interest in proteomics.1 Protein phosphorylation, which regulates many cellular processes,2 has been a prime target of research. To enable the large-scale discovery of protein phosphorylation sites, a variety of experimental techniques have been developed for phosphopeptide enrichment.3–5 As a result, tandem mass spectrometry has been widely used to annotate the phosphoproteome of both whole cells,6–12 and subcellular fractions.13–15 As the protocols for isolating phosphopeptides improve, the bottleneck for phosphopeptide identification has shifted to data interpretation of the MS/MS spectra. Most search algorithms are not optimized specifically for phosphopeptide spectra which could have very different characteristics.
Phosphopeptide fragmentation under collision induced disassociation (CID) is perceptibly different from unmodified peptides. Cleavage is highly biased to the phosphoester bond.16 Phosphate loss from the precursor typically dominates the MS/MS spectrum, averaging 20–30% of the total ion current. Moreover, b/y ions also frequently lose the phosphate, further weakening the signal of the b/y ladder, complicating peptide identification. Highlighting the difficulty of accurate phosphopeptide identification are studies which set a weak score cutoff followed by either exhaustive manual validation,13,15 or substantial postprocessing techniques to obtain a low false discovery rate.6,9 Such attempts to recover misscored false-negatives require subjective intervention to ensure quality identifications. Although manual validation is invaluable for gaining an overall confidence in the results, its application to phosphoproteome scale searches (tens of thousands of spectra) is neither realistic nor prudent.17
Current algorithmic improvements for phosphopeptide identification focus on postprocessing instead of the original scoring function. Lu et al. developed criteria for automated validation which judges annotations based on characteristics of phosphopeptide spectra.18 Because of the potential ambiguity in the placement of the phosphate group within the peptide, Beausoleil and colleagues have developed a confidence metric for phosphate localization.17 While validation and localization are important, they help primarily in reducing false positives, but not false negatives. To overcome poor scoring of false negatives, a scoring function must be trained to discriminate annotations based on the unique fragmentation probabilities of phosphopeptide spectra. Moreover, the development of an improved scoring function does not preclude application of postprocessing techniques.
Our strategy for scoring phosphopeptides is based on well-established principles, specifically, that fragmentation of the peptide backbone is not uniform;19–22 all ion types are not equally likely to appear in the spectrum with uniform intensity. Classic examples include proline directed fragmentation and the isotopic envelope: fragmentation N-terminal to a proline produces more intense b/y ions than fragmentation C-terminal to the proline; isotopic peaks (e.g., y + 1) rarely occur without the monoisotopic peak. More generally, the expected intensity of an ion can change based on flanking residue, related peak presence or other factors. If we consider annotations in context, we obtain a more discerning scoring function. The main contribution of our paper is an automated system that learns the fragmentation propensities and peak dependencies of phosphopeptides using a large training corpus of annotated spectra. We use this knowledge to devise a Bayesian network23 based scoring function for the Inspect software.24
Our new algorithm outperforms current algorithms (SEQUEST, COMET, X!Tandem) in both speed and accuracy on large training and testing data sets of spectra acquired on ion-trap instruments. On a small test set of 6410 spectra, at a fixed false-discovery rate for each program (1%), Inspect had the highest true-positive rate, annotating 13% more spectra than SEQUEST and 39% more than X!Tandem. Additionally, when we reanalyze a previously published data set of 423 000 spectra, we recover 43% more phosphopeptides than the original work.25 A better recovery of phosphopeptides from the spectra provides a more complete view of the phosphoproteome, enabling researchers to better understand the dynamic signaling processes of the cell. Furthermore, the run time was 1 or 2 orders of magnitude faster than current algorithms, making desktop phosphoproteome analysis possible. The new models have been incorporated into the Inspect software package, which is freely available for download from our Web server, http://peptide. ucsd. edu/. In addition to the strong performance of the new models, we discuss the distinct characteristics of phosphopeptide fragmentation probabilities and the use of Bayesian networks for probabilistic scoring, both of which are of independent interest.
2. Materials and Methods
2.1. Overview
MS/MS peptide identification programs typically have four major stages: spectral-preprocessing, database filtering (searching), scoring and validation.26 Each stage functions as a distinct module within Inspect. Ion-trap instruments, like the LTQ, are the workhorse instrument of proteomics. However, the accuracy of these instruments necessitates the preprocessing steps of parent mass correction and charge state determination. The experimental parent mass is often off by 2–3 Da. Moreover, the charge state of an LTQ spectrum is ambiguous because the isotopic envelope of the precursor cannot be established. High accuracy instruments such as a QTOF or Orbitrap may not require these corrections.
After parent mass and charge state are determined, the spectrum is searched against a protein database to produce a list of candidate annotations. Database filtering is used to rapidly eliminate many of the peptides from the database without explicitly scoring them. Parent-mass based filters are common but not as effective when dealing with post-translational modifications. Inspect uses a tag-based search for filtering by performing a partial de novo interpretation during preprocessing.24 Tag-based filtering is orders of magnitude more efficient than other filters, but requires accurate tagging.
The filtered peptides are rank-ordered based on scoring against the spectrum. This score represents how well the annotation agrees with the spectrum's peak list. The best candidate peptide should get the highest score, followed by the next best candidate, and so on. Even with an accurate scoring function, the top-scoring peptide might still not be the correct one. It could be, for example, that the correct peptide is not in the database, or that there is not enough information in the spectrum to distinguish between the top two peptides. A final validation step is used to determine the probability that the top scoring peptide is the correct one. In this work, we focus on the preprocessing and scoring steps in the context of phosphorylated peptides. The filtering and validation steps remain unchanged. The new models are incorporated into the Inspect software version 2007.07.12 and later.
2.2. Parent Mass Correction
Correcting the observed parent mass is a crucial preprocessing step for any de novo MS/MS program.27 Inspect's tag generation utilizes a partial de novo interpretation of the spectrum, and is therefore sensitive to erroneous parent mass values. Peptide fragmentation creates matching b/y ion pairs, whose mass sums to the parent mass of the precursor ion. Thus, given a spectrum, we can determine the parent mass by finding matching b/y ion pairs. Our parent mass correction routine is based on spectrum self-convolution introduced by Dancík et al.27 Define M as the measured mass of the charge 1 precursor ion; Pi as the m/z of the ith peak in a spectrum; I(v) is the intensity of the peak at mass value v (binned to 0.3 Da). Dancík corrected the parent mass of a spectrum within the range [M−∊, M+∊] as
| (1) |
The intuition here is that at the correct parent mass, M*, we will see a large number of high intensity cognate pairs corresponding to the b/y ladder.27,28
We extend this algorithm in two ways, exploiting the neutral losses from phosphopeptides. Here, it is necessary to define the two types of phosphate neutral losses from peptides. The loss of phosphate from a b or y ion is called a fragment neutral loss. The second ion type is neutral loss from the precursor ion, or M − p. These two distinct ion types are used in different ways in the models.
Our first extension to the Dancík algorithm is the inclusion of a mass offset into the convolution. In addition to the cognate pair at (Pi, M* − Pi), we also expect to see a pair at (Pi, M* − Pi + 1), corresponding to matching a +1 isotope, for example, b/y + 1 or b + 1/y. Similarly we would expect to see cognate pairs from neutral losses. We modify the original convolution equation to take as input an arbitrary offset, O:
| (2) |
Using the training data as input, we plot fm,o for all values of O between −101 and +4 (Figure 1). The highest fm,o values represent offsets for which intense pairs (Pi, − Pi + O) were found. For example, when no offset is applied (Figure 1, x = 0), eq 2 sums the intensity of all b/y peak pairs in the training set. The strong peaks at −18 and −17 (water and ammonia loss) and +1 (isotopic peak) all correspond to known biological events. A strong peak was observed at −98, phosphate loss. Unfortunately, this feature did not add discriminatory power to the parent mass correction model; see Results and Discussion for a possible explanation. On the basis of these observations, we define a feature vector . At the correct parent mass, we expect to see strong values in .
Figure 1.

Self-convolution of spectra in the training data set. A spectrum self-convolution, as described by Dancík et al.,27 is the product of a spectrum and its reflection. Formally, eq 1 describes it as the product of intensity of a peak and its cognate. Eq 2 introduces a mass offset, O, applied to the cognate peak. In this figure, O is plotted along the x-axis. The y-axis represent the value of the convolution in intensity units. As the self-convolution in eq 2 is applied to many spectra (all spectra in the training set), frequently observed offsets stand out. x = 0 represents the matching of b and y ions. The peak at x=1 represents matching of an isotope to the b/y ladder: b + 1 and y, or b and y + 1. The peaks at −18, −17 and −98 correspond to the neutral losses of water and ammonia and phosphate. The peak for phosphate loss is not used in the final model. See Results and Discussion for possible explanation.
Our second extension of the Dancík algorithm is the explicit use of the precursor neutral loss. For phosphopeptides, we expect to see an intense neutral loss from the precursor, M − p. We model this by the intensity and skew of the peak from the expected position, m/z − 98/z. The most intense peak at this location (±0.5 Da) is assigned the M − p identity. Its intensity, Ip, and skew from expected location, Sp, are added to the feature set. We use the feature set as input to a Linear Discriminant Analysis model for distinguishing the correct mass from a range. Formally,
| (3) |
The model was trained to find the optimal linear combination of features by comparing correct and incorrect parent mass values for spectra in the training set. We show in Results and Discussion that this model vastly outperforms models for unmodified spectra. For charge state correction, we closely follow the features and methods of Klammer et al.,29 but include the M − p peak intensity as an additional feature.
2.3. Scoring
Inspect's scoring function comprises six features: percent of total ion current explained by the annotation, fraction of b ions observed, fraction of y ions observed, length of the peptide, number of enzymatically digested end points, and the cut-score (described below). Values for each of these features are used as input into a Support Vector Machine,30 which returns the final score of Inspect, the MQScore. A new set of fragmentation probabilities impacts only the cut score, as explained below.
Note that a peptide (with parent residue mass PM) can be described by a set of cuts, or prefix residue masses P1 < P2 < … <PM. Note that if a certain cut Pj is indeed a true cut for the spectrum, we will see many peaks corresponding to the fragment ions that support this cut (b, y, b − H2O). Figure 2 illustrates this for the peptide RGSphosDVEDASNAK. CID fragmentation between the seventh and eighth residue (cut P7) predominantly produces b7 and y5. However, we also see other related ions. Following Frank and Pevzner,31 let denote the probability of detecting a set of ions, , given that Pj is a valid cut of the spectrum S. From Figure 2, Pj is P7; is [b7, b7 + 1, b7 − H3PO4, y5, y5 + 1, y5 − NH3, and y5 − H2O]. As the null hypothesis, let denote the probability of observing by chance. The cut-score of a peptide is given by Σj score(Pj, S) where,
| (4) |
The critical part of this is the determination of given that the occurrence of fragment ions are not independent. It is usually not possible to estimate all dependencies due to lack of sufficient training samples. We approximate this with a Bayesian network23 described by a directed acyclic graph on the ion-types with limited outgoing edges (dependencies) for each ion-type. Let Iπ(i) denote the set of ions that Ii depends upon. Then,
| (5) |
The set of dependencies Iπ(i) is not well-understood for phosphopeptides. Therefore, we computed a minimum entropy architecture based on observed fragmentation in our training data set.
Figure 2.

A cut of the peptide. When the peptide RGSphosDVEDASNAK is fragmented between the seventh and eighth residue, the predominant resulting species are b7 (RGSphosDEVD) and y5 (ASNAK). Seven peaks support the this cut of the peptide, each adding to the confidence in the assignment. Zoom-in images around b7 and y5 show the related ions (*) present in this cut. In the b7 image, related ions include b7 + 1 and b7 − 98. In the y5 image, related ions include y5 + 1, y5 − 17 and y5 − 18. Note the break in the y-axis scale.
To get robust estimates of conditional probabilities, each possible combination of values should have a potentially large number of observed instances. To prevent the network from being too large and to ensure that the calculated statistics are well-formed, we only include as nodes the ion types which are regularly observed in phosphopeptide CID fragmentation. We required an observed frequency of 1 instance per spectrum. Observed frequency was calculated by making an offset frequency histogram27 of all spectra in the training set, Figure 3. Also, we generalize this framework slightly. Nodes in the network include ion type and also associated meta data. The ion-types are listed in Table 1. A variety of meta data was investigated. Only those with a high information content were kept: amino acid flanking the break, spectrum region (divide m/z range into 5 equally sized bins), and whether the phosphate group is on this fragment of the peptide (ContainPhos).
Figure 3.

The offset frequency function of b ions. Offsets from the prefix residue mass are plotted.27 Offsets in black are the regularly occurring ions included in the model. Offsets in gray are not included. The strong gray offsets (e.g., −113) were discovered to be parts of the b/y ladder and not a novel neutral loss. Differentiating offsets caused by regularly occurring neutral losses from offsets caused by neighboring b peaks was done by iteratively removing the strongest offset from the spectra and repeating the analysis.
Table 1.
Ion Seta
| C-terminal ions | y, y + 1, y + 2, y − H2O, y − NH3, y − H3PO4 |
| N-terminal ions | b, b + 1, b − H2O, b − NH3, b − H3PO4, b − H2O − H3PO4, b − NH3 − H3PO4 |
| fragments with a +2 charge |
y2+, y2+ + 1, y2+ − H2O, y2+ − NH3, y2+ − H3PO4 |
| b2+, b2+ + 1, b2+ − H2O, b2+ − NH3, b2+ − H3PO4 |
Ions included in the Bayesian Network.
To estimate PCID(Ij|Iπ(j), S, Pj), we tabulated the values for these nodes for each cut of each spectrum in the training set. From this large table, we calculated both entropy (Shannon information entropy) and conditional entropy. Bayesian networks require a topological ordering for the directed acyclic graph. As many network reconstructions are possible, to algorithmically compute the optimal ordering would require a much larger training data set. Therefore, we use an ordering based on ion prevelance, or the fraction of possible ions (for a given ion type) observed in the training data. When including the nonion type nodes, our final order was: spectrum region, flanking amino acid, ContainPhos, and the ion list as ordered above, Table 1. Let Pred(X) denote the set of nodes that precede node X in the node order. To construct the network, we choose at most 2 parent nodes (i.e., Iπ(j)) for each node (i.e., Ij). Thus,
| (6) |
An example probability table is shown in Table 2. Peak binning into strong, medium, weak, and absent are based off the median peak intensity, and is a learned parameter. The set of Iπ(j) comprises the Bayesian network as shown in Figure 4. After the network structure is finalized, conditional probability tables representing the ion profiles are stored and this becomes our Bayesian model.
Table 2.
Conditional Probability Table a
|
PCID(Ij|Iπ(j), S, Pj) |
|||
|---|---|---|---|
| Iπ(j) intensity | Ij intensity |
Ij = b − H3PO4 Iπ(j) = b |
Ij = y − H3PO4 Iπ(j) = y |
| strong | strong | 22.5% | 9.5% |
| strong | medium | 20.4% | 15.2% |
| strong | weak | 3.8% | 4.8% |
| strong | absent | 53.3% | 70.5% |
| medium | strong | 8.1% | 1.7% |
| medium | medium | 25.1% | 11.4% |
| medium | weak | 10.8% | 8.6% |
| medium | absent | 55.9% | 78.4% |
| weak | strong | 3.1% | 0.4% |
| weak | medium | 12.9% | 4.0% |
| weak | weak | 14.5% | 9.4% |
| weak | absent | 69.5% | 86.3% |
| absent | strong | 5.4% | 1.5% |
| absent | medium | 15.9% | 4.1% |
| absent | weak | 9.3% | 4.4% |
| absent | absent | 69.4% | 90.0% |
Using the observed intensity for Ij and Iπ(j), we look up the learned conditional probability and score the peak assignment Ij accordingly. This table shows two conditional probabilities: the third column for b − H3PO4 given b, the fourth column for y − H3PO4 given y. Notice the distinct propensities for fragment neutral loss of a b ion compared to a y ion. For example, a strong b peak produces a medium/strong b − H3PO4 43% of the time. Remembering that on average only 50% of b ions contain the phosphate moiety, almost all phosphorylated b peaks are accompanied by a neutral phosphate loss. In contrast, a strong y peak produces a medium/strong y − H3PO4 only 25% of the time, or roughly half of the fragments containing a phosphate.
Figure 4.
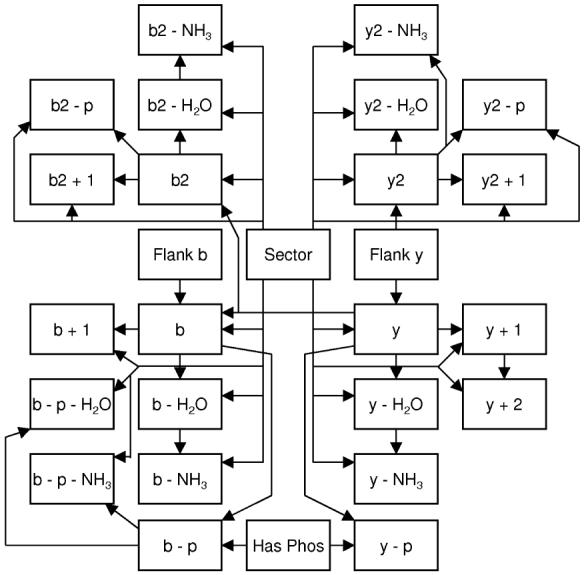
Bayesian network architecture. The nodes and connections of the Bayesian network.
2.4. Generating the Training Set
A total of 62 000 LTQ MS/MS spectra were generated from Saccharomyces cerevisiae and an additional 109 000 LTQ MS/MS spectra were generated from Schizosaccharomyces pombe. These spectra came from whole cell lysates, purified by IMAC as described in Sample Preparation. To obtain a corpus of highly confident phosphorylated spectra, we relied on the overlap in annotation from four independent programs: Inspect,24 SEQUEST,26 COMET,32 and X!Tandem.33 SEQUEST was run on a SageN Sorcerer system; other programs were downloaded and installed on a local linux cluster. Each program searched the data set allowing up to two phosphorylations on serine, threonine, or tyrosine as a variable modification; parent mass tolerance of 3 Da, fragment mass tolerance of 0.5 Da. SEQUEST, COMET, and X!Tandem set a semitryptic cleavage specificity with 2 missed cleavages; Inspect has no such parameter due to the tag, not parent mass, filter. The database for S. cerevisiae was downloaded from http://www.yeastgenome.org on January 12, 2007; the database for S. pombe was downloaded from http://pombe.nci.nih.gov/ genome on July 28, 2006. Each database was concatenated with decoy protein sequences. To create the decoy database, we shuffled each protein record once. Results of Inspect and X!Tandem were ranked based on the provided p-values. SEQUEST results were processed with the trans proteomic pipeline, and the Peptide Prophet p-value was used for ranking. COMET results were ranked by using both the ΔN and Z-score. Each program's results were filtered to 2% false-discovery rate, as measured by hits to decoy sequences.34 We compiled the training set from these filtered results by requiring that a spectrum be identified by at least three of the four programs. We observed that the overlap between any two programs was typically 70%. The final set consisted of 7677 spectra (5218 charge 2 and 2459 charge 3). The total number of distinct peptides was 2293 charge 2 and 1087 charge 3. This training set was used for all model building. There were two test set. The first was 6410 LTQ MS/MS spectra from S. cerevisiae whole cell lysate enriched for phosphopeptides by IMAC. Time trials for this test set were performed on a single processor of the Linux cluster (including a local installation of SEQUEST). The second was 423 000 LTQ MS/MS spectra from S. cerevisiae as described.25 All data sets, including spectra and annotations, are available from the authors upon request.
2.5. Sample Preparation
2.5.1. Cell Growth
For S. cerevisiae, 50 mL of budding yeast cells (BY4741) were grown in YPD medium to an OD600 of 0.5 and cells were treated with 0.05% MMS for 3 h. For S. pombe, 50 mL of fission yeast cells (FY259) were grown in YES medium to an OD600 of 0.5 and cells were treated with 0.01% MMS for 3 h.
2.5.2. Protein Extraction and Trypsin Digestion
Cells were broken in an ice-cooled bead-beater with 2 mL of lysis buffer containing 50 mM Tris-HCl, pH 8.0, 150 mM NaCl, 0.2% NP40, 0.5 mM DTT, 5 mM NaF, 10 mM β-glycerolphosphate, 1 mM sodium vanadate, 5 mM EDTA, 1 mM PMSF, 0.2 mM Benzamidine, 1 μM Leupeptin, and 1.5 μM Pepstatin. Cell debris was removed by centrifugation at 30 000g for 30 min. Approximately 10 mg of proteins was then denatured by boiling in the presence of 2% SDS and 10 mM DTT for 5 min. Proteins were alkylated with 50 mM iodoacetamide, precipitated with 3 vol of cold ethanol/acetone (1:1, v/v) and then resuspended with buffer containing 2 M urea and 50 mM Tris-HCl, pH 8.0. Twenty micrograms of trypsin (Worthington, Lakewood, NJ) was added for overnight digestion, and then the tryptic peptides were desalted using a 200-mg C18 column (Waters).
2.5.3. Phosphopeptide Purification and Mass Spectrometry
Desalted peptides were dried in Speed-Vac, resuspended in 150 μL of 1% acetic acid and loaded to a gel loading tip column containing 25 μL of immobilized metal affinity column (IMAC) resin. IMAC resin was prepared from silica Ni-NTA (Qiagen), where the nickel was substituted by iron as the bound metal. After loading of the peptides, the IMAC resin was washed twice with 25 μL of wash buffer containing 25% acetonitrile, 100 mM NaCl and 0.1% acetic acid. Bound phosphopeptides were successively eluted by four different eluting solutions containing increasing concentrations of phosphoric acid (0.01%, 0.05%, 0.1%, 1%) to yield four distinct eluted fractions. Each of the four elutions was performed with 100 μL of solution and processed independently. Each fraction was transferred to a silanized glass insert (National Scientific, Rockwood, TN), dried under reduced pressure, resuspended in 10 μL of 0.1% TFA and subjected to mass spectrometry analysis. Mass spectrometry experiments were performed using the 1100 QuadPump HPLC system (Agilent, Santa Clara, CA), the Ultimate 3000 autosampler (Dionex, Sunnyvale, CA), and the LTQ tandem mass spectrometer (Thermo Fischer Scientific, San Jose, CA). Four microliters of each eluted fraction was loaded using the autosampler via a 5 μL sample loop directly to an in-house packed 125 μm (inner diameter) × 20 cm microcapillary RP-HPLC column, packed with 3 μm C18 resin (Magic beads; Michrom Bioresources, Auburn, CA). For RP-HPLC-MS/MS analysis, buffer I consisted of 0.1% formic acid and 2% acetonitrile. Buffer II consisted of 0.1% formic acid and 80% acetonitrile. A 120 min gradient from 15% to 35% buffer II was used. Xcalibur 2.2 software (Thermo Fischer Scientific, San Jose, CA) was used for the data acquisition, and mass spectrometer was set to perform one full MS scan followed by 6 consecutive MS/MS scans according to the ion intensities detected in the full MS scan. The minimal threshold for the dependent scans was set to 6500 counts, and a dynamic exclusion list was used with the following settings: repeat count of 1, repeat duration of 2 s, exclusion list size of 150, exclusion duration of 60 s, and exclusion mass width of 0.2% relative to the reference mass. Raw data files were converted to mzXML with ReAdW 2006Nov01, http://tools.proteomecenter.org/ReAdW.php.
3. Results and Discussion
To generate the models, we first obtained a highly confident training set of 7677 phosphopeptide spectra. These spectra were identified by at least three independent algorithms (see Materials and Methods).
Correcting the observed parent mass is a crucial preprocessing step for any de novo MS/MS program.27 Inspect uses a partial de novo for tag generation and database filtering, and is therefore sensitive to erroneous parent mass values. As explained in Materials and Methods, we create a new model that explicitly uses neutral loss of phosphate. The trained models produce a significant improvement over the uncorrected and generic models (Table 3). For charge 3 spectra, the observed parent mass is only accurate (within 0.5 Da) 5% of the time. After parent mass correction, the accuracy is 90%. The new phosphorylation specific model has nearly twice as many spectra accurately predicted to 0.3 Da. We explored efficacy of using −98 as an offset for this model (Materials and Methods). However, the presence of amino acid masses close to 98 Da was confounding (i.e., 97 Da for proline and 99 Da for valine). Given the inaccuracy of the instrument, an offset of −98 Da could be a fragment neutral loss, or merely the next peak in the b/y ladder (compare the broad peak surrounding −98 with the narrow peak at −18 in Figure 1). Thus, when −98 was added to the feature set, the model gained no extra discriminatory power.
Table 3.
Performance of Parent Mass Correctiona
| accuracy | no correction | general model | phosphorylation specific model |
|---|---|---|---|
| Charge 2 | |||
| 0.1 Da | 4.3 | 10.8 | 22.1 |
| 0.3 Da | 15.6 | 47.8 | 76.4 |
| 0.5 Da | 29.6 | 83.6 | 93.8 |
| Charge 3 | |||
| 0.1 Da | 0.5 | 9.7 | 26.8 |
| 0.3 Da | 2.0 | 44.4 | 70.7 |
| 0.5 Da | 4.9 | 77.9 | 90.2 |
Data represent the percent of spectra that are correct to a given accuracy. The general model is the default Inspect model and was trained on unmodified peptides. The phosphorylation specific model was trained on phosphopeptides and includes phosphorylation-specific features, see Materials and Methods.
The scoring function of Inspect uses six spectrum features as input into an Support Vector Machine30 to get the final MQScore. As described in Materials and Methods, we use a Bayesian network to model the probability that each assigned peak is correct. Phosphopeptide fragmentation characteristics lead to a Bayesian network that is significantly different from the one for unmodified peptides. For example, our model clearly shows that b ions are twice as likely to be accompanied by a phosphate neutral loss than y ions (Table 2). Indeed, the probability of observing y − H3PO4 given a strong y ion is very similar to the probability of observing b − H3PO4 given an absent b ion.
After training, the new Inspect program was run on the test data set of 6410 MS/MS spectra and filtered to a 1% false-discovery rate. These results were compared to the results of SEQUEST and X!Tandem (Figure 5). We first note that Inspect is orders of magnitude faster than SEQUEST and X!Tandem. Inspect ran in 30 min on a desktop PC (1.6 GHz, 2 GB RAM). X!Tandem took 6 h and SEQUEST took 36 h. As for identifications, Inspect identified a total of 1089 phosphopeptide spectra. This is 13% more than SEQUEST and 39% more than X!Tandem at the same false-discovery rate. Moreover, Inspect also had the strongest overlap with other confidently identified spectra.
Figure 5.

Benchmarking Inspect's new scoring function on test data set 1. The test data set of 6410 MS/MS spectra was searched with the new Inspect models, SEQUEST and X!Tandem. Each program used as input the same mzXML spectrum file and the same database. Search parameters allowed up to 2 phosphorylations per peptide. Results of each program were filtered to 1% false-discovery by using the hits to the decoy database. (a) Overlap between annotations is plotted in a Venn diagram. Numbers represent individual spectra identified by an algorithm(s). (b) Run times are plotted for each program (single processor desktop PC).
When looking at the overlap in Figure 5, we see 15–20% of any program's annotations were unique. As it is possible that some of these could be false-positive identifications, we attempted to objectively compare the quality of these single program identifications. First, we plotted several features of phosphorylation spectra as discussed by Lu et al.18 For each feature, we compare the unique annotations to the 501 consensus spectra (Figure 6). The most distinguishing feature of a phosphopeptide is the fragment neutral loss, for example, b − H3PO4.18 As a labile modification, the phosphate is frequently lost during CID; thus, true phosphopeptide spectra will contain many fragment neutral loss peaks. Figure 6a plots a histogram of the fragment neutral loss count per spectrum. Each line in the graph represents the distribution of fragment neutral losses in the identified spectra. The blue line is the distribution of the 501 consensus spectra; green is for the 203 spectra uniquely identified by Inspect; red is for the 116 spectra uniquely identified by SEQUEST; and gray is for the 92 spectra uniquely identified by X!Tandem. Here, Inspect is the most similar to the consensus spectra, averaging more fragment neutral loss peaks per spectrum than SEQUEST or X!Tandem. A second highly characteristic feature of phosphopeptides is the intense M − p peak.18 This peak is typically the base peak of the spectrum and contains 20-30% of the total ion current. Figure 6b plots the intensity of this peak compared to be base peak of the spectrum. Here both Inspect and SEQUEST are very similar to the consensus spectra, each having a high percentage of spectra where the base peak is the M − p peak. Next, we look at a common spectral quality metric, the fraction of b and y ions observed (Figure 6c,d). Again, Inspect more closely resembles the distribution of the consensus spectra, having on average a higher percentage of b/y ions observed. Another common quality assurance check, the intensity of proline directed fragmentation, shows no difference between the program's annotations, Figure 7.
Figure 6.
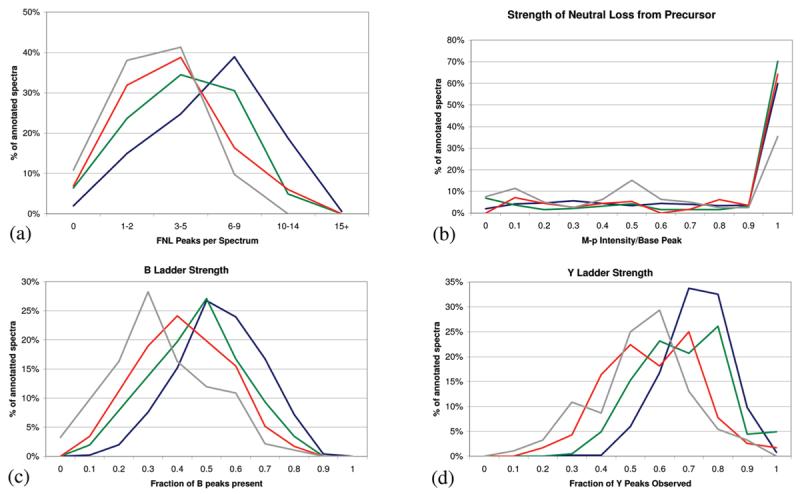
Phosphopeptide spectral qualities. For each plot, the spectral quality feature was tabulated for all spectra in the testing data set. The blue line represents spectra annotated by all programs (consensus spectra). The green line represents spectra uniquely annotated by Inspect, red for unique SEQUEST annotations, and gray for unique X!Tandem annotations. Each figure shows the overlaid histogram of the results. (a) Number of fragment neutral loss peaks per spectrum. (b) Intensity of the M − p peak compared to the base peak of the spectrum. (c) Strength of the b ion ladder. (d) Strength of the y ion ladder.
Figure 7.

Proline directed fragmentation. Here, we compare the intensity of peaks produced by breaks either nterminal or cterminal to proline. As in Figure 6, the blue line is consensus spectra; green line is unique Inspect identifications; red line is unique SEQUEST identifications; gray line is unique X!Tandem identifications. The plotted function is X = N/(N + C) where N and C represent the intensity of the N-terminal and C-terminal breaks, respectively. It is expected that N-terminal ions are much more intense than C-terminal ions, due to proline directed fragmentation. As seen, all programs have identical profiles, having a large majority of breaks where the N-terminal ion is an order of magnitude stronger than the C-terminal ion.
A close look of the false negatives of Inspect (the 74 spectra identified by SEQUEST and X!Tandem but not Inspect) shows the current deficiencies of the program. A total of 53 spectra were missed due to tagging errors. Of these, 39 are charge 3 spectra which are notoriously harder to tag. However, even though Inspect mistagged these spectra, it still identified nearly 20% more charge 3 spectra than SEQUEST (See Table 4), a true-positive gain more than covering the false-negative loss. In ongoing research, we plan to improve the tagging accuracy of higher charge peptides. Among the remaining false negatives, 10 represent spectra that Inspect identified but at a less significant p-value than 0.01. Another 9 of the false negatives are charge determination errors; remaining spectra score poorly in the phosphorylation-specific scoring function. When considering the 1165 spectra that Inspect identifies in total, losses for tagging (<5%) and charge correction (<1%) are minimal. Moreover, the number of false negatives for Inspect is smaller than either SEQUEST or X!Tandem. It is worth reiterating that as mass spectrometers become more accurate, charge detection and tag identifications will improve dramatically. This potentially enables longer tags, further improving the speed of search.
Table 4.
Comparison of Inspect and SEQUESTa
| Inspect | SEQUEST | |
|---|---|---|
| Total Spectra | 1089 | 962 |
| 2+ Spectra | 700 | 645 |
| 3+ Spectra | 389 | 317 |
| 2+ Peptides | 619 | 589 |
| 3+ Peptides | 333 | 287 |
| Run Time | 0.5 h | 36h |
The test data set of 6410 MS/MS spectra from S. cerevisiae was run permitting up to two phosphorylations per peptide. All results were filtered to 1% false positives and then compared between programs. Shown are only the spectra with a phosphorylated peptide annotation. The rows for peptides are counts of nonredundant phosphopeptide species.
After training and testing our models, we compared their performance against some of our previous work. A subset of the authors recently published a phosphoproteome analysis of DNA damage and repair pathways in S. cerevisiae.25 This study identified 2457 nonredundant phosphopeptides found in both wild-type and kinase-null cells, using the COMET software. The data set of 423 000 LTQ MS/MS spectra ran for ∼40 days on a 22 processor Linux cluster, a total of ∼21 000 CPU hours. We reran these spectra with Inspect and annotated 41 077 spectra (8118 distinct peptides) at a false-discovery rate of 1%. When we restricted the results to peptides found in both wild-type and kinase-null samples, we found 3518 nonredundant phosphopeptides, an increase of 43% from the original results. Additionally, the speed of Inspect was evident, running in less than 3 days on a single-processor desktop PC (66 CPU hours). A grid compiled version of Inspect finished the computation in 2 h.
4. Conclusions
Recent studies have shown the importance of post-translational modifications (phosphorylations in particular) in mediating cellular signals. While identification of phosphorylated peptides is key to these analyses, manual validation remains a standard of sorts in MS/MS phosphorylation studies. One reason for this standard is that a phosphopeptides's characteristic fragmentation pattern is easily picked out by eye. However, the other reason is simply that existing software are not trained to take advantage of the unique fragmentation patterns. We close this gap by training Inspect on a corpus of 7677 validated phosphopeptide spectra (3380 peptides).
In both training and multiple testing data sets, the new program discovers more phosphopeptides at a given false-discovery rate than any of the other programs considered. No program annotated all spectra; each algorithm has a measurable false-negative rate. Here, we show that the learned scoring function of Inspect out performs the other algorithms and has the lowest false-negative rate. Second, examination of the quality of the identifications using a variety of objective criteria show that the Inspect identifications are of uniform high quality. Moreover, the tag-based filtering approach of Inspect allows it to be somewhere between 10 and 100 times faster than X!Tandem, SEQUEST and COMET. Our methodology is quite general and will be applied to other important modifications and instrumentation as data becomes available. With an increase in the quality and throughput of mass spectrometry data, our methods will find broad applicability.
Acknowledgment
S.H.P. is supported by NSF IGERT training grant DGE0504645. V.B. acknowledges support from NIH grant R01-RR16522. M.B.S. and H.Z. acknowledge support from NIH grant GM080469-01 and the Ludwig Institute for Cancer Research. This research was supported in part by the UCSD FWGrid Project, NSF Research Infrastructure Grant Number EIA-0303622. The authors wish to thank Claudio Albuquerque, Ari Frank, and Nuno Bandeira for their many helpful conversations. The authors declare no financial conflict of interest.
References
- 1.Jensen ON. Interpreting the protein language using proteomics. Nat. Rev. Mol. Cell. Biol. 2006;7:391–403. doi: 10.1038/nrm1939. [DOI] [PubMed] [Google Scholar]
- 2.Hunter T. Signaling-2000 and beyond. Cell. 2000;100:113–127. doi: 10.1016/s0092-8674(00)81688-8. [DOI] [PubMed] [Google Scholar]
- 3.Zhou H, Watts JD, Aebersold R. A systematic approach to the analysis of protein phosphorylation. Nat. Biotechnol. 2001;19:375–378. doi: 10.1038/86777. [DOI] [PubMed] [Google Scholar]
- 4.Andersson L, Porath J. Isolation of phosphoproteins by immobilized metal (Fe3+) affinity chro- matography. Anal. Biochem. 1986;154:250–254. doi: 10.1016/0003-2697(86)90523-3. [DOI] [PubMed] [Google Scholar]
- 5.Pinkse MWH, Uitto PM, Hilhorst MJ, Ooms B, Heck AJR. Selective isolation at the femtomole level of phosphopeptides from proteolytic digests using 2D-NanoLC-ESI-MS/MS and titanium oxide precolumns. Anal. Chem. 2004;76:3935–3943. doi: 10.1021/ac0498617. [DOI] [PubMed] [Google Scholar]
- 6.Macek B, Mijakovic I, Olsen JV, Gnad F, Kumar C, Jensen PR, Mann M. The ser- ine/threonine/tyrosine phosphoproteome of the model bacterium Bacillus subtilis. Mol. Cell. Proteomics. 2007;6:697–707. doi: 10.1074/mcp.M600464-MCP200. [DOI] [PubMed] [Google Scholar]
- 7.Chi A, Huttenhower C, Geer LY, Coon JJ, Syka JEP, Bai DL, Shabanowitz J, Burke DJ, Troyanskaya OG, Hunt DF. Analysis of phosphorylation sites on proteins from Saccharomyces cerevisiae by electron transfer dissociation (ETD) mass spectrometry. Proc. Natl. Acad. Sci. U.S.A. 2007;104:2193–2198. doi: 10.1073/pnas.0607084104. [DOI] [PMC free article] [PubMed] [Google Scholar]
- 8.Olsen JV, Blagoev B, Gnad F, Macek B, Kumar C, Mortensen P, Mann M. Global, in vivo, and site-specific phosphorylation dynamics in signaling networks. Cell. 2006;127:635–648. doi: 10.1016/j.cell.2006.09.026. [DOI] [PubMed] [Google Scholar]
- 9.Villen J, Beausoleil SA, Gerber SA, Gygi SP. Large-scale phosphorylation analysis of mouse liver. Proc. Natl. Acad. Sci. U.S.A. 2007;104:1488–1493. doi: 10.1073/pnas.0609836104. [DOI] [PMC free article] [PubMed] [Google Scholar]
- 10.Molina H, Horn DM, Tang N, Mathivanan S, Pandey A. Global proteomic profiling of phospho- peptides using electron transfer dissociation tandem mass spectrometry. Proc. Natl. Acad. Sci. U.S.A. 2007;104:2199–2204. doi: 10.1073/pnas.0611217104. [DOI] [PMC free article] [PubMed] [Google Scholar]
- 11.Chitteti BR, Peng Z. Proteome and phosphoproteome dynamic change during cell dedifferentiation in Arabidopsis. Proteomics. 2007;7:1473–1500. doi: 10.1002/pmic.200600871. [DOI] [PubMed] [Google Scholar]
- 12.Shu H, Chen S, Bi Q, Mumby M, Brekken DL. Identification of phosphoproteins and their phosphorylation sites in the WEHI-231 B lymphoma cell line. Mol. Cell. Proteomics. 2004;3:279–286. doi: 10.1074/mcp.D300003-MCP200. [DOI] [PubMed] [Google Scholar]
- 13.Nousiainen M, Sillje HHW, Sauer G, Nigg EA, Korner R. Phosphoproteome analysis of the human mitotic spindle. Proc. Natl. Acad. Sci. U.S.A. 2006;103:5391–5396. doi: 10.1073/pnas.0507066103. [DOI] [PMC free article] [PubMed] [Google Scholar]
- 14.Trinidad JC, Specht CG, Thalhammer A, Schoepfer R, Burlingame AL. Comprehensive identification of phosphorylation sites in postsynaptic density preparations. Mol. Cell. Proteomics. 2006;5:914–922. doi: 10.1074/mcp.T500041-MCP200. [DOI] [PubMed] [Google Scholar]
- 15.Lee J, Xu Y, Chen Y, Sprung R, Kim SC, Xie S, Zhao Y. Mitochondrial phosphoproteome revealed by an improved IMAC method and MS/MS/MS. Mol. Cell. Proteomics. 2007;6:669–676. doi: 10.1074/mcp.M600218-MCP200. [DOI] [PMC free article] [PubMed] [Google Scholar]
- 16.DeGnore JP, Qin J. Fragmentation of phosphopeptides in an ion trap mass spectrometer. J. Am. Soc. Mass Spectrom. 1998;9:1175–1188. doi: 10.1016/S1044-0305(98)00088-9. [DOI] [PubMed] [Google Scholar]
- 17.Beausoleil SA, Villen J, Gerber SA, Rush J, Gygi SP. A probability-based approach for high- throughput protein phosphorylation analysis and site localization. Nat. Biotechnol. 2006;24:1285–1292. doi: 10.1038/nbt1240. [DOI] [PubMed] [Google Scholar]
- 18.Lu B, Ruse C, Xu T, Park SK, Yates J., 3rd Automatic validation of phosphopeptide identifications from tandem mass spectra. Anal. Chem. 2007;79:1301–1310. doi: 10.1021/ac061334v. [DOI] [PMC free article] [PubMed] [Google Scholar]
- 19.Loo JA, Edmonds CG, Smith RD., 2 Dissociation of multiply charged proline-containing proteins from electrospray ionization. Anal. Chem. 1993;65:425–438. doi: 10.1021/ac00052a020. [DOI] [PubMed] [Google Scholar]
- 20.Hunt DF, Yates JR, III, Shabanowitz J, Winston S, Hauer CR. Protein sequencing by tandem mass spectrometry. Proc. Natl. Acad. Sci. U.S.A. 1986;83:6233–6237. doi: 10.1073/pnas.83.17.6233. [DOI] [PMC free article] [PubMed] [Google Scholar]
- 21.Havilio M, Haddad Y, Smilansky Z. Intensity-based statistical scorer for tandem mass spectrometry. Anal. Chem. 2003;75:435–444. doi: 10.1021/ac0258913. [DOI] [PubMed] [Google Scholar]
- 22.Breci LA, Tabb DL, Yates JR, Wysocki VH. Anal. Chem. 2003;75:1963–71. doi: 10.1021/ac026359i. [DOI] [PubMed] [Google Scholar]
- 23.Jensen FV. Bayesian Networks and Decision Graphs. Springer; New York: 2001. [Google Scholar]
- 24.Tanner S, Shu H, Frank A, Wang L, Zandi E, Mumby M, Pevzner PA, Bafna V. InsPecT: iden- tification of posttranslationally modified peptides from tandem mass spectra. Anal. Chem. 2005;77:4626–4639. doi: 10.1021/ac050102d. [DOI] [PubMed] [Google Scholar]
- 25.Smolka MB, Albuquerque CP, Chen S, Zhou H. Proteomewide identification of in vivo targets of DNA damage checkpoint kinases. Proc. Natl. Acad. Sci. U.S.A. 2007;104:10364–10369. doi: 10.1073/pnas.0701622104. [DOI] [PMC free article] [PubMed] [Google Scholar]
- 26.Eng JK, McCormack AL, Yates JR. An approach to correlate tandem mass-spectral data of peptides with amino acid sequences in a protein database. J. Am. Soc. Mass Spectrom. 1994;5:976–989. doi: 10.1016/1044-0305(94)80016-2. [DOI] [PubMed] [Google Scholar]
- 27.Dancík V, Addona TA, Clauser KR, Vath JE, Pevzner PA. De novo peptide sequencing via tandem mass spectrometry. J. Comput. Biol. 1999;6:327–342. doi: 10.1089/106652799318300. [DOI] [PubMed] [Google Scholar]
- 28.Venable JD, Xu T, Cociorva D, Yates JR., III Cross-correlation algorithm for calculation of peptide molecular weight from tandem mass spectra. Anal. Chem. 2006;78:1921–1929. doi: 10.1021/ac051636h. [DOI] [PubMed] [Google Scholar]
- 29.Klammer AA, Wu CC, MacCoss MJ, Noble WS. Peptide charge state determination for low-resolution tandem mass spectra. Proc. IEEE Comput. Syst. Bioinform. Conf. 2005:175–185. doi: 10.1109/csb.2005.44. [DOI] [PubMed] [Google Scholar]
- 30.Noble WS. What is a support vector machine. Nat. Biotechnol. 2006;24:1565–1567. doi: 10.1038/nbt1206-1565. [DOI] [PubMed] [Google Scholar]
- 31.Frank A, Pevzner P. Anal. Chem. 2005;77:964–973. doi: 10.1021/ac048788h. [DOI] [PubMed] [Google Scholar]
- 32.Keller A, Eng J, Zhang N, Li X, Aebersold R. A uniform proteomics MS/MS analysis platform utilizing open XML file formats. Mol. Syst. Biol. 2005;1:2005–0017. doi: 10.1038/msb4100024. [DOI] [PMC free article] [PubMed] [Google Scholar]
- 33.Craig R, Beavis RC. TANDEM: matching proteins with tandem mass spectra. Bioinformatics. 2004;20:1466–1467. doi: 10.1093/bioinformatics/bth092. [DOI] [PubMed] [Google Scholar]
- 34.Elias JE, Haas W, Faherty BK, Gygi SP. Comparative evaluation of mass spectrometry platforms used in large-scale proteomics investigations. Nat. Methods. 2005;2:667–675. doi: 10.1038/nmeth785. [DOI] [PubMed] [Google Scholar]