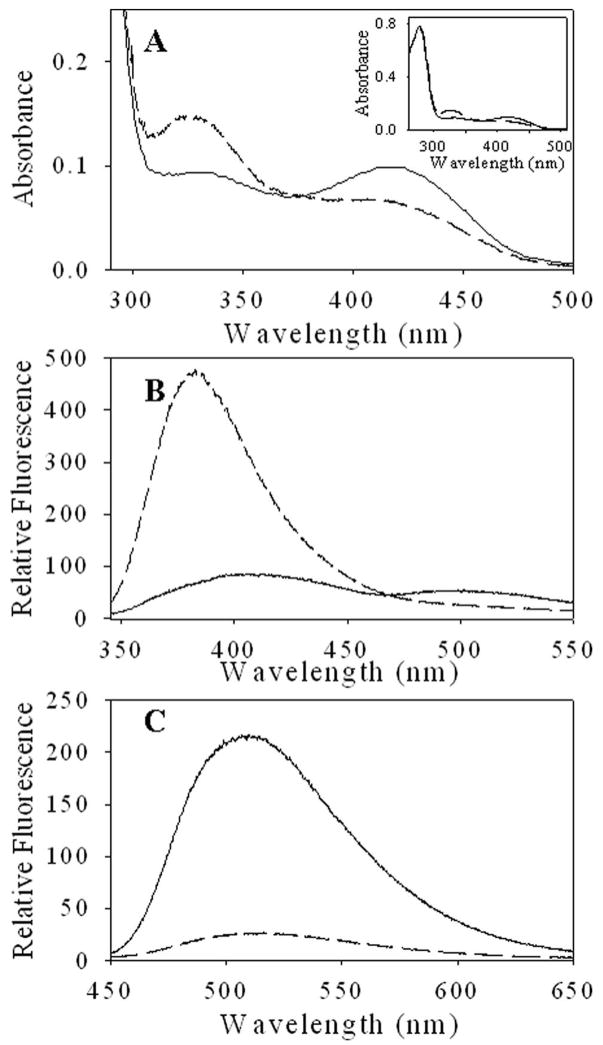
Figure 2.
Absorption and fluorescence spectra of ALAS and H282A variant. (A) UV-visible absorption spectra. The inset includes the region from 250–300 nm. Protein concentrations were adjusted to 13 μM in 20 mM Hepes, pH 7.5. (B) Fluorescence emission spectra of 5 μM ALAS and H282A in 20 mM Hepes, pH 7.5 containing 10% glycerol upon excitation at (B) 330 nm and (C) 420 nm. For (A)–(C), ALAS (--) and H282A (—).

