Abstract
We have determined the crystal structure of the Escherichia coli ThiS-ThiF protein complex at 2.0 Å resolution. ThiS and ThiF are bacterial proteins involved in the synthesis of the thiazole moiety of thiamin. ThiF catalyzes the adenylation of the carboxy terminus of ThiS and the subsequent displacement of AMP catalyzed by ThiI-persulfide to give a ThiS-ThiI acyl disulfide. Disulfide interchange, involving Cys184 on ThiF, then generates the ThiS-ThiF acyl disulfide, which functions as the sulfur donor for thiazole formation. ThiS is a small 7.2 kDa protein that structurally resembles ubiquitin and the molybdopterin biosynthetic protein MoaD. ThiF is a 27 kDa protein with distinct sequence and structural similarity to the ubiquitin activating enzyme E1 and the molybdopterin biosynthetic protein MoeB. The ThiF-ThiS structure clarifies the mechanism of the sulfur transfer chemistry involved in thiazole biosynthesis.
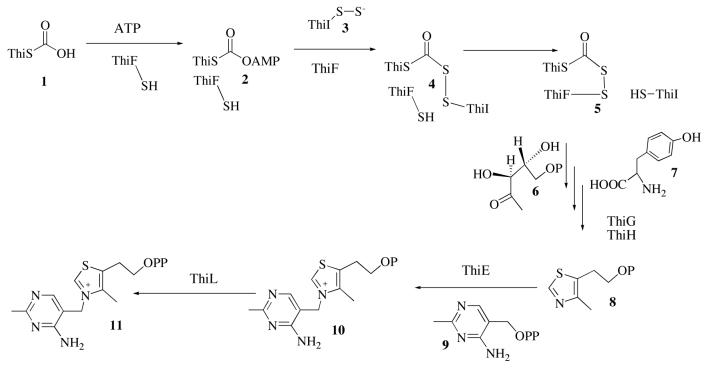
Thiamin pyrophosphate, (11, vitamin B1), is an important cofactor in all living systems. It is involved primarily in carbohydrate and branched chain amino acid metabolism, where it stabilizes acyl carbanion intermediates (1). Vitamin B1 is an essential nutrient in humans and the thiamin deficiency diseases beriberi and Wernike-Korsakoff syndrome have been extensively studied (2, 3). The thiamin biosynthetic pathway in Escherichia coli is outlined in Scheme 1 (4, 5).
Scheme 1.
The biosynthesis of the thiazole 8 is complex and involves six proteins (ThiS, ThiF, ThiG, ThiH, ThiI and IscS). IscS, an enzyme also involved in iron-sulfur cluster biosynthesis, catalyzes the transfer of the cysteine sulfur to ThiI to give ThiI-persulfide 3 (6, 7). ThiF catalyzes the adenylation of ThiS, at its carboxy terminus, to give 2 and the subsequent displacement of AMP by the ThiI-persulfide to give 4. Disulfide interchange, involving Cys184 on ThiF, generates the mixed acyldisulfide 5, which functions as the sulfur donor for thiazole formation (6, 8). Thiazole formation in E. coli has been reconstituted, at trace levels, but the mechanistic details are not yet well understood (9).
The corresponding thiazole biosynthesis in Bacillus subtilis (Scheme 2) involves five proteins (ThiS, ThiF, ThiG, ThiO, and IscS) and differs in the detailed mechanism of the redox and sulfur transfer chemistry from the E. coli pathway (10). In both prokaryotes and eukaryotes, the thiazole 8 displaces the pyrophosphate of the pyrimidine 9 to form thiamin phosphate and a final phosphorylation generates thiamin pyrophosphate 11, the biologically active form of the cofactor (11, 12).
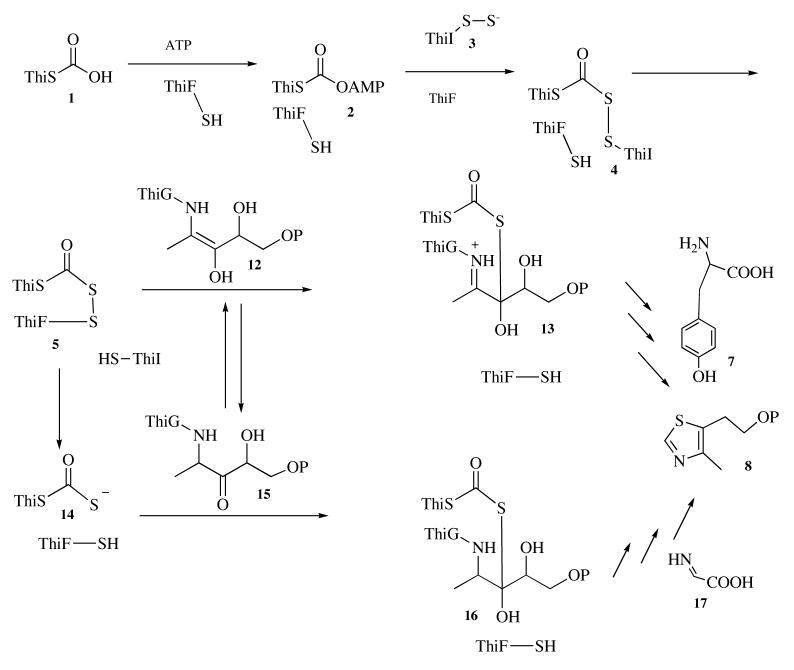
Scheme 2.
ThiS is a 7.2 kDa protein (66 amino acids) that is structurally similar to ubiquitin and MoaD (13). All three proteins are small (<100 amino acids) and have low sequence similarity except for a carboxy terminal Gly-Gly. ThiF is a 27 kDa protein (251 amino acids) with sequence and structural similarity to Ubl activating enzymes, and to the molybdopterin biosynthetic protein MoeB (14-17). The molybdopterin biosynthetic proteins MoeB-MoaD have similar functions to ThiF-ThiS. MoeB catalyzes the ATP-dependent formation of MoaD-thiocarboxylate, which functions as the sulfur source for molybdenum cofactor biosynthesis. The relationship between ThiF-ThiS and the ubiquitinating system is less direct and involves thioester rather than acyldisulfide formation. In this system, the ubiquitin-activating enzyme E1 catalyzes the formation of the acyl adenylate of ubiquitin, which then reacts with a cysteine on E1 to form a thioester. This thioester functions as the ubiquitin donor, ultimately tagging proteins for degradation in the proteasome (18, 19). While no prokaryotic genome has been found to encode the ubiquitinating enzymes, these similarities suggest that the ubiquitin/E1, ThiS/ThiF and MoaD/MoeB systems have evolved from a common ancestor.
The structural enzymology of the metabolism of thiazole 8 is now at an advanced stage and representative examples of all of the enzymes involved have been structurally characterized. These enzymes include thiaminase I (20) and thiaminase II (21), both of which catalyze the cleavage of the thiazole from thiamin, thiazole kinase (22), which catalyzes the phosphorylation of the thiazole alcohol, thiamin phosphate synthase (23), which catalyzes the attachment of the thiazole to the pyrimidine and ThiO (24), ThiF (25), ThiS (13) and ThiSG (26), which are all involved in thiazole assembly. Here we describe the crystal structure of the protein complex between ThiS and ThiF from E. coli at 2.0 Å resolution. This structure clarifies the mechanism of the sulfur transfer chemistry involved in thiazole biosynthesis.
MATERIALS AND METHODS
Protein production
Construction of the thiFS containing plasmid pCLK1405 was described previously (6). For protein production, the plasmid pCLK1405 was transformed into the E. coli overexpression strain BL834(DE3) (Novagen). A starter culture was prepared by inoculating a single colony into 5 mL LB media containing 100 μg/mL ampicillin and shaking over night at 200 rpm and 37 °C. The starter culture was inoculated into 1 L of LB media containing 100 μg/mL ampicillin. This culture was grown at 37 °C and 200 rpm to a cell density corresponding to an OD600 of ∼0.6 and induced with 300 μM isopropyl-β-D-thiogalactoside. After 3 h of induction, the cells were harvested and centrifuged at 4,000 g for 5 min. All subsequent purification steps were carried out at 4 °C. Cells were resuspended in 50 mL of 25 mM Tris-HCl, pH 8 (buffer A) and lysed using sonication. The lysate was centrifuged at 23,000 g for 30 min and ammonium sulfate was added to bring its concentration in the supernatant to 50 %. The resulting precipitate was isolated by centrifugation at 23,000 g, resuspended in buffer A, and dialyzed against the same buffer for 12 hours. Protein purification was performed on an AKTA explorer FPLC system (Amersham Biosciences). The dialyzate was applied on a 5 mL Hi-Trap QFF column (Amersham Biosciences), washed with buffer A for 30 min, and eluted with buffer A containing 250 mM NaCl. Fractions were analyzed by SDS-PAGE and pooled. Size exclusion chromatography was performed using a Superdex200, high load 26/60 column (Amersham Biosciences) at a flow rate of 1 mL/min using buffer A. Fractions were analyzed by SDS-PAGE, pooled, and concentrated to 20 mg/mL using an Amicon Ultra 15 concentrator (Millipore) with a 5 kDa molecular weight cutoff. Protein concentration was determined using the Bradford assay (27). The sample was aliquoted, frozen in liquid nitrogen and stored at −80 °C.
Crystallization of ThiS-ThiF
ThiS-ThiF was crystallized using the hanging drop method with each drop containing 1.2 μL of protein solution (8 mg/mL ThiF:ThiS in buffer A) and 1.2 μL of well solution (7% - 8% polyethyleneglycol 400, 35 mM calcium chloride and 100 mM Tris-HCl, pH 7.0–7.3). Crystals appeared sporadically within three days to two weeks and grew to a maximum size of 0.1 mm × 0.1 mm × 0.1 mm. Preliminary X-ray analysis showed that the crystals belong to the orthorhombic space group P212121 with unit cell dimensions of a = 49.51 Å, b = 111.17 Å and c = 114.15 Å. The Matthews coefficient, assuming two monomers of ThiF and two monomers of ThiS per asymmetric unit, is 2.3 Å3/Da. This corresponds to 47% solvent. For cryoprotection, the crystals were transferred into solutions containing an additional 25 % glycerol, frozen directly in the cryostream and stored under liquid nitrogen for later use.
X-ray data collection and processing
In house data were collected using a Rigaku RTP 300 RC copper rotating anode X-ray generator operating at 50 kV and 100 mA, equipped with a Rigaku RAXIS IV++ image plate detector. Integration and scaling of diffraction intensities were performed using the program CRYSTAL CLEAR (Rigaku/Molecular Structure Corporation). Two synchrotron data sets were collected. First, data were collected at the Cornell High Energy Synchrotron Source (CHESS) station F2 at a wavelength of 1.49 Å to a resolution of 2.4 Å. This wavelength was chosen to exploit the anomalous signal for heteroatom identification. Station F2 was equipped with a Quantum 210 X-ray detector (Area Detector Systems Corporation). Data were collected over 110° using 50 s for each 0.5° oscillation with a crystal to detector distance of 150 mm. The second dataset was collected, using the identical crystal, at the Northeastern Collaborative Access Team (NE-CAT) beamline 8-BM at the Advanced Photon Source (APS), at a wavelength of 0.98 Å to a resolution of 2.0 Å. Beamline 8-BM was equipped with an ADSC Quantum 315 X-ray detector. Data were collected over 158.5° using 30 s for each 0.5° oscillation with a crystal to detector distance of 310 mm. The data were integrated and scaled using the program HKL2000 (28). Data collection statistics are summarized in Table 1.
Table 1.
Data Collection Statistics
| Space Group: | P212121 | ||
| Cell dimensions (Å): | a = 49.51, b = 111.17, c = 114.15 | ||
| in house | CHESS (F2) | APS (8BM) | |
| Wavelength (Å): | 1.54 | 1.49 | 0.98 |
| Resolution (Å) | 16-2.5 | 49-2.4 | 27-2.0 |
| No. of reflections | 56,485 | 92,223 | 224,056 |
| No. of unique reflections | 19,428 | 24,000 | 42,395 c |
| Redundancy | 2.5 | 3.8 | 5.3 |
| Completeness (%) | 86.8 (87.9)a | 94.9 (68.4)a | 94.9 (93.6)a |
| Rsymb (%) | 7.2 (23.5)a | 9.1 (32.5)a | 8.9 (26.3)a |
| I/σ | 9.8 (3.9)a | 11.9 (2.9)a | 21.1 (4.0)a |
Values for the outer resolution shell are given in parentheses.
Rsym= Σhkl [(Σj | Ij − < I > |) / Σj | Ij | ], for equivalent reflections.
Includes 880 reflections with negative I, which were omitted from the refinement.
Structure determination
The structure was solved by molecular replacement using the program MOLREP (29). MoeB (chain A) from the MoeB-MoaD complex (15) (PDB code 1JW9) was used as a search model. Residues Ala190 through Ser202, which based on sequence alignments are not present in ThiF, were deleted from the model. In house data were used to a resolution of 3 Å. Two monomers of ThiF were found. The first gave a correlation coefficient of 0.204 and R-factor of 0.572, while the second gave a correlation coefficient of 0.300 and R-factor of 0.542. A σA weighted 2Fo-Fc map clearly showed density for two ThiS molecules. B. subtilis ThiS (PDB code 1TYG) was truncated at the C-terminus after residue Val63. Two of these ThiS models were manually fitted into this electron density using the MoeB-MoaD complex as a guide.
Model building and structure refinement
All model building was performed using the computer program O (30). E. coli ThiF side chains were inserted into the MoeB molecular replacement model and the E. coli ThiS side chains were inserted into the ThiS model, after which all side chains were manually adjusted. The structure was refined against data between 25 Å and 2.0 Å resolution using the program CNS (31). The refinement procedure involved rigid body refinement followed by successive rounds of simulated annealing, individual temperature factor refinement and model rebuilding. Early refinement was aided by the use of non-crystallographic symmetry restraints. Water molecules were added to the model in the final stages of the refinement if the Fo-Fc difference electron density peaks were ≥ 3σ. Anomalous and dispersive difference electron maps were calculated in CNS using the two synchrotron data sets. These maps were used to aid in the identification of metal ions. Structural analysis was carried out using the computer programs PROCHECK (32) for geometric analysis, MOLSCRIPT (33) and RASTER3D (34) for structure depiction, and DALI (35) for identification of structural homologs. The protein-protein interfaces were analyzed using SPOCK (36), and the protein interaction server (http://www.biochem.ucl.ac.uk/bsm/PP/server/index.html). The final refinement statistics are shown in Table 2.
Table 2.
Refinement Statistics
| Resolution (Å) | 25-2.0 | Wavelength (Å) 0.9795 | |
| Unique Reflections | 41,515 | Completeness (%) | 92.9 (87.3)a |
| Number of protein atoms | 4,700 | Number of H2O | 390 |
| Number of hetero atoms | 6 | ||
| Rcrystb (%) | 17.4 | Rfree (%)c | 22.9 |
| RMS deviation from ideal geometry: | |||
| Bond length (Å) | 0.017 | Angles (deg) | 1.8 |
| Ramachandran Plot: | |||
| Most favored region (%) | 90.5 | ||
| Additional allowed region (%) | 9.1 | ||
| Generously allowed region (%) | 0.4 | ||
| Disallowed region (%) | 0.0 | ||
| Avarege B-factors (Å2): | |||
| ThiF-Chain A | 30.1 | ThiS-Chain C | 29.0 |
| ThiF-Chain B | 50.5 | ThiS-Chain D | 36.9 |
| Waters | 43.1 | ||
The values in parentheses are for the highest resolution shell.
Rcryst = Σhkl | |Fo| − |Fc| | / Σhkl |Fo|, where Fo and Fc are the observed and calculated structure factors, respectively.
Rfree is computed from 2080 reflections that were randomly selected and omitted from the refinement.
RESULTS
The final model
The final crystallographic R-factor is 17.4% and the Rfree is 22.9% . The asymmetric unit contains one ThiF dimer (chains A and C) and two molecules of ThiS (chains B and D). The model also contains 390 water molecules, two zinc ions, two calcium ions and two sodium ions. Electron density was missing for Asp176 to Thr186 and the six C-terminal residues of chain A, Met1 of chain B, and Pro181 to Arg185 and the six C-terminal residues of chain C. These residues were omitted from the final model. Twenty-seven residues were refined with multiple conformations.
Description of the structure
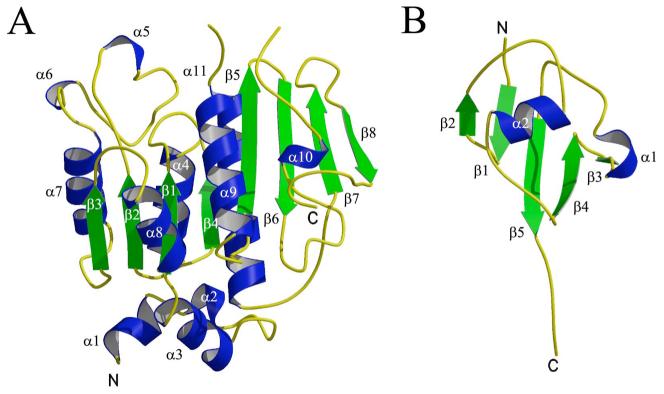
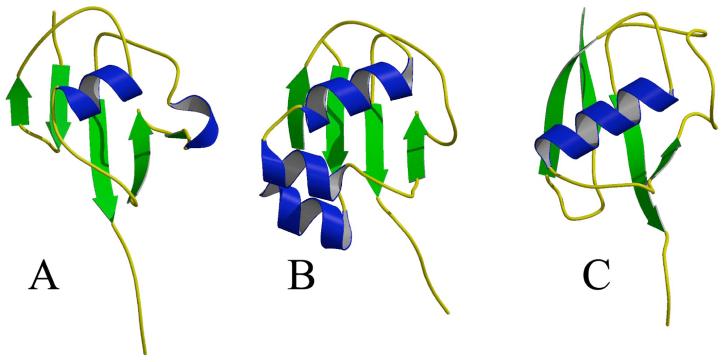
ThiF is an α/β protein consisting of an eight stranded mixed β-sheet with the topology β3↑β2↑β1↑β4↑β5↑β6↓β7↑β8↓, which is flanked by six α-helices and two 310-helices (5 and 6) on one side and three α-helices on the other side (Figure 1A). The root mean square deviation (RMSD) for the two monomers of ThiF in the asymmetric unit is 0.27 Å. Comparison of ThiF to known structures in the PDB using DALI revealed several structural relatives. MoeB (PDB code 1JW9) gave the best fit based on the DALI Z score, with an RMSD of 1.3 Å for 235 (240 total) aligned Cα positions. This is consistent with the high level of sequence identity (46%) between MoeB and ThiF. The second best fit corresponded to the small ubiquitin-related modifier (SUMO) activating enzyme Sae1 (PDB code 1Y8Q, chain A) from the Sae1-Sae2 complex structure (37), with an RMSD of 2.0 Å for 219 (313 total) aligned Cα positions. The third best fit corresponded to the APPBP1 monomer (PDB code 1NGV, chain A) from the NEDD8 activating enzyme APPBP1-UBA3 (38), with an RMSD of 1.8 Å for 218 (529 total) aligned Cα's (Figure 2). Eukaryotic ThiF homologs are generally larger then ThiF and contain additional domains. Furthermore, the sequence identity in the region of structural similarity is only about 20%. In contrast to homodimeric ThiF, Sae1-Sae2 and APPBP1-UBA3 are heterodimers that show structural similarity between the two monomers. As a result, the Sae1 partner, Sae2 (PDB code 1Y8Q, chain B) and the APPBP1 partner, UBA3, (PDB code 1NGV, chain B) are the next two structures in the DALI search, with RMSD's and sequence identity levels comparable to their partners.
Figure 1.
Overall folds of ThiF and ThiS. Helices are colored in blue, strands are colored in green. N- and C-termini are labeled N and C. α-helices and β-strands are labeled with Greek letters. (A) Ribbon diagram of ThiF. (B) Ribbon diagram of ThiS.
Figure 2.
Comparison of ThiF, MoeB and ubiquitin activating enzyme. The molecules are oriented based on the DALI alignments. Ribbon diagrams of (A) ThiF, (B) MoeB (PDB code 1JW9) (15), and (C) a Ubl activating enzyme (PDB code 1Y8Q) (37). The color scheme is the same as in Figure 1.
ThiF contains a Zn-sulfur center in which zinc is tetrahedrally coordinated by the sulfur atoms of cysteine residues Cys169, Cys172, Cys240, and Cys243. The presence of zinc is consistent with anomalous and dispersive difference maps calculated using the two synchrotron datasets (Table 1). Additional features in the difference electron density maps (calculated between the two synchrotron datasets) indicated radiation damage, especially for the carboxylate groups of Asp124 and Asp59 and the methylthio group of Met159. Interestingly, the radiation damage occurred in both ThiF chains at the same locations and to similar extents as judged by the peak heights in the difference map.
ThiS is an α/β protein adopting a ubiquitin-like fold. A five stranded mixed β-sheet with the topology β2↑β1↓β5↓β4↑β3↓ is flanked on one side by an α-helix and a 310-helix (Figure 1B). The RMSD for the Cα positions between the two ThiS molecules in the asymmetric unit is 0.9 Å. Difference dissected distance matrices (39) indicated that the C-terminus is the most rigid part of the molecule in this structure. Neglecting residues 1-28 and 41-52 from the calculation gives an RMSD of 0.25 Å. In addition, the temperature factors are lowest in the C-terminal region and highest for the 310-helix and the two loops containing residues 10 to 18 and residues 46 to 56. These two loops run in parallel and their structural differences are directionally correlated perpendicular to that direction.
Comparison to the ThiS solution structure (13) (PDB code 1F0Z) gives an RMSD of 2.1 Å. Neglecting residues 59 to 66, which are poorly defined in the NMR structure, yields an RMSD of 1.2 Å. Comparing E. coli ThiS to the ThiS from the B. subtilis ThiS-ThiG complex (26) (PDB code 1TYG), which show 22 % sequence identity, gives an RMSD of 1.8 Å for 64 of 66 Cα positions. The structure of MoaD (17) (PDB code 1FMA) superimposes with an RMSD of 2.4 Å for 59 of 81 aligned Cα positions. MoaD shows 24% sequence identity with ThiS. ThiS also has structural similarity to ubiquitin (40) (PDB code 1UBI). Superposition gives an RMSD of 2.6 Å for 60 of 79 aligned Cα positions (Figure 3). The sequence identity between ThiS and ubiquitin is 13%.
Figure 3.
Comparison of ThiS, MoaD and ubiquitin. The molecules are oriented based on the DALI alignments. Ribbon diagram of (A) ThiS (B) MoaD (PDB code 1JW9) (15) and (C) ubiquitin (PDB code 1UBI) (42). The color scheme is the same as in Figure 1.
Quaternary Structure
ThiS-ThiF is a heterotetramer consisting of a dimer of heterodimers. The heteroteramer displays twofold symmetry and has approximate dimensions of 55 Å × 55 Å × 65 Å (Figure 4). ThiF forms a central globular dimer, which is complexed with two ThiS molecules. There are no contacts between the two ThiS molecules resulting in a large cleft with a minimum ThiS-ThiS distance of 20 Å. Each ThiS binds a deep crevice of one ThiF with its C-terminus; ThiF chain A binds to ThiS chain B and ThiF chain C binds to ThiS chain D.
Figure 4.
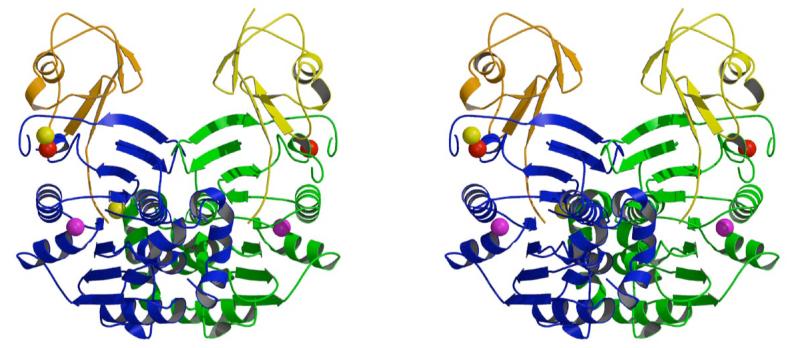
Stereoscopic ribbon diagram of the ThiS-ThiF complex. The view is perpendicular to the molecular twofold axis. The complex is labeled according to chain names. ThiS molecules are colored in yellow and orange and ThiF monomers are colored in green and blue. Zinc, calcium and sodium ions are depicted as spheres colored red, yellow and magenta, respectively.
The main interactions between the two ThiF molecules are hydrophobic, in which 68% of the atoms are non-polar. Surface atoms belong mainly to residues located on helices; namely α2, α4, 310 helix 5, α7, and α11. There are 14 hydrogen bonds involved in the ThiF-ThiF interface and 22 bridging waters can be found between chains A and C. The ThiF dimer interface buries 22% of the total accessible surface area of ThiF. The interface between ThiF and ThiS is also mostly hydrophobic with 60% of the atoms involved in the ThiS-ThiF interface being nonpolar. The ThiF surface utilizes the turn preceding α4, the stretch before α9, Arg70, the four strands β5 to β8, and α10 from the anti-parallel part of the central β-sheet to form the protein-protein interface, while the ThiS surface utilizes β3, β4, Asp7, Leu58, and the C-terminus from Phe60 to Gly66. There are 14 hydrogen bonds between ThiS and ThiF, 7 bridging waters, and a salt bridge between ThiS Asp7 and ThiF Arg230. The ThiS-ThiF interface buries 9% of the total accessible surface area of ThiF and 24% of the surface area for ThiS.
ThiF active site
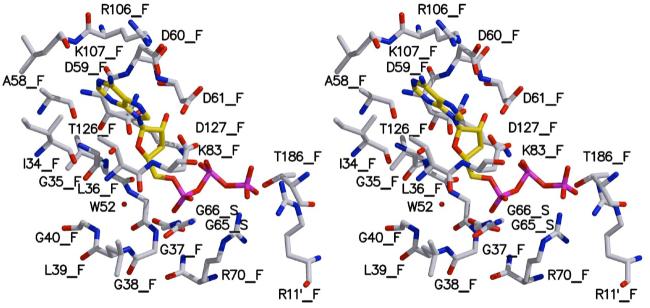
The structure of ThiF alone and with bound ATP was recently determined (25) and this allowed us to model the ThiF-ThiS-ATP complex (Figure 5). In this model, each ThiSF tetramer contains two active sites and each active site is composed of residues from both ThiF monomers. The ThiS C-terminus can be found at the bottom of the active site, and in close proximity to the ATP α-phosphate. The active site is lined with residues from five conserved sequence stretches. The residues beneath the adenosine base and the ribose are composed of a glycine rich nucleotide-binding motif reaching from residues Leu32 to Gly40. The nucleotide-binding loop can be found between β1 and α3 and it interacts with the ATP in the active site. Asp59 and Asp61 make up a conserved DXD motif located on the loop between β2 and the 310-helix 5, and are within hydrogen bonding distance of the ribose hydroxyl groups. The 310 helix 5 is highly conserved in all E1's and maintains several interactions with the ATP β- and γ-phosphate groups. This helix is believed to stabilize the outgoing pyrophosphate group after nucleophilic attack of the ThiS C-terminal carboxylate on ATP's α-phosphate. Asp127, located at the loop between β4 and α9, has been predicted to bind a Mg2+ ion (15), which would activate the α-phosphate for nucleophilic attack. An equivalent Mg2+ ion was observed in the structure of the Sae1-Sae2 complex (37). Arg132 on α9 is responsible for the positioning of the ThiS C-terminal Gly-Gly motif. Arg132 maintains a hydrogen bond to Ala64 of ThiS, thus leaving some flexibility in the C-terminus for attacking ATP. Arg11 from the other ThiF monomer in the dimer makes a salt bridge to the ATP α-phosphate. The disordered loop region between Pro181 and Arg185, called the ‘cross over’ loop, contains the highly conserved Cys184 involved in the formation of the ThiF-ThiS acyldisulfide 5. In the ThiF-ATP structure, the thiol group of this cysteine is nearly 20 Å from the α-phosphate of ATP suggesting that a large conformational change in this region of the protein is required for the formation of the acyldisulfide 5.
Figure 5.
Stereoscopic model of the ThiF-ThiS-ATP complex. Oxygen is colored red, nitrogen blue, carbon atoms of ATP are colored in gold, all other carbon grey, and phosphor magenta. Water 52 is shown as a red sphere. Residues from ThiS are labeled with _S those from ThiF with _F.
ThiF is a zinc containing protein. The structure demonstrates that the zinc ion is more then 20 Å from the active site and most likely has a structural rather than a catalytic role (25).
DISCUSSION
Comparison of the ThiF-ThiS complex to ThiF alone
The recently published structure of ThiF alone (25) superimposes with an RMSD of 0.69 Å to the ThiF of the ThiF-ThiS complex described here. The largest differences can be found between the C- and N-terminal residues as well as for the last ordered residues of the ‘cross over’ loop. The Cα-positions of Thr186 from the two structures differ by more then 5 Å. The predicted ThiS-ThiF model is consistent with this study with respect to the relative orientations of ThiS and ThiF. A closer examination of the ‘crossover’ loop revealed that the aromatic side chain of Trp174 adopts a different orientation in the complex in order to avoid a close contact to Gly31 from ThiS, while the side chain of ThiF Asp176 is oriented closer to ThiS in order to accept a hydrogen bond from the amide nitrogen of ThiS Gly31. These structural differences show that the ‘crossover’ loop adopts a different conformation in the complex compared to ThiF alone.
Comparison of ThiS-ThiF to ThiS-ThiG
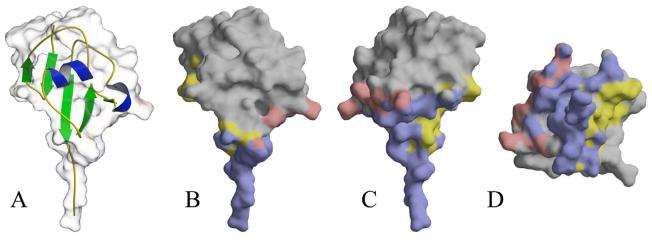
ThiS forms complexes with both ThiF and ThiG and the structures of the two complexes can be used to compare the two ThiS binding modes. Because the ThiS-ThiF structure is from E. coli and the ThiS-ThiG structure is from B. subtilis (26), a B. subtilis ThiS-ThiF structure was created by homology modeling to allow a more direct comparison. The ThiS-ThiG X-ray structure was superimposed onto the ThiS-ThiF homology model using the two ThiS molecules as the reference, and the binding surfaces were calculated. The surface areas utilized by ThiS to bind ThiF or ThiG are similar in size and overlap significantly, with roughly 70% of the ThiS binding surface common to both complexes. The hydrophobic contents of the two interfaces are roughly the same. Most of the hydrophobic interactions are contributed by the C-terminus of ThiS and hydrophobic residues surrounding the base of the C-terminal extension of ThiS. In both the ThiS-ThiG and ThiS-ThiF complexes, an arginine residue (Arg230 in ThiF and Arg183 in ThiG) takes roughly the same position relative to ThiS. In the ThiS-ThiF complex, the arginine forms a salt bridge with Asp7 of ThiS and in the ThiS-ThiG complex the arginine forms a salt bridge with Glu35 of ThiS.
The surface areas unique to either ThiF or ThiG lie on opposite sides of ThiS (Figure 6). In the region of ThiS utilized only by ThiG, a hydrophobic pocket formed by residues Leu4, Asn5, Lys7, Val9, and Tyr25 accepts Ile149 and Phe150 from ThiG. These residues are part of an extended β2 and α2 loop of the ThiG (βα)8 barrel. In the region of ThiS utilized only by ThiF, Glu44 of ThiS forms two hydrogen bonds with backbone amide groups of positions 2 and 3 of a reverse turn located just before the C-terminus of ThiF. In the homology model, aspartic acid (position 2) and alanine (position 3) occupy the corners of the turn, while in the X-ray structure of ThiF-ThiS these residues correspond to Ser238 and Gly239, respectively. In the X-ray structure the reverse turn is type I, while in the homology model the turn adopts a significantly different conformation. However, Glu44 is conserved between E. coli ThiS and B. subtilis ThiS, suggesting that this interaction may also be conserved.
Figure 6.
Surface representation of B. subtilis ThiS. (A) Ribbon diagram of ThiS. Helices are colored in blue, strands are colored in green. The ThiS surface is rendered transparent. (B) Buried surfaces of the ThiS-ThiF and ThiS-ThiG complexes. The buried surface that is common to both complexes is shown in blue, the surface unique to ThiS-ThiG is colored yellow, and the surface unique to ThiS-ThiF is colored red. (C) ThiS-ThiF rotated 180° about the vertical axis compared to panel A. (D) ThiS-ThiF rotated 90° about the horizontal axis compared to panel C.
In considering the homology model, it is important to note that B. subtilis ThiF, as well as ThiF from several related bacteria, contains an additional C-terminal domain of unknown structure and function. This roughly 90 amino acid domain has high sequence similarity within these bacterial systems. Interestingly, a homologous domain is also present in MoeB from B. subtilis, but not MoeB from E. coli. No significant sequence similarity has been detected between the extra C-terminal domains of ThiF or MoeB, and the C-terminal domains from related systems such as E1 or Ubl activating enzymes.
Mechanistic implications
Our current understanding of the mechanism of thiazole formation is outlined in Scheme 2. Two pathways have been identified in bacteria. In the first pathway, which is found in E. coli, ThiF catalyzes the adenylation of ThiS on its carboxy terminus. The resulting acyl adenylate 2 reacts with the persulfide of ThiI 3 to form 4. Disulfide interchange with the thiol of Cys184 of ThiF gives the ThiF-ThiS acyldisulfide 5, which has been detected as an intermediate (6). The subsequent steps involved in the conversion of 5 to the thiazole 8 are still poorly understood (9). One possibility for the next step in the reaction sequence is that enamine 12, formed between deoxy-D-xylulose-5-phosphate 6 and ThiG, reacts with 5 to form 13 (10).
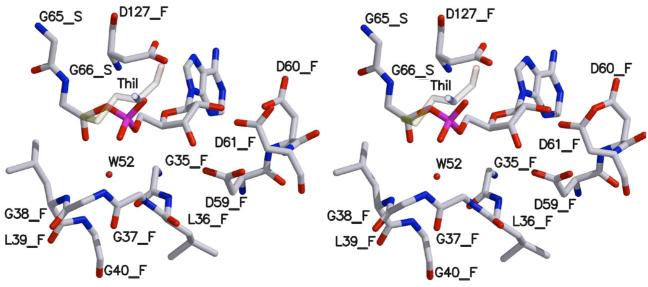
We have carried out modeling studies to determine if the reactions involved in the conversion of 1 to 13 are consistent with the structure of ThiF-ThiS. Using our ThiF-ThiS structure and the previously published ThiF-ATP structure, we generated a model for the acyl adenylate of ThiS complexed to ThiF 2 (Figure 7). This model suggests that for the conversion of 2 to 4, one of the phosphate oxygens of the acyl adenylate is positioned to deprotonate the persulfide 3 and the carbonyl group of the acyl adenylate is activated by hydrogen bonding to the amide hydrogens of Gly38 and Leu39 and a water molecule (Figure 8). We then modeled the formation of 4 by positioning a cysteine persulfide on the reaction trajectory for nucleophilic addition to the acyl adenylate of 2 (Figure 8). This reaction occurs on an open face of ThiF that should be accessible to the ThiI persulfide 3. The ThiF-ThiS acyl disulfide 5 was generated by replacement of the ThiI cysteine with Cys184 of ThiF. This cysteine is nearly 20 Å from the α-phosphate of ATP in the ThiF-ATP structure but is on a disordered loop in our ThiF-ThiS structure. However, if we model in the missing amino acids it is not unreasonable that Cys184 could carry out a disulfide interchange with the acyldisulfide in 4.
Figure 7.
Stereoscopic model of the ThiF-ThiS-COOAMP intermediate. Oxygen is colored red, nitrogen blue, carbon grey, phosphorous magenta, and sulfur yellow. The ThiI Cys-peroxide, labeled ThiI, is modeled in the approximate orientation for nucleophilic attack and shown as transparent. Water 52 is shown as a red sphere. Residues from ThiS are labeled with _S and those from ThiF with _F.
Figure 8.
Mechanism for activation of the acyl adenylate intermediate. The water molecule is also within hydrogen bonding distances of the amide groups of Gly37 and Gly40 and the carbonyl group of Cys125.
In the second pathway for thiazole formation, which is found in B. subtilis, ThiF also catalyzes the adenylation of ThiS on its carboxy terminus. The resulting acyl adenylate 2 reacts with the persulfide of IscS (not ThiI) to form an analog of 4. While we have been unable to detect a ThiF-ThiS acyl disulfide in this system, it is likely that 5 is formed because Cys184 is a conserved residue in ThiF for both pathways. This suggests that the acyl disulfide is rapidly reduced to the thiocarboxylate 14, which has been demonstrated to function as the sulfur source for thiazole formation in B. subtilis (10, 41).
All ThiF proteins associated with this second pathway have an additional carboxy terminal domain that contains a conserved cysteine (Cys261 for B. subtilis ThiF). This cysteine may cleave the acyldisulfide of 5 by a disulfide interchange. ThiS-thiocarboxylate 14 then adds to 15 to give 16, which undergoes a sequence of elimination/dehydration reactions followed by reaction with the glycine imine 17 to give the thiazole 8 (10, 26). The different redox chemistry of thiazole formation in E. coli and B. subtilis probably reflects the different oxygen requirements of the two microorganisms. E. coli can grow readily in the presence and absence of oxygen and therefore must be able to carry out the two-electron oxidation required for thiazole biosynthesis by an oxygen-independent pathway (i.e. thiol/disulfide chemistry). In contrast, B. subtilis grows very poorly in the absence of oxygen and during its normal aerobic growth uses oxygen directly to mediate the two-electron oxidation required for thiazole formation by oxidizing glycine to its imine 17, using a flavoenzyme (24).
AKNOWLEDGEMENTS
We thank Leslie Kinsland for assistance in the preparation of this manuscript, Cynthia Kinsland for discussions regarding the ThiS-ThiF overexpression system, the beamline staff at CHESS beamline F2, supported by NIH grant RR01646, and the staff at NE-CAT beamline 8BM, supported by NIH grant RR15301, at the APS for assistance during data collection.
† This work was supported by National Institutes of Health grants DK44083 (to TPB) and DK067081 (to SEE). SEE is indebted to the W. M. Keck Foundation and the Lucille P. Markey Charitable Trust.
ABBREVIATIONS
- Ub
ubiquitin
- Ubl
ubiquitin-like
- CHESS
Cornell High Energy Synchrotron Source
- APS
Advanced Photon Source
- RMSD
root mean square deviation
Footnotes
The Brookhaven Protein Data Bank code for the ThiS/ThiF complex is 1ZUD.
REFERENCES
- 1.Jordan F. Current mechanistic understanding of thiamin diphosphate-dependent enzymatic reactions. Natural Product Reports. 2003;20:184–201. doi: 10.1039/b111348h. [DOI] [PubMed] [Google Scholar]
- 2.Martin PR, Singleton CK, Hiller-Sturmhofel S. The role of thiamine deficiency in alcoholic brain disease. Alcohol Res. Health. 2003;27:134–42. [PMC free article] [PubMed] [Google Scholar]
- 3.Butterworth RF. Thiamin deficiency and brain disorders. Nutr. Res. Rev. 2003;16:277–283. doi: 10.1079/NRR200367. [DOI] [PubMed] [Google Scholar]
- 4.Settembre E, Begley TP, Ealick SE. Structural biology of enzymes of the thiamin biosynthesis pathway. Current Opinion in Structural Biology. 2003;13:739–747. doi: 10.1016/j.sbi.2003.10.006. [DOI] [PubMed] [Google Scholar]
- 5.Begley TP, Ealick SE. Mechanistic and structural studies on thiamine biosynthetic enzymes. Oxidative Stress and Disease. 2004;11:15–28. [Google Scholar]
- 6.Xi J, Ge Y, Kinsland C, McLafferty FW, Begley TP. Biosynthesis of the thiazole moiety of thiamin in Escherichia coli: identification of an acyldisulfide-linked protein--protein conjugate that is functionally analogous to the ubiquitin/E1 complex. Proc. Natl. Acad. Sci. USA. 2001;98:8513–8. doi: 10.1073/pnas.141226698. [DOI] [PMC free article] [PubMed] [Google Scholar]
- 7.Lauhon CT, Kambampati R. The iscS gene in Escherichia coli is required for the biosynthesis of 4-thiouridine, thiamin, and NAD. J. Biol. Chem. 2000;275:20096–103. doi: 10.1074/jbc.M002680200. [DOI] [PubMed] [Google Scholar]
- 8.Taylor SV, Kelleher NL, Kinsland C, Chiu HJ, Costello CA, Backstrom AD, McLafferty FW, Begley TP. Thiamin biosynthesis in Escherichia coli. Identification of this thiocarboxylate as the immediate sulfur donor in the thiazole formation. J. Biol. Chem. 1998;273:16555–60. doi: 10.1074/jbc.273.26.16555. [DOI] [PubMed] [Google Scholar]
- 9.Leonardi R, Fairhurst SA, Kriek M, Lowe DJ, Roach PL. Thiamine biosynthesis in Escherichia coli: isolation and initial characterization of the ThiGH complex. FEBS Letters. 2003;539:95–99. doi: 10.1016/s0014-5793(03)00204-7. [DOI] [PubMed] [Google Scholar]
- 10.Dorrestein PC, Zhai H, McLafferty FW, Begley TP. The biosynthesis of the thiazole phosphate moiety of thiamin: the sulfur transfer mediated by the sulfur carrier protein ThiS. Chem. Biol. 2004;11:1373–81. doi: 10.1016/j.chembiol.2004.08.009. [DOI] [PubMed] [Google Scholar]
- 11.Peapus DH, Chiu H-J, Campobasso N, Reddick JJ, Begley TP, Ealick SE. Structural characterization of the enzyme-substrate, enzyme-intermediate, and enzyme-product complexes of thiamin phosphate synthase. Biochemistry. 2001;40:10103–10114. doi: 10.1021/bi0104726. [DOI] [PubMed] [Google Scholar]
- 12.Webb E, Downs D. Characterization of thiL, encoding thiamin-monophosphate kinase, in Salmonella typhimurium. Journal of Biological Chemistry. 1997;272:15702–15707. doi: 10.1074/jbc.272.25.15702. [DOI] [PubMed] [Google Scholar]
- 13.Wang C, Xi J, Begley TP, Nicholson LK. Solution structure of ThiS and implications for the evolutionary roots of ubiquitin. Nat. Struct. Biol. 2001;8:47–51. doi: 10.1038/83041. [DOI] [PubMed] [Google Scholar]
- 14.Appleyard MV, Sloan J, Kana'n GJ, Heck IS, Kinghorn JR, Unkles SE. The Aspergillus nidulans cnxF gene and its involvement in molybdopterin biosynthesis. Molecular characterization and analysis of in vivo generated mutants. J. Biol. Chem. 1998;273:14869–76. doi: 10.1074/jbc.273.24.14869. [DOI] [PubMed] [Google Scholar]
- 15.Lake MW, Wuebbens MM, Rajagopalan KV, Schindelin H. Mechanism of ubiquitin activation revealed by the structure of a bacterial MoeB-MoaD complex. Nature. 2001;414:325–9. doi: 10.1038/35104586. [DOI] [PubMed] [Google Scholar]
- 16.Hochstrasser M. Evolution and function of ubiquitin-like protein-conjugation systems. Nat. Cell. Biol. 2000;2:E153–7. doi: 10.1038/35019643. [DOI] [PubMed] [Google Scholar]
- 17.Rudolph MJ, Wuebbens MM, Rajagopalan KV, Schindelin H. Crystal structure of molybdopterin synthase and its evolutionary relationship to ubiquitin activation. Nat. Struct. Biol. 2001;8:42–6. doi: 10.1038/83034. [DOI] [PubMed] [Google Scholar]
- 18.Pickart CM. Mechanisms underlying ubiquitination. Annu. Rev. Biochem. 2001;70:503–33. doi: 10.1146/annurev.biochem.70.1.503. [DOI] [PubMed] [Google Scholar]
- 19.Zheng N, Wang P, Jeffrey PD, Pavletich NP. Structure of a c-Cbl-UbcH7 complex: RING domain function in ubiquitin-protein ligases. Cell. 2000;102:533–9. doi: 10.1016/s0092-8674(00)00057-x. [DOI] [PubMed] [Google Scholar]
- 20.Campobasso N, Costello CA, Kinsland C, Begley TP, Ealick SE. Crystal structure of thiaminase-I from Bacillus thiaminolyticus at 2.0 A resolution. Biochemistry. 1998;37:15981–9. doi: 10.1021/bi981673l. [DOI] [PubMed] [Google Scholar]
- 21.Toms AV, Haas AL, Park JH, Begley TP, Ealick SE. Structural characterization of the regulatory proteins TenA and TenI from Bacillus subtilis and identification of TenA as a thiaminase II. Biochemistry. 2005;44:2319–29. doi: 10.1021/bi0478648. [DOI] [PubMed] [Google Scholar]
- 22.Campobasso N, Mathews II, Begley TP, Ealick SE. Crystal structure of 4-methyl-5-beta-hydroxyethylthiazole kinase from Bacillus subtilis at 1.5 A resolution. Biochemistry. 2000;39:7868–77. doi: 10.1021/bi0000061. [DOI] [PubMed] [Google Scholar]
- 23.Chiu HJ, Reddick JJ, Begley TP, Ealick SE. Crystal structure of thiamin phosphate synthase from Bacillus subtilis at 1.25 A resolution. Biochemistry. 1999;38:6460–70. doi: 10.1021/bi982903z. [DOI] [PubMed] [Google Scholar]
- 24.Settembre EC, Dorrestein PC, Park JH, Augustine AM, Begley TP, Ealick SE. Structural and mechanistic studies on ThiO, a glycine oxidase essential for thiamin biosynthesis in Bacillus subtilis. Biochemistry. 2003;42:2971–81. doi: 10.1021/bi026916v. [DOI] [PubMed] [Google Scholar]
- 25.Duda DM, Walden H, Sfondouris J, Schulman BA. Structural analysis of Escherichia coli ThiF. J Mol Biol. 2005;349:774–86. doi: 10.1016/j.jmb.2005.04.011. [DOI] [PubMed] [Google Scholar]
- 26.Settembre EC, Dorrestein PC, Zhai H, Chatterjee A, McLafferty FW, Begley TP, Ealick SE. Thiamin biosynthesis in Bacillus subtilis: structure of the thiazole synthase/sulfur carrier protein complex. Biochemistry. 2004;43:11647–57. doi: 10.1021/bi0488911. [DOI] [PubMed] [Google Scholar]
- 27.Bradford MM. A rapid and sensitive method for the quantitation of microgram quantities of protein utilizing the principle of protein-dye binding. Anal. Biochem. 1976;72:248–54. doi: 10.1016/0003-2697(76)90527-3. [DOI] [PubMed] [Google Scholar]
- 28.Otwinowski Z, Minor W. Processing of x-ray diffraction data collected in oscillation mode. Methods Enzymol. 1997;276:307–326. doi: 10.1016/S0076-6879(97)76066-X. [DOI] [PubMed] [Google Scholar]
- 29.Vagin A, Teplyakov A. An approach to multi-copy search in molecular replacement. Acta Crystallogr. D. 2000;56:1622–4. doi: 10.1107/s0907444900013780. [DOI] [PubMed] [Google Scholar]
- 30.Jones TA, Zou J-Y, Cowan SW, Kjeldgaard M. Improved methods for the building of protein models in electron density maps and the location of errors in these models. Acta Crystallogr. A. 1991;47:110–119. doi: 10.1107/s0108767390010224. [DOI] [PubMed] [Google Scholar]
- 31.Brünger AT, Adams PD, Clore GM, DeLano WL, Gros P, Grosse-Kunstleve RW, Jiang JS, Kuszewski J, Nilges M, Pannu NS, Read RJ, Rice LM, Simonson T, Warren GL. Crystallography & NMR system: A new software suite for macromolecular structure determination. Acta. Crystallogr. D. 1998;54:905–21. doi: 10.1107/s0907444998003254. [DOI] [PubMed] [Google Scholar]
- 32.Laskowski RA, MacArthur MW, Moss DS, Thornton JM. PROCHECK: a program to check the stereochemical quality of protein structures. J. Appl. Crystallogr. 1993;26:283–291. [Google Scholar]
- 33.Kraulis PJ. MOLSCRIPT: a program to produce both detailed and schematic plots of protein structure. J. Appl. Crystallogr. 1991;24:946–950. [Google Scholar]
- 34.Merritt EA, Bacon DJ. Raster3D Photorealistic Molecular Graphics. Methods Enzymol. 1997;277:505–524. doi: 10.1016/s0076-6879(97)77028-9. [DOI] [PubMed] [Google Scholar]
- 35.Holm L, Sander C. Protein structure comparison by alignment of distance matrices. J. Mol. Biol. 1993;233:123–38. doi: 10.1006/jmbi.1993.1489. [DOI] [PubMed] [Google Scholar]
- 36.Christopher JA. SPOCK. A&M University; Texas: 1998. [Google Scholar]
- 37.Lois LM, Lima CD. Structures of the SUMO E1 provide mechanistic insights into SUMO activation and E2 recruitment to E1. Embo J. 2005;24:439–51. doi: 10.1038/sj.emboj.7600552. [DOI] [PMC free article] [PubMed] [Google Scholar]
- 38.Walden H, Podgorski MS, Huang DT, Miller DW, Howard RJ, Minor DL, Jr., Holton JM, Schulman BA. The structure of the APPBP1-UBA3-NEDD8-ATP complex reveals the basis for selective ubiquitin-like protein activation by an E1. Mol. Cell. 2003;12:1427–37. doi: 10.1016/s1097-2765(03)00452-0. [DOI] [PubMed] [Google Scholar]
- 39.Richards FM, Kundrot CE. Identification of structural motifs from protein coordinate data: secondary structure and first-level supersecondary structure. Proteins. 1988;3:71–84. doi: 10.1002/prot.340030202. [DOI] [PubMed] [Google Scholar]
- 40.Ramage R, Green J, Muir TW, Ogunjobi OM, Love S, Shaw K. Synthetic, structural and biological studies of the ubiquitin system: the total chemical synthesis of ubiquitin. Biochem. J. 1994;299(Pt 1):151–8. doi: 10.1042/bj2990151. [DOI] [PMC free article] [PubMed] [Google Scholar]
- 41.Park J-H, Dorrestein PC, Zhai H, Kinsland C, McLafferty FW, Begley TP. Biosynthesis of the Thiazole Moiety of Thiamin Pyrophosphate (Vitamin B1) Biochemistry. 2003;42:12430–12438. doi: 10.1021/bi034902z. [DOI] [PubMed] [Google Scholar]
- 42.Vijay-Kumar S, Bugg CE, Wilkinson KD, Vierstra RD, Hatfield PM, Cook WJ. Comparison of the three-dimensional structures of human, yeast, and oat ubiquitin. J. Biol. Chem. 1987;262:6396–9. [PubMed] [Google Scholar]


