

Abstract
Miniaturizing bioassays to the nanoliter scale for high-throughput screening reduces the consumption of reagents that are expensive or difficult to handle. Utilizing acoustic dispensing technology, nanodroplets containing 10 µM ATP (3 µCi/µL 32P) and reaction buffer in 10% glycerol were positionally dispensed to the surface of glass slides to form 40 nL compartments (100 droplets/slide) for Pim1 (Proviral integration site 1) kinase reactions. The reactions were activated by dispensing 4 nL of various levels of a pyridocarbazolo-cyclopentadienyl ruthenium-complex Pim1 inhibitor, followed by dispensing 4 nL of a Pim1 kinase and peptide substrate solution to achieve final concentrations of 150 nM enzyme and 10 µM substrate. The microarray was incubated at 30°C (97% Rh) for 1.5 hr. The spots were then blotted to phosphocellulose membranes to capture phosphorylated substrate. Using phosphor imaging to quantify the washed membranes, the assay showed that, for doses of inhibitor from 0.75 µM to 3 µM, Pim1 was increasingly inhibited. Signal-to-background ratios were as high as 165 and average coefficients of variation (CVs) for the assay were ~20%. CVs for dispensing typical working buffers were under 5%. Thus, microarrays assembled by acoustic dispensing are promising as cost-effective tools that can be used in protein assay development.
Keywords: kinase, acoustic dispense, microarray, screening assay, radioactive phosphorus, phosphor storage imaging, phosphocellulose paper
INTRODUCTION
Selective, small molecule kinase inhibitors are sought as drug treatments for many serious diseases, including most cancers, diabetes, Alzheimer’s disease, and inflammation [1]. Well plate assays have been used extensively to study the interactions between kinases and their substrates. Several mix-and-read assays are available. For example, fluorescence polarization detects changes in the rotational diffusion of a fluorescent peptide substrate after the phosphorylation event causes binding with a detector antibody [2]. Proteolytic detection assays use quenched peptide substrates that are cleavable when phosphorylation is inhibited [3]. With bioluminescence methodologies, a luciferase solution is added to the wells after the kinase reaction is completed to detect the amount of residual ATP with luminescence proportional to the extent of inhibition [4]. Antibody-based assays are able to selectively bind phosphorylated tyrosine-containing peptides to the well surface for detection, and radioisotope-based assays track the transfer of a 32P or 33P-labeled γ-phosphate group from ATP to the kinase substrate [5– 6]. The advantage of these microliter-scale well plate approaches is that robotic liquid handling systems for assembling the assays are readily available, and plate readers for assay detection are well developed [7–9]. However, fluorescence assay methods may suffer from optical interference and high background from compounds, and luminescence assays are dependent on the concentration of ATP and no luciferase inhibition by the compounds. Further, antibody-based techniques require high quality antibodies that may not always be available (especially against phosphoserine). Finally, due to the volumes involved, radioisotope methods are costly and require special measures related to isolation, safety, and waste disposal [10].
Microarrays have been used extensively for many bioassay applications (including drug candidate screening, DNA fragment analysis, and protein profiling [11–16]), and can offer a large savings in reagent consumption when compared to well plates [17]. Because ATP is the universal substrate for kinases, using radiolabeled ATP as a detection agent in assays provides a great deal of flexibility, and the microarray format minimizes many of the disadvantages noted for radioisotopes with respect to well plates.
In the current study, we tested the assembly of protein microarrays on glass slides using an acoustic dispenser, as opposed to the traditional, contact-based pin microarrayer. Acoustic dispensing functions by using focused bursts of ultrasound generated by a transducer located underneath the well plate to eject nanoliter droplets of sample onto a target. Typically used for transfers between well plates, this no-contact mode of sample delivery can dispense variable volumes, is able to dispense accurately onto existing spots, and eliminates the need for time-consuming wash steps.
MATERIALS AND METHODS
Reagents, Equipment and Software, and Materials
Sources for reagents were
Millipore/Upstate, Lake Placid, NY, USA (Proviral integration site 1 (Pim1) kinase, S6 kinase/RSK2 substrate peptide 2 (KKRNRTLTK)); Perkin Elmer, Waltham, MA, USA (32P-radiolabeled gamma ATP); Invitrogen Corporation, Carlabad, CA, USA (7-Amino-4-methylcoumarin (AMC), Rhodamine 110 (R110), glycerol); Dr. Eric Meggers, Department of Chemistry, University of Pennsylvania, Philadelphia, PA, USA (a known pyridocarbazolo-cyclopentadienyl ruthenium-complex Pim1 inhibitor (Compound 10, hb1217) [18, 19, 21–22]); Calbiochem, San Diego, CA, USA (Cathepsin L protease); Penn Center for Molecular Discovery, University of Pennsylvania, Philadelphia, PA, USA (the thiocarbazate cathepsin L inhibitor, Substance Identifier (SID) 26681509 [23]); Fisher Scientific, Hampton, NH, USA (acetone); Sigma Aldrich, St. Louis, MO, USA (adenosine triphosphate (ATP), Z-fr-AMC (7-Amino-4-methylcoumarin, N-CBZ-L-phenylalanyl-Larginine amide, hydrochloride) substrate, fluorescein isothiocyanate (FITC), dimethyl sulfoxide (DMSO), sodium acetate (NaAc), magnesium chloride (MgCl2), ethylene diamine tetraacetic acid (EDTA), dithiothreitol (DTT), MOPS, 85% phosphoric acid, all subsequent reagents and buffers).
Sources for equipment and software were
EDC Biosystems, Malpitas, CA, USA (ATS-100 acoustic dispenser); GE Healthcare, Piscataway, NJ, USA (Typhoon 9410); Alpha Innotech, San Leandro, CA, USA (Alpha Arrayer); Perkin Elmer, Waltham, MA, USA (Envision plate reader); CSZ, Cincinnati, OH, USA (Micro Climate humidifying chamber); Boekel Scientific, PA, USA (Boekel Rocker II); Molecular Devices, Sunnyvale, CA, USA (Aquamax DW4); Imaging Research, Ontario, CA (Array Vision genomic software).
Sources for materials were
GE Healthcare, Piscataway, NJ, USA (phosphor storage cassettes); Thermo Fisher Scientific Inc., Waltham, MA, USA (Whatman P81 phosphocellulose ion exchange paper); Aurora Biosciences, San Diego, CA, USA (1536-well cyclo-olefin copolymer (COC) plate); Corning Incorporated Life Sciences, Lowell, MA, USA (black, nonbinding 1536-well plate); Erie Scientific, Portsmouth, NH, USA (polylysine-coated glass slides); Fisher Scientific, Hampton, NH, USA (3/8” to 1/2” thick plexiglass shielding); Chemplex Industries, Palm City, FL, USA (6 µm thick Mylar film).
Validation of Acoustic Dispensing Method
To demonstrate that acoustic dispensing does not inactivate enzymes and to show that it can generate results that are similar to standard methods (by liquid-handling robotics or by hand), we tested the technology by running cathepsin L reactions. Cathepsin L was chosen because it and its associated inhibitor, SID 26681509, were well-studied in our lab [23]. The assay was also amenable to a fluorescence format that could be analyzed relatively quickly and easily given that cathepsins cleave their substrate to release a fluorescent dye. Thus, it was straightforward to construct a dose-response, kinetic experiment using this enzyme and inhibitor combination in a well plate. A 1536-well source plate was prepared by pipetting in 5 µL of cathepsin L at 600 nM, 5 µL of the Z-fr-AMC substrate at 500 µM, and 5 µL of the inhibitor at varying concentrations. The target 1536-well plate was filled with 5 µL reaction buffer (20 mM NaAc, 1 mM EDTA, 5 mM DTT, pH 5.5) via an Aquamax dispense, and 10 nL of Z-fr-AMC substrate was acoustically dispensed into each well. Increasing concentrations of inhibitor were then introduced to each well by varying the volume dispensed (from 0 to 24 nL) such that the resulting final inhibitor concentrations ranged from 0 nM to 3 µM over a series of ten two-fold dilutions. The wells were allowed to mix by diffusion at room temperature for 15 min before the reactions were initiated by dispensing cathepsin L at 2.5 nL to achieve a final concentration of 0.3 nM in each well. The plate was then scanned for fluorescence every 4 min over a period of 4 hr to generate the kinetic data.
Spot-on-Spot Delivery
Next, the ability of the acoustic dispenser to assemble a multicomponent assay on a microarray format on the surface of a glass slide was tested by performing a spot-on-spot demonstration with three fluorogenic dyes: AMC in water, FITC in DMSO, and R110 in concentrated kinase reaction buffer (KRB, 100 mM MOPS, 150 mM MgCl2, pH 7). After 40 nL spots of a 10% glycerol/water solution were acoustically dispensed onto a polylysine-coated slide to form the target compartment, the AMC in water and FITC in DMSO solutions were each spotted sequentially at 2 nL each into every spot on the array. Visually from the camera it was observed that the dyes hit nearly every target compartment in the center and there was no cross contamination or cross-mixing between spots. The arrays were then scanned on a dual-filter slide reader, and both the AMC and FITC fluorescent signals picked up very clearly. The evaluation was repeated using 35 nL target compartments and rhodamine dye in reaction buffer.
Preparation of Reaction Solutions
The reaction buffer solution used to generate the 40 nL reaction volume compartments contained 9 µM ATP and 3 µCi/µL of 32P-labeled gamma ATP (approximately 9:1 cold to hot), 2x KRB (40 mM MOPS, 60 mM MgCl2, pH 7), and 10% glycerol by volume. The hb1217 inhibitor and Pim1 kinase with S6 kinase/RSK2 substrate peptide 2 solutions were prepared at a concentration that was 10x the desired final concentration in the spot (150 nM enzyme, 10 µM substrate, and up to 3 µM inhibitor) by diluting concentrated stock solutions with 1x KRB.
Pim1 Kinase Reaction Assembly on a Microarray
Following the validation that acoustic dispensing can handle protein and compound transfers, and that additional samples can be dispensed onto an existing microarray in a spot-on-spot manner, we tested the assembly of radiolabel-based kinase reactions through acoustic dispensing. A total of 3 to 5 µL per well of each reaction solution was pipetted into a 1536-well COC plate and centrifuged to eliminate air bubbles. A camera equipped on the dispensing tool allowed for careful observation of the microarray assembly in real-time. First, using ethanol-washed polylysine-coated glass slides as the target, 40 nL of the ATP and glycerol-containing reaction buffer solution was dispensed to form an adherent nanodroplet which served as the reaction volume compartment. Next, 4 nL of the aqueous hb1217 inhibitor solution was introduced to each spot of the microarray via a spot-on-spot delivery step. Finally, the reaction was activated by dispensing 4 nL of the enzyme and substrate solution (Fig. 1A), and the slides were incubated for 1.5 hr (most Pim1 activity is usually over after this length of time) at 30°C (97% Rh). The reactions were then stopped by transferring the microarray spots to phosphocellulose paper (only the substrate peptide binds strongly). The paper was then thoroughly washed four times (10 min each) in aqueous 0.75% phosphoric acid on a rocker to remove nonspecifically bound components from the paper; a wash in acetone (5 min) helped to enhance the drying process. The dried phosphocellulose paper was then placed in a storage phosphor cassette (covered with a protective Mylar film) for up to 4 hr to capture the signal from the β-particle emission of 32P from the bound substrate (Fig. 1B). Following this, the phosphor screen was scanned on a Typhoon 9410 and the resulting image was analyzed with Array Vision genomics software to quantify the signal strength and background levels.
Fig. 1. The acoustic dispensing process for reaction assembly.
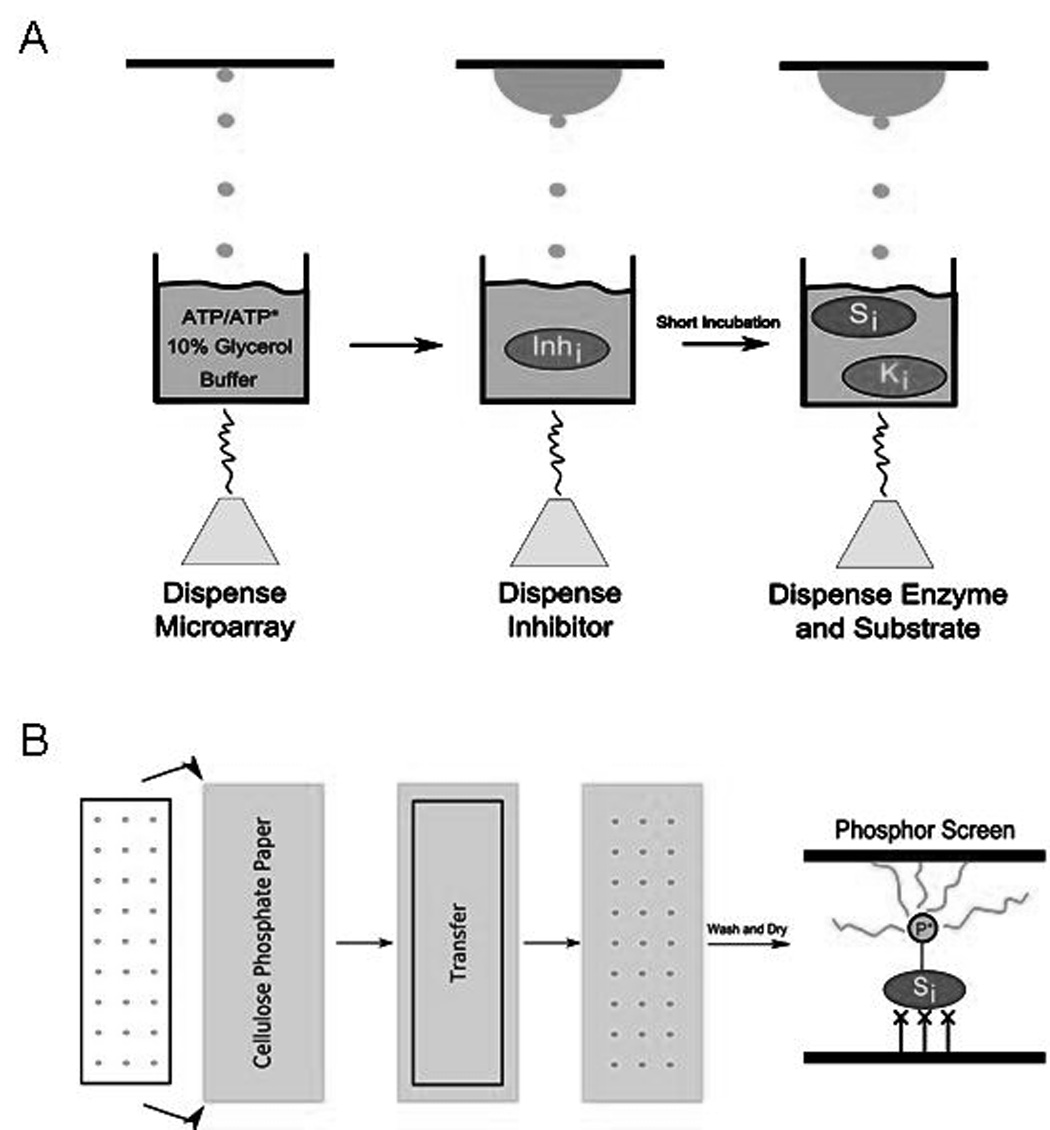
(A) Sample is placed into the well of a COC plate, and a transducer uses focused ultrasound to eject small droplets directly to the target. First ATP in a 10% glycerol/buffer solution is dispensed onto a glass slide to form the reaction volume compartment, and the inhibitor, and enzyme and substrate dispenses activate the reaction. (B) After the reaction is complete, the microarray is transferred over to phosphocellulose paper to bind phosphorylated substrate. Following several wash steps and drying, the paper is placed in a storage phosphor cassette to quantify the amount of signal present. Finally, the phosphor screen is scanned on a Typhoon to generate a digital image that is analyzed with Array Vision software.
The first assay, designed to test detection limits by including only the positive and negative controls and one 2 µM concentration of the hb1217 Pim1 inhibitor, was constructed by first dispensing the reaction volume compartment to the slide, followed by sequential spot-on-spot dispensing of the inhibitor and the enzyme-substrate solution. In a second assay, we performed a three point dose-response experiment using hb1217 at concentrations of 3 µM, 1.5 µM, and 0.75 µM (20x, 10x, 5x that of the [Pim1], respectively).
RESULTS
Validation of Acoustic Dispensing Method
The kinetic data from the cathepsin L validation experiment showed dose-response behavior with increasing concentrations of inhibitor in the well (Fig. 2A). There were no missed or incorrectly dosed wells, and CVs calculated for the assay at each dose were 3% to 8% (n = 44). The IC50 value of the inhibitor calculated from this assay was 36 nM, which was very close to and well within two-fold of the previously reported value of 56 nM [23] (Fig. 2B).
Fig. 2. Validation of acoustic dispensing for enzyme delivery without inactivation.
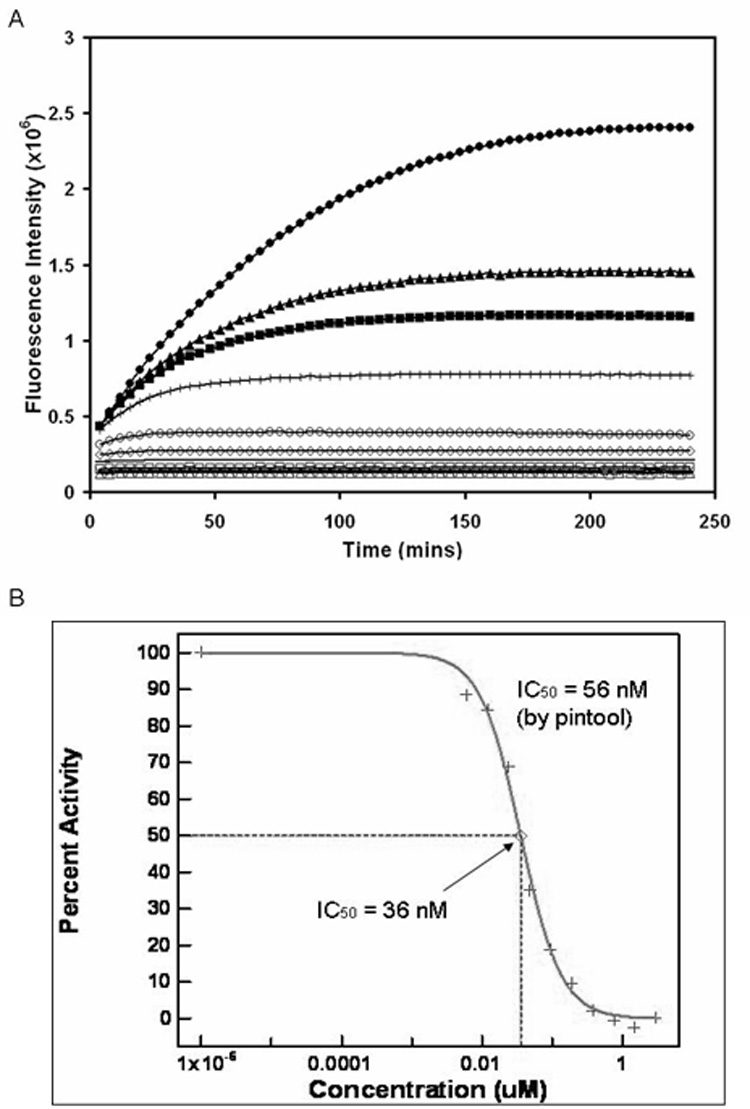
(A) A dose-response, kinetic experiment is shown for cathepsin L in a 1536-well plate assembled with acoustic dispensing. The reaction slows down significantly with increased concentration of a known inhibitor. Final assay conditions were 0.3 nM cathepsin L, 1 µM Z-fr-AMC substrate, and inhibitor at varying concentrations: 0 nM (●), 6 nM (▲), 12 nM (■), 24 nM (❘), 48 nM (○), 96 nM(◊), 192 nM (—), 384 nM (□), 768 nM (×), 1.5 µM (△), and 3 µM (◆). (B) IC50 calculation. The assay was within two-fold of a previously reported IC50 value. Standard errors were 3% to 8%.
Spot-on-Spot Delivery
The CVs for both the AMC and FITC dispenses were 5% (n = 336) (Fig. 3A and 3B). The dispensing of R110 resulted in a CV of 2.5% (n = 60) (Fig. 3C). There were no missed dispenses or cross-mixing between nanodroplets. Spot-on-spot delivery was thus validated as a reliable approach that can be achieved with acoustic dispensing.
Fig. 3. Images taken after spot-on-spot delivery of fluorescent dyes.
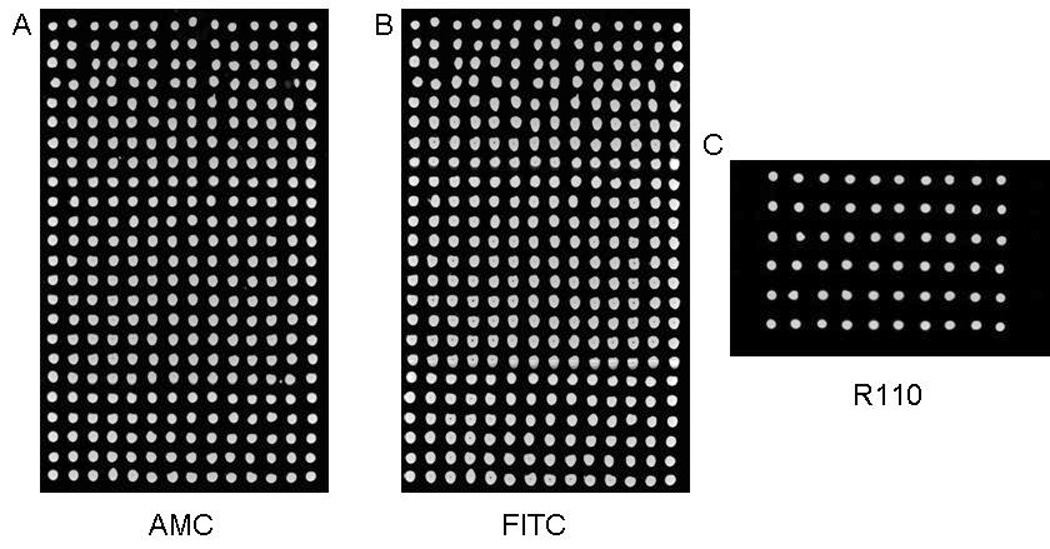
(A, B) Images from a dual-filter scan after AMC and FITC were sequentially dispensed into 40 nL spots of a blank microarray. There was a clear signal in each spot, there was no mixing between spots, and there were no missed dispenses. The CVs for the AMC and FITC dispenses were 4.5% and 5.1% (n = 336 each) respectively. Control spots (not shown) remained dark. (C) Image taken after R110 was dispensed into 35 nL spots. The CV was 2.5% (n = 60).
Pim1 Kinase Reactions on a Microarray
From the first assay it was shown that, with the presence of hb1217 at 2 µM ([Pim1] = 150 nM, [substrate] = 10 µM, [ATP] = 10 µM), the resulting signal-to-background ratio was reduced ten-fold to a value of just over 2 from a value of 24 when compared to the control which contained no inhibitor (Fig. 4A). In the second assay, for every two-fold increase in inhibitor concentration (Fig. 4B), there was an approximate two-fold decrease in signal intensity. Average CVs of the reactions within each group were ~20%, and the signal-to-background dynamic range was good, ranging from 1 to 165 between the positive and negative control samples.
Fig. 4. Phosphor image of Pim1 microarray reaction.
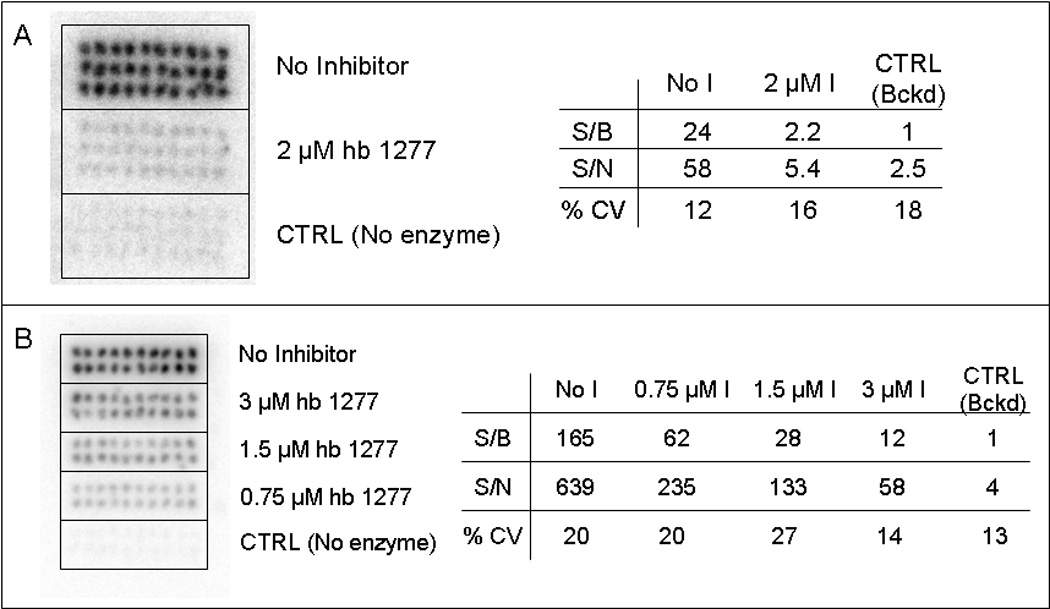
Each reaction was assembled (150 nM enzyme, 10 uM substrate, 10 uM ATP (9:1 ATP/ATP*)) with varying concentrations of a Pim1 inhibitor. (A) Reaction with inhibitor and positive/negative controls (n = 30 each). The spots with inhibitor resulted in a ten-fold decrease in signal compared to the positive control. (B) Dose-response experiment using three concentrations of inhibitor (n = 20). The signal decreased as the concentration of inhibitor increased.
DISCUSSION
Microarrays assembled by acoustic dispensing are promising as tools that can be used in protein assay development, and they prove to be quite cost-effective as well. Given the reaction conditions described in this paper for the kinase work, 10 µg of Pim1 can catalyze over 25,000 spots, and 1 mCi of 32P-labeled ATP can generate over 8,000 individual 40 nL reaction compartments. Using prices that are currently typical for each reagent ($340 per 10 µg kinase, $77 per mCi ATP*, and $150 per mg substrate), assembling 1000 kinase reactions on a single microscope slide would cost less than $0.03 per data point. In an extreme case for an extraordinarily expensive enzyme that may cost $3000 per µg to manufacture, the cost per reaction would be approximately $0.30 - a cost more typical of a standard well plate kinase reaction. Difficult to handle radioactive materials are much more manageable with regard to levels of consumption, isolation, and disposal as less than 15 µCi is needed to run a hundred reactions in this miniaturized format. The presence of glycerol in the kinase reaction buffer serves two purposes: it helps prevent evaporation of the spots, and it absorbs water into the spot when placed in a humidified environment (to ~5% final glycerol concentration) for the reaction to proceed [20].
The initial validation experiment with cathepsin L demonstrated that the enzyme remained catalytically active following acoustic dispensing, and the close proximity of the calculated IC50 from the experiment with the reported literature value is an indicator of maintained enzyme activity. That a kinase, which from our experience is much more susceptible to denaturation than proteases, was also acoustically dispensed while successfully maintaining enzymatic activity provides evidence that this technology can be applied even to proteins that are considered to be sensitive.
The CVs from the data analysis of the Pim1 kinase reactions were much greater than the CVs generated by acoustic dispensing alone. Calibration data generated by dispensing known concentrations of fluorescent dyes into known volumes of solvent in a target plate show that typical CVs for acoustic dispensing is 4% for our working solutions and buffers (Fig. 5), and it was already shown in the spot-on-spot demonstration that CVs were generally below 5% on the microarray. Thus, the cause behind the higher CVs from the Pim1 experiments was likely due to the variability found in the blotting efficiency of each nanodroplet to the phosphocellulose paper. When the microarray is transferred to the paper for phosphorylated substrate capture, a small fraction of the spot will remain on the surface of the glass slide. However, with the high dynamic ranges achievable with our described method, CVs of ~20% will still typically yield acceptable Z-factors of 0.4 or higher [24]; a strongly inhibited reaction will stand out appreciably when compared to the uninhibited control. For methods that do not require transferring spots off of the surface of the slide, such as fluorescence-based assays, the CVs are expected to remain quite low.
Fig. 5. CVs for different solutions acoustically dispensed.
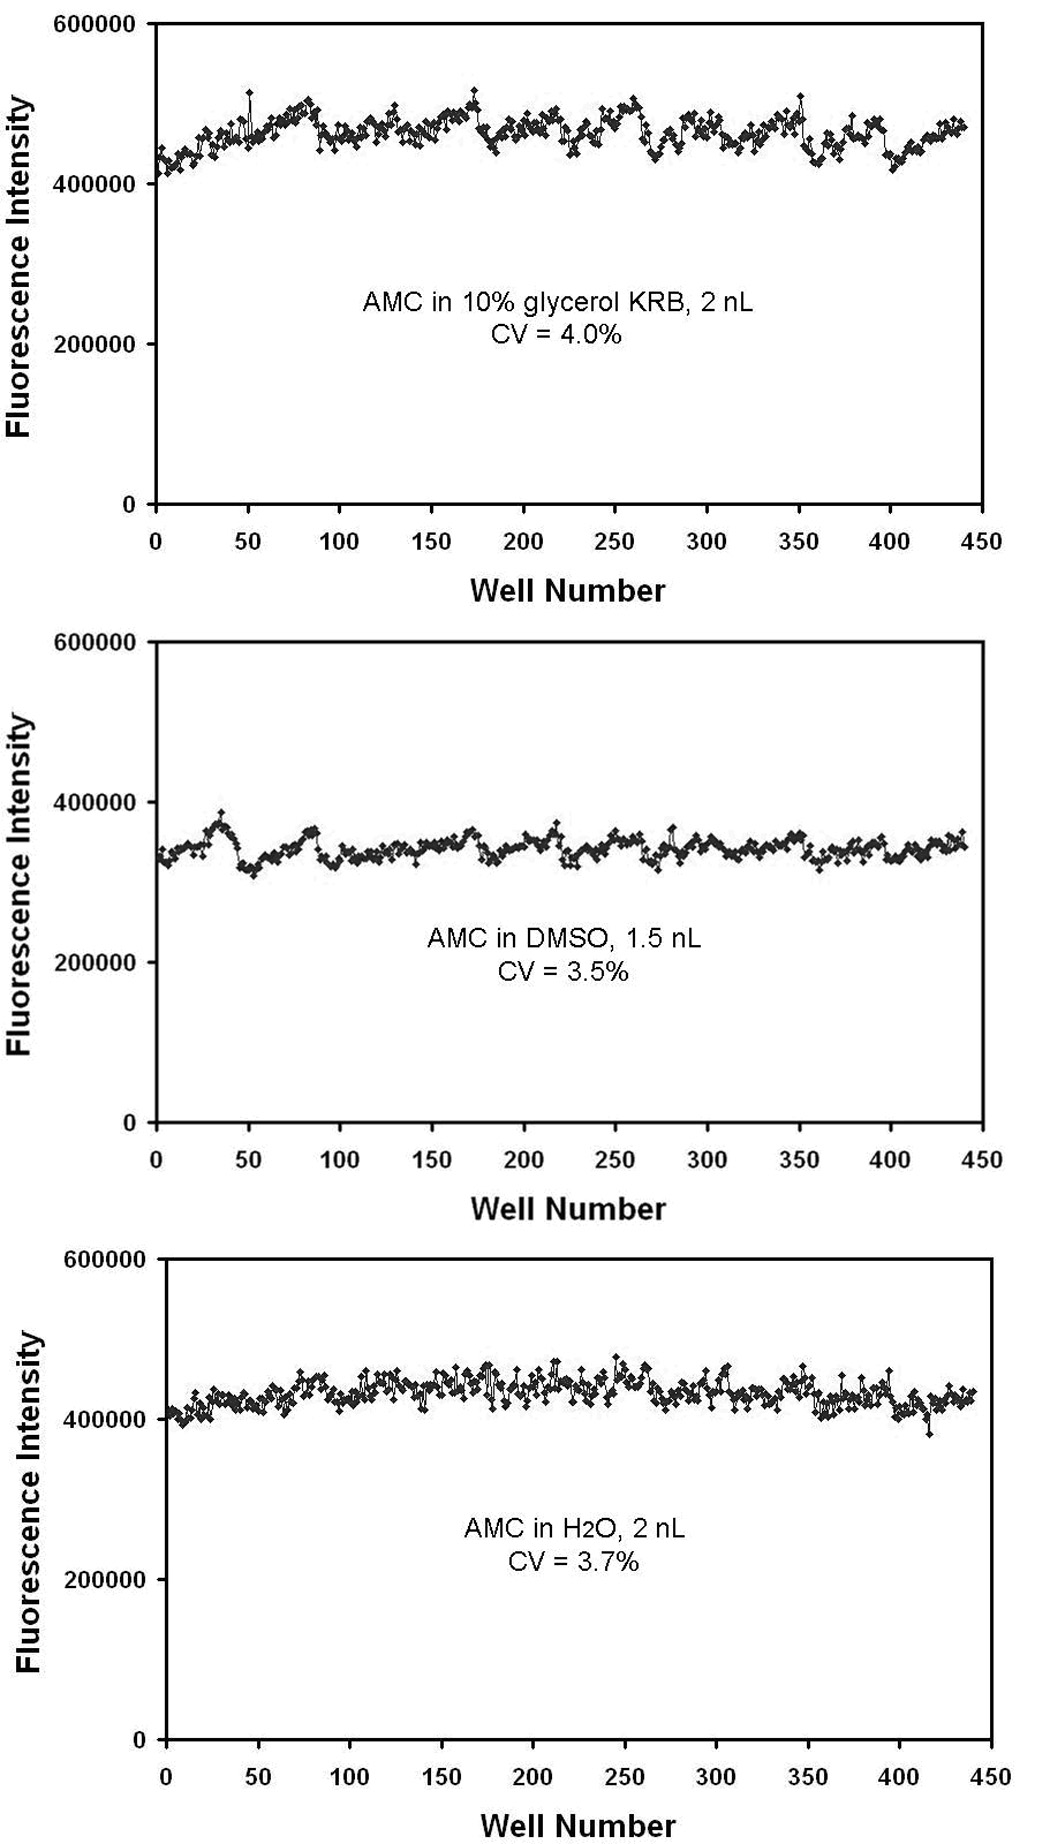
A 1536-well plate was divided into sections and all three calibrations were performed on the same plate. Each sample contained a known concentration of AMC (n = 440) and was shown to be dispensed with very low CVs.
In the analysis step, it should be noted that with phosphor imaging, the longer the exposure time, the higher the signal will become; however, longer exposures also results in an increase in background noise. Thus, the storage period should be optimized to produce acceptable signal-to-background signals for the concentration of radiolabel used in the experiment.
CONCLUSION
We have described how acoustic dispensing technology can be applied to the miniaturization of enzyme bioassays with the benefits of reduced costs and reagent consumption. In particular, the technology provides effective spot-on-spot re-addressing of microarray positions to allow for the subsequent fluidic additions of reagents necessary to assemble multicomponent reactions for the purpose of measuring kinase inhibition. We anticipate that acoustic dispensing for drop-on-drop assembly of multicomponent reactions will have utility for numerous applications beyond enzyme assays, including combinatorial assembly of reactions for surface patterning or multiplexed diagnostic reactions.
ACKNOWLEDGEMENTS
We thank Dr. Eric Meggers for providing the Pim1 inhibitor and Parag P. Shah for providing samples for the cathepsin L experiment. This work was supported in part by NIH U54-HG3915.
Footnotes
Publisher's Disclaimer: This is a PDF file of an unedited manuscript that has been accepted for publication. As a service to our customers we are providing this early version of the manuscript. The manuscript will undergo copyediting, typesetting, and review of the resulting proof before it is published in its final citable form. Please note that during the production process errors may be discovered which could affect the content, and all legal disclaimers that apply to the journal pertain.
REFERENCES
- 1.Vieth M, et al. Kinomics: characterizing the therapeutically validated kinase space. Drug Discov Today. 2005;10(12):839–846. doi: 10.1016/S1359-6446(05)03477-X. [DOI] [PubMed] [Google Scholar]
- 2.Beasley JR, et al. Miniaturized, ultra-high throughput screening of tyrosine kinases using homogeneous, competitive fluorescence immunoassays. Assay Drug Dev Technol. 2004;2(2):141–151. doi: 10.1089/154065804323056486. [DOI] [PubMed] [Google Scholar]
- 3.Kupcho K, et al. A homogeneous, nonradioactive high-throughput fluorogenic protein kinase assay. Anal Biochem. 2003;317(2):210–217. doi: 10.1016/s0003-2697(03)00094-0. [DOI] [PubMed] [Google Scholar]
- 4.Tagliati F, et al. Utilization of luminescent technology to develop a kinase assay: Cdk4 as a model system. J Pharm Biomed Anal. 2005;39(3–4):811–814. doi: 10.1016/j.jpba.2005.05.003. [DOI] [PubMed] [Google Scholar]
- 5.Lesaicherre ML, et al. Antibody-based fluorescence detection of kinase activity on a peptide array. Bioorg Med Chem Lett. 2002;12(16):2085–2088. doi: 10.1016/s0960-894x(02)00378-5. [DOI] [PubMed] [Google Scholar]
- 6.Asensio CJ, Garcia RC. Determination of a large number of kinase activities using peptide substrates, P81 phosphocellulose paper arrays and phosphor imaging. Anal Biochem. 2003;319(1):21–33. doi: 10.1016/s0003-2697(03)00282-3. [DOI] [PubMed] [Google Scholar]
- 7.Hodder P, et al. Miniaturization of intracellular calcium functional assays to 1536-well plate format using a fluorometric imaging plate reader. J Biomol Screen. 2004;9(5):417–426. doi: 10.1177/1087057104264038. [DOI] [PubMed] [Google Scholar]
- 8.Lavery P, Brown MJ, Pope AJ. Simple absorbance-based assays for ultra-high throughput screening. J Biomol Screen. 2001;6(1):3–9. doi: 10.1177/108705710100600102. [DOI] [PubMed] [Google Scholar]
- 9.Wolcke J, Ullmann D. Miniaturized HTS technologies - uHTS. Drug Discov Today. 2001;6(12):637–646. doi: 10.1016/s1359-6446(01)01807-4. [DOI] [PubMed] [Google Scholar]
- 10.Horiuchi KY, et al. Microarrays for the functional analysis of the chemical-kinase interactome. J Biomol Screen. 2006;11(1):48–56. doi: 10.1177/1087057105282097. [DOI] [PubMed] [Google Scholar]
- 11.MacBeath G. Protein microarrays and proteomics. Nat Genet. 2002;(32 Suppl):526–532. doi: 10.1038/ng1037. [DOI] [PubMed] [Google Scholar]
- 12.MacBeath G, Schreiber SL. Printing proteins as microarrays for high-throughput function determination. Science. 2000;289(5485):1760–1763. doi: 10.1126/science.289.5485.1760. [DOI] [PubMed] [Google Scholar]
- 13.Gosalia DN, et al. Profiling serine protease substrate specificity with solution phase fluorogenic peptide microarrays. Proteomics. 2005;5(5):1292–1298. doi: 10.1002/pmic.200401011. [DOI] [PubMed] [Google Scholar]
- 14.Horiuchi KY, et al. Microarrays for the functional analysis of the chemical-kinase interactome. J Biomol Screen. 2006;11(1):48–56. doi: 10.1177/1087057105282097. [DOI] [PubMed] [Google Scholar]
- 15.Pease AC, et al. Light-generated oligonucleotide arrays for rapid DNA sequence analysis. Proc Natl Acad Sci U S A. 1994;91(11):5022–5026. doi: 10.1073/pnas.91.11.5022. [DOI] [PMC free article] [PubMed] [Google Scholar]
- 16.Situma C, Hashimoto M, Soper SA. Merging microfluidics with microarray-based bioassays. Biomol Eng. 2006;23(5):213–231. doi: 10.1016/j.bioeng.2006.03.002. [DOI] [PubMed] [Google Scholar]
- 17.Gosalia DN, Diamond SL. Printing chemical libraries on microarrays for fluid phase nanoliter reactions. Proc Natl Acad Sci U S A. 2003;100(15):8721–8726. doi: 10.1073/pnas.1530261100. [DOI] [PMC free article] [PubMed] [Google Scholar]
- 18.Bachmann M, Moroy T. The serine/threonine kinase Pim1. Int J Biochem Cell Biol. 2005;37(4):726–730. doi: 10.1016/j.biocel.2004.11.005. [DOI] [PubMed] [Google Scholar]
- 19.Bregman H, Carroll PJ, Meggers E. Rapid access to unexplored chemical space by ligand scanning around a ruthenium center: discovery of potent and selective protein kinase inhibitors. J Am Chem Soc. 2006;128(3):877–884. doi: 10.1021/ja055523r. [DOI] [PubMed] [Google Scholar]
- 20.Segur JB. Physical Properties of Glycerol and its Solutions. New York Glycerine Producers’ Association; 1963. p. 269. [Google Scholar]
- 21.Zhang L, Carroll P, Meggers E. Ruthenium complexes as protein kinase inhibitors. Org Lett. 2004;6(4):521–523. doi: 10.1021/ol036283s. [DOI] [PubMed] [Google Scholar]
- 22.Bregman H, E Meggers. Ruthenium half-sandwich complexes as protein kinase inhibitors: an N-succinimidyl ester for rapid derivatizations of the cyclopentadienyl moiety. Org Lett. 2006;8(24):5465–5468. doi: 10.1021/ol0620646. [DOI] [PubMed] [Google Scholar]
- 23.Myers MC, et al. Identification and synthesis of a unique thiocarbazate cathepsin L inhibitor. Bioorg Med Chem Lett. 2008;18(1):210–214. doi: 10.1016/j.bmcl.2007.10.107. [DOI] [PMC free article] [PubMed] [Google Scholar]
- 24.Zhang JH, Chung TD, et al. A Simple Statistical Parameter for Use in Evaluation and Validation of High Throughput Screening Assays. J Biomol Screen. 1999;4(2):67–73. doi: 10.1177/108705719900400206. [DOI] [PubMed] [Google Scholar]