Abstract
Trp151 in the lactose permease of Escherichia coli (LacY) is an important component of the sugar-binding site and the only Trp residue out of six in close proximity to the galactopyranoside in the structure (PDB ID: 1PV7). The short distance between Trp151 and the sugar is favorable for Förster resonance energy transfer (FRET) to nitrophenyl or dansyl derivatives with the fluorophore at the anomeric position of galactose. Modeling of 4–nitrophenyl-α-d-galactopyranoside (α-NPG) in the binding-site of LacY places the nitrophenyl moiety about 12 Å away from Trp151, a distance commensurate with the Förster distance for a Trp-nitrobenzoyl pair. We demonstrate here that α-NPG binding to LacY containing all six native Trp residues causes galactopyranoside-specific FRET from Trp151. Moreover, binding of α NPG is sufficiently slow to resolve time-dependent fluorescence changes by stopped-flow. The rate of change in Trp→α-NPG FRET is linearly dependent upon sugar concentration, which allows estimation of kinetic parameters for binding. Furthermore, 2-(4’-maleimidylanilino)naphthalene-6-sulfonic (MIANS) covalently attached to the cytoplasmic end of helix X is sensitive to sugar binding, reflecting a ligand-induced conformational change. Stopped-flow kinetics of Trp→α-NPG FRET and sugar-induced changes in MIANS fluorescence in the same protein reveal a two-step process: a relatively rapid binding step detected by Trp151→α-NPG FRET followed by a slower conformational change detected by a change in MIANS fluorescence.
Keywords: Trp fluorescence, FRET, membrane transporter, structure, sugar binding
The lactose permease of Escherichia coli (LacY), a member of Major Facilitator Superfamily (1), is arguably the most intensively studied membrane transport protein (2, 3), and one of few with a known crystal structure (4). A proposed mechanism for lactose transport (3) includes ordered binding of an H+ and a galactopyranoside on one side of the membrane followed by a conformational change and ordered release of the sugar and the H+ on the opposite side. Although the X-ray structure of LacY reveals an inward-facing conformation, there is a body of data (3) supporting the concept that the transport cycle includes wide-spread conformational changes linked to the binding and release of sugar. Therefore, knowledge regarding individual steps in the transport mechanism is paramount to understanding the overall mechanism.
Only a handful of side chains are essential for sugar recognition and binding (Fig. 1B). Arg144 (helix V) forms a bi-dentate H-bond with the O4 and O3 atoms of the galactopyranosyl ring (4), confirming the critical role of this residue in sugar binding and recognition (3). Glu126 (helix IV), another important residue for binding, is in close proximity to Arg144 and may interact with the O4, O5 or O6 atoms of the galactopyranosyl ring via water molecules. An aromatic residue at position 151 (helix V), preferably Trp, is irreplaceable for sugar binding (5), stacking hydrophobically with the galactopyranosyl ring (6, 7). Glu269 (helix VIII) in the C-terminal domain, which is also involved in H+ translocation, may interact with the O3 atom of the galactopyranosyl ring, forms a salt bridge with Arg144 and is in close proximity to Trp151 (4, 7-9).
Figure 1.
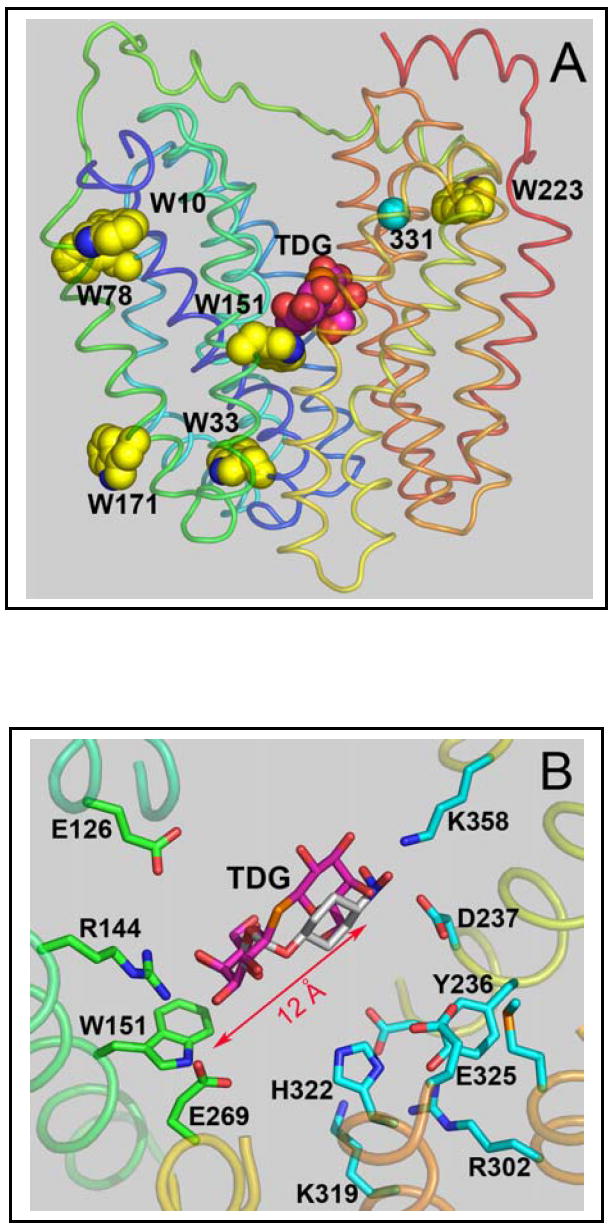
Location of Trp residues in the structure of C154G LacY with bound sugar (PDB ID: 1PV7). The structures is displayed with Pymol 0.98 (DeLano Scientific LLC, Inc.), and transmembrane helices are colored from blue (helix I) to red (helix XII). A. Overall structure of LacY with all native Trp residues shown as yellow spheres and bound TDG shown as pink spheres. A cyan sphere highlights the Cα atom of position 331. B. Modeling of bound α-NPG. Amino acid residues involved in substrate binding and/or proton translocation (Glu269 is involved in both) are shown in green and cyan sticks, respectively. Bound TDG is shown as pink sticks and the position of the nitrophenyl moiety in α-NPG is shown as grey sticks.
Detection and quantification of sugar binding can be accomplished by flow dialysis or substrate protection against alkylation of Cys148 with maleimides (10-16). Cys148 is near the sugar-binding site in LacY, and sugar binding sterically blocks alkylation. Each of these techniques is a steady-state measurement, and involves use of radioactivity or fluorescence. Binding can also be detected and quantified by ligand-induced changes in the fluorescence of 2-(4’-maleimidylanilino)naphthalene-6-sulfonic acid (MIANS) with purified single-Cys V331C. In this case, the fluorophore is positioned far from sugar binding site and reflects a long-range conformational change resulting from sugar binding (11, 14, 15, 17). However, none of the methods have been used to measure kinetic parameters.
In this paper we describe a novel method for determining and quantifying sugar binding by using the intrinsic Trp fluorescence of purified LacY. Formation of a donor-acceptor pair between Trp151 and α-NPG or 6’-(N-dansyl)aminohexyl-1-thio-β-d-galactopyranoside (Dns6Gal) in the sugar-binding site results in Förster resonance energy transfer (FRET), which can be measured in the steady-state or by stopped-flow. In addition, the time course of a ligand-induced conformational change is measured with MIANS-labeled V331C LacY. The results are consistent with a mechanism in which a relatively rapid sugar-binding step is followed by a slower conformational change.
EXPERIMENTAL PROCEDURES
Materials
Oligonucleotides were synthesized by Integrated DNA Technologies, Inc (Coralville, IA). Restriction enzymes were purchased from New England Biolabs (Beverly, MA). The QuickChange II kit was from Stratagene, (La Jolla, CA). Dns6Gal was synthesized as described (18). All other sugar derivatives were purchased from Sigma (St. Louis, MO). Talon superflow resin was obtained from BD Clontech (Palo Alto, CA). 2-(4’-maleimidylanilino)naphthalene-6-sulfonic acid (sodium salt) (MIANS) was purchased from Molecular Probes (Eugene, Oregon). All other materials were of reagent grade obtained from commercial sources.
Construction of mutants
LacY mutants were constructed by site-specific mutagenesis using the QuikChange® II site-directed mutagenesis kit and plasmid pT7-5/LacY as a template. Generally, 30-40 bp direct and reverse primers bearing the mutated triplet in the middle of the primer were designed by using the Vector NTI 9.1 Suit program (Invitrogen, Carlsbad, CA). All mutagenesis procedures were done according to the QuickChange II manual except that the temperature of the extension reaction was lowered to 68°C during PCR-directed mutagenesis to reduce possible primer duplication. Mutagenic constructs were sequenced over the entire gene to confirm mutations introduced and to discard unwanted mutations. All constructs were engineered with a C-terminal His-tag to enable purification by affinity chromatography.
LacY purification
LacY mutants were purified from E. coli XL1-Blue cells transformed with given plasmids essentially as described (16) by using Co(II) affinity chromatography on Talon resin (BD Clontech, Palo Alto, CA). All protein preparations were at least 95% pure as judged by silver staining after sodium dodecyl sulfate polyacrylamide gel electrophoresis.
MIANS labeling
Purified C154G/V331C/LacY (40-50 μM) was labeled with an equimolar concentration of MIANS in 50 mM NaPi (pH 7.0)/0.02% dodecyl-β-d-maltopyranoside (DDM) in the presence of 15 mM TDG for protection of Cys148 against alkylation. Reactions were carried out for 15 min at room temperature in the dark. TDG and unreacted MIANS were removed by buffer exchange on an Amicon Ultra-15 concentrator with a 30-kDa cut-off (Millipore, Bedford, MA). The extent of labeling estimated from absorption spectra was 0.7-0.8 mol/mol of protein. Control experiments with C154G/LacY lacking Cys331 resulted in essentially no labeling by MIANS under the same conditions.
Fluorescence measurements
Fluorescence was measured at room temperature with an SLM-Aminco 8100 spectrofluorometer (Urbana, IL) modified for computer-controlled steady-state and stopped-flow modes by OLIS, Inc. (Bogart, GA). Windows-based Olis GlobalWorks software was used for instrument control and stopped-flow trace fitting. All measurements were performed in degassed 50 mM NaPi (pH 7.5)/0.02% DDM. Steady-state measurements were carried out in 1 × 1 cm cuvettes (2 ml) with constant stirring. Emission spectra were recorded with slit widths of 4 and 8 mm for excitation and emission, respectively. All fluorescence changes were corrected for dilution resulting from addition of the ligand. Stopped-flow measurements were performed with an apparatus specifically designed for the SLM-Aminco 8100 by OLIS, Inc. Typically, 0.2 ml solutions from each pneumatically controlled syringe were mixed in Ball-Berger mixer, and fluorescence changes were recorded by using excitation and emission wavelengths of 295 and 330 nm for Trp→α-NPG FRET, respectively, or 330 and 415 nm for MIANS fluorescence, respectively. Binding experiments were carried out by mixing protein samples (syringe 1) with α-NPG (syringe 2). Displacement rates measurements were done by mixing of protein preincubated with α-NPG (syringe 1) with an excess of β-d-galactopyranosyl-1-thio-β-d-galactopyranoside (TDG), containing the same concentration of α-NPG as in syringe 1 (syringe 2). The dead-time of the instrument (2.7 msec) was determined experimentally by following quenching of N-acetyl-tryptophanamide fluorescence by N-bromo-succinimide (19) and was used to correct the measured amplitudes in single exponential fitting of the fluorescence changes.
Molecular modeling
The X-ray structure of C154G LacY with bound TDG (PDB ID: 1PV7) was used for docking of α-NPG into the sugar-binding site. The coordinates of p-aminophenyl-α-d-galactopyranoside bound to enterotoxin B at 1.6 Å resolution (PDB ID: 1EFI) were used to build the structure of α-NPG by using Chem3D ultra 9.0 (Chembridgesoft Corp., Chembridge, MA) with energy minimization in the MOPAC module. The resulting coordinates were used for modeling by aligning the galactopyranoside moiety with TDG in the pair-fitting mode (Pymol 0.98, DeLano LLC, Inc.).
RESULTS
Modeling of bound α-NPG
LacY contains six Trp residues at positions 10, 33, 78, 151, 171, and 223, five of which are located in N-terminal 6-helix bundle. Only Trp151 is in the sugar-binding site located at the apex of the inward-facing cavity in the X-ray structure (Fig. 1A). The distance from the indol ring of Trp151 to the furthest galactopyranosyl ring of TDG is about 12 Å, which is favorable for FRET between Trp151 and bound substrate with nitrophenyl or dansyl groups at the anomeric carbon of galactose (20). Indeed, positioning α-NPG in the sugar-binding site of LacY by aligning the galactopyranosyl ring with TDG places the nitrophenyl moiety about 12 Å from Trp151 (Fig. 1B). Therefore, the spatial orientation of α-NPG in the binding site should yield high-efficiency FRET. On the other hand, the distance from bound α-NPG to each of the other five Trp residues is much longer than the Förster distance (R0) for a Trp-nitrobenzoyl pair (16 Å) (20), making FRET unlikely.
Sugar binding determined by Trp→α-NPG FRET
Initial evidence for FRET between Trp151 and galactopyranosyl derivatives was obtained from steady-state fluorescence experiments. The Trp emission spectrum of C154G/LacY with all six native Trp residues exhibits a maximum at 328 nm (Fig. 2A; solid line 1). Addition of increasing concentrations of α-NPG results in a progressive decrease in Trp fluorescence (Fig. 2A; solid lines 2, 3 and 4). Since α-NPG has a broad absorption spectrum with maximum at 306 nm (not shown), the sugar derivative affects Trp fluorescence by two simultaneous processes: (1) by serving as non-fluorescent FRET acceptor from Trp151 in the binding site and (2) by acting as an inner filter and absorbing irradiated excitation light at 295 nm as well as fluorescence emission of Trp. In order to discriminate between the two processes, the relatively high-affinity lactose analogue TDG, which does not absorb light over the range of wavelengths studied, was used. Addition of saturating concentrations of TDG in the absence of α-NPG causes little or no change in the emission spectrum of Trp (Fig. 2A, upper-most broken line). However, when TDG is added after incubation with α-NPG, a significant increase in Trp fluorescence is observed (Fig. 2A, arrows) due to displacement of α-NPG from the binding site. Thus, the increase in Trp fluorescence upon addition of TDG represents a specific FRET effect, while the rest of fluorescence change that is not restored by TDG represents the non-specific inner-filter effect (IFE) caused by α-NPG in solution (21). Specific Trp→α-NPG FRET measured as a result of α-NPG binding to LacY and displacement by excess of TDG does not depend on the non-specific IFE generated by addition of p-nitrophenyl-α-d-glucopyranoside (α-NPGlc), which does not bind to LacY (22, 23) (see Supplementary Fig. 1S). The apparent affinity for α-NPG is estimated from the concentration dependence of the specific fluorescence change after addition of excess TDG (Fig. 2B). The calculated KD of 19 μM is virtually identical to that (22 to 32 μM) obtained by flow dialysis (15). At a saturating α-NPG concentration, the maximum change in Trp fluorescence is about 50% (Fig. 2B). Thus, the distance between the donor Trp and α-NPG is close to R0 in agreement with modeling results.
Figure 2.
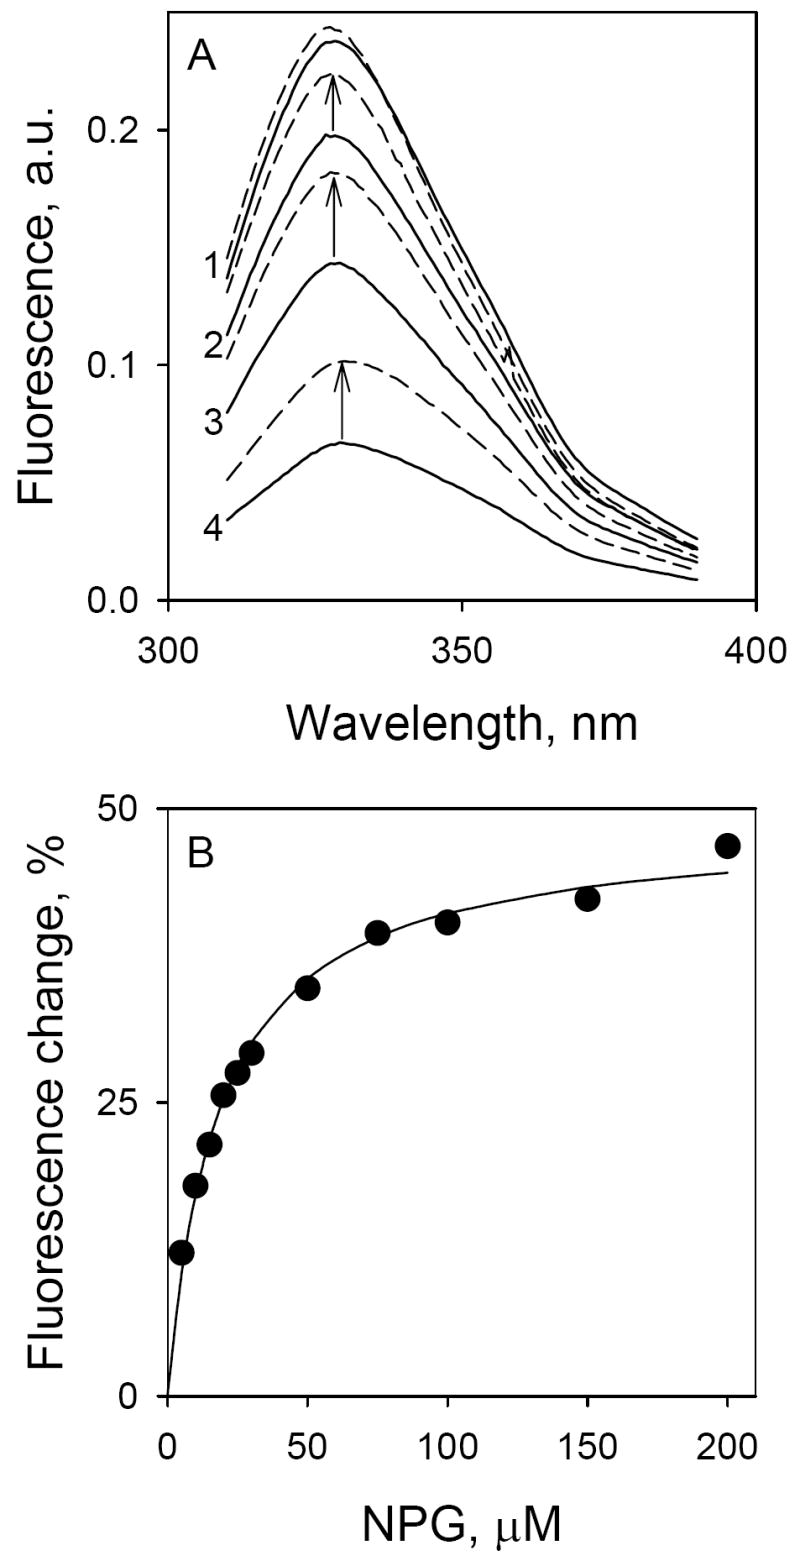
Binding of α-NPG to C154G LacY as detected by Trp→α-NPG FRET. Measurements were carried out in 50 mM NaPi (pH 7.5)/0.02% DDM at a protein concentration of 0.4 μM; excitation was at 295 nm. A. Trp emission spectra at different concentrations of α-NPG. Solid lines represent Trp fluorescence at increasing α-NPG concentrations: line 1, protein without α-NPG; line 2, 5 μM α-NPG; line 3, 15 μM α-NPG; line 4, 50 μM α-NPG. Arrows indicate change of fluorescence after displacement of bound α-NPG by addition of 10 mM TDG. Broken lines, spectra after addition of TDG. B. Affinity of C154G LacY for α-NPG measured by displacement with TDG. The fluorescence change after addition of 10 mM TDG (shown as arrows in panel A) plotted as a function of α-NPG concentration. Fluorescence after TDG addition was taken as 100% at each α-NPG concentration. Solid line shows hyperbolic fit to the data with estimated KD = 19 ± 2.0 μM.
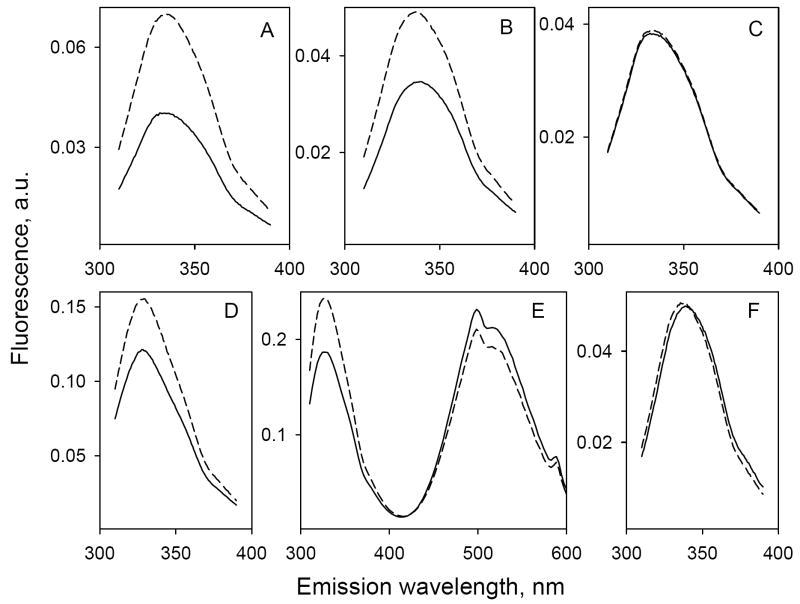
Wild-type LacY exhibits specific Trp→α-NPG FRET in a manner similar to that of mutant C154G/LacY, which binds substrate with high affinity but does very little transport (15, 24, 25). However, the change in Trp fluorescence at the same α-NPG concentration (100 μM) is significantly larger for the C154G mutant relative to wild-type LacY (Fig. 3A and B, respectively).
Figure 3.
Effect of point mutations in LacY and the nature of the sugar on Trp→sugar FRET. Solid lines represent Trp emission spectra (excitation wavelength 295 nm) recorded after short incubation of purified protein in 50 mM NaPi (pH 7.5)/0.02% DDM with 100 μM sugar derivative prior to TDG addition. Broken lines are Trp emission spectra after addition of 10 mM TDG. The protein concentration was 0.5 μM except in panel E where it was 2 μM. Trp emission spectra without ligand are not shown. A. C154G LacY mixed with α-NPG. B. Wild-type LacY mixed with α-NPG. C. W151Y/C154G LacY mixed with α-NPG. D. C154G LacY mixed with ortho α-NPG. E. C154G LacY mixed with Dns6Gal. F. C154G LacY mixed with α- or β-NPGlc or with the β-anomer of para- or ortho-NPG.
Replacement of Trp151 with Tyr completely abolishes Trp→α-NPG FRET. Trp fluorescence in the presence of α-NPG is unaffected by addition of TDG (Fig. 3C), although both sugars bind to W151Y LacY, as shown by flow dialysis (5). Therefore, it is apparent that Trp151 alone is the FRET donor to α-NPG, while the other five Trp residues do not participate in the phenomenon (compare Fig. 3A and C).
The nature of the energy acceptor, as well as affinity of LacY for the galactosidic substrate, plays an important role in FRET. Addition of the ortho derivative of α-NPG results in significantly less efficient FRET (compare Fig. 3D and A) in all likelihood because affinity for ortho α-NPG is 5-times lower than that of the para compound (26). Galactopyranosides with nitrophenyl in β-anomeric configuration exhibit very weak binding (26) and have only a non-specific inner filter effect on Trp fluorescence (Fig. 3F).
6’-(N-dansyl)aminohexyl-1-thio-β-d-galactopyranoside (Dns6Gal) is another galactopyranosyl derivative (18) that acts as an acceptor since the R0 for a Trp-dansyl pair is 21 Å (20). The absorbance maximum of Dns6Gal (306 nm) is the same as that of α-NPG, and it also has a non-specific inner-filter effect. Unlike α-NPG, Dns6Gal is fluorescent with an emission maximum at 500 nm, thereby allowing detection of FRET as a change in the fluorescence of the donor (Trp), as well as the acceptor (Dns6Gal). The data presented in Fig. 3E exhibit a simultaneous increase in Trp fluorescence and a decrease in dansyl fluorescence after displacement of bound Dns6Gal with excess TDG.
Since the C4-OH group of the galactopyranosyl ring determines the specificity of binding (22, 23), p-nitrophenyl-α-d-glucopyranoside (α-NPGlc), which differs from α-NPG solely by the position of C4-OH in pyranosyl ring, as well as the β-anomer, was tested. There is no change in Trp fluorescence upon addition of TDG to protein mixed with either sugar (Fig 3F) because neither binds to LacY (23); only the non-specific inner filter effect is observed.
Stopped-flow Trp151→α-NPG FRET
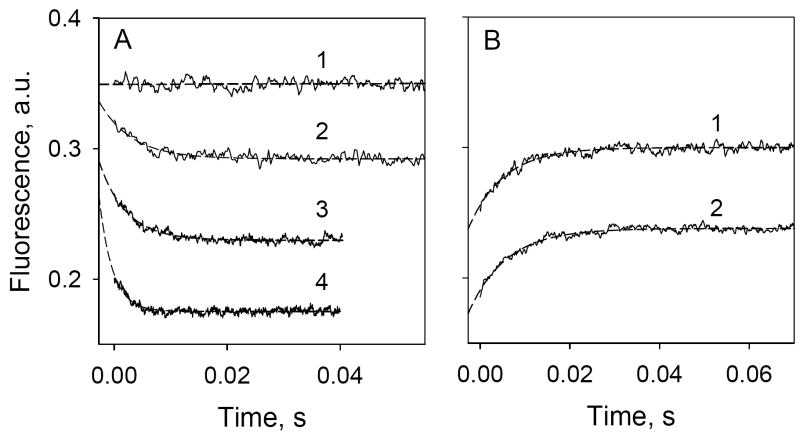
In order to obtain dynamic information on sugar binding, stopped-flow was applied to measure the time-course of α-NPG binding. No change in Trp fluorescence is observed when LacY is mixed with buffer alone (Fig. 4A, trace 1). Mixing of the protein with increasing concentrations of α-NPG results in two effects: (1) an initial drop in Trp fluorescence that is proportional to α-NPG concentration (intersept of traces 2-4 with Y axis in Fig. 4A), which represents the inner-filter effect that cannot be resolved in time by the stopped-flow instrument; and (2) a much slower decrease in fluorescence due to Trp→α-NPG FRET. The traces shown were fitted with a single exponential equation and corrected for the dead time of the instrument (2.7 msec) (Fig. 4, broken lines). Rates of fluorescence change (kobs) increase at higher α-NPG concentrations (Fig. 4A; compare traces 2, 3 and 4). In contrast, the rate of increase in Trp fluorescence after rapid addition of excess TDG to pre-formed LacY/α-NPG complexes is independent of α-NPG concentration (Fig. 4B; compare traces 1 and 2).
Figure 4.
Stopped-flow Trp→ α-NPG FRET. Trp fluorescence changes with time were recorded after rapid mixing of purified C154G LacY with ligand in 50 mM NaPi (pH 7.5)/0.02% DDM. Excitation and emission wavelengths were 295 and 330 nm, respectively. Stopped-flow traces (average of 5-7 measurements shown as solid lines) were fit using a single exponential equation and corrected for the instrument dead-time of 2.7 ms (broken lines). Final protein (1 μM) and sugar concentrations are given after mixing. A. Trp→ α-NPG FRET after mixing protein with buffer only (1), 10 μM α-NPG (2), 25 μM α-NPG (3) or 50 μM α-NPG (4). Estimated rates (kobs) are 170 s-1, 210 s-1, and 420 s-1 for 10 μM, 25 μM, and 50 μM α-NPG, respectively. B. Displacement of bound α-NPG by excess TDG. Traces were recorded after mixing a saturating concentration of TDG (15 mM) with protein pre-incubated with α-NPG. α-NPG concentrations were 25 μM (1) and 50 μM (2). Estimated kobs are 128 and 122 s-1 for 25 and 50 μM α-NPG, respectively.
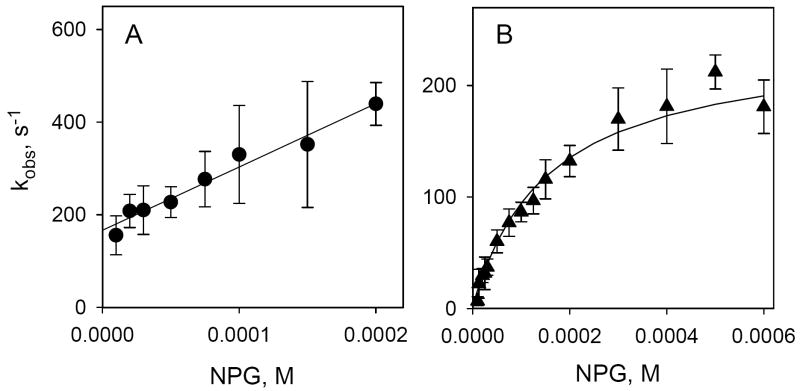
The concentration dependence of kobs is linear over a wide range of α-NPG concentrations (Fig. 5A). Single-step reversible binding of sugar is a pseudo-first order reaction when the concentration of protein is much lower than ligand. The reaction can be described as follows:
Figure 5.
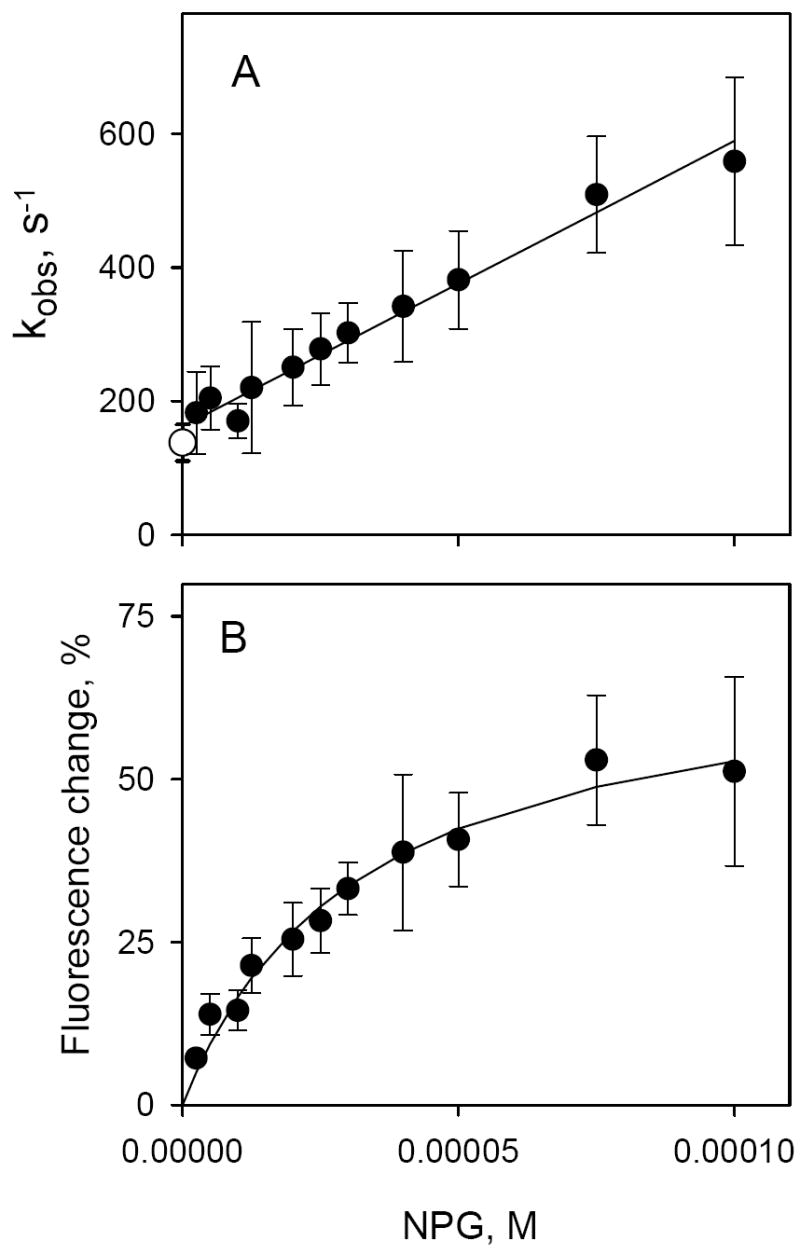
Kinetics of α-NPG binding to C154G LacY detected by Trp→ α-NPG FRET. Stopped-flow traces were recorded after rapid mixing of purified protein with given concentrations of α-NPG as described in Figure 4 and were individually fitted with a single exponential equation. Kinetic parameters (kobs and amplitude of fluorescence changes) were estimated statistically and plotted versus α-NPG concentration. Each point is a result of 7-10 measurements with standard deviations shown as vertical bars. A. Concentration dependence of the rates (kobs) of α-NPG binding. The open circle represents the rate of displacement of bound α-NPG (25 μM) with 15 mM TDG. The intercept with the Y axis is koff (162 ± 9 s-1) and the slope is kon (4.3 ± 0.2 × 10⁶ M-1 s-1); the estimated KD = 38 ± 2 μM. B. Concentration dependence of the amplitude of Trp→α-NPG FRET from the experiments shown on Panel A. The amplitude of the fluorescence changes at each α-NPG concentration were corrected for the instrument dead-time (2.7 ms) and expressed as percentage of final fluorescence level in each experiment. Solid line is a hyperbolic equation fit to data. Estimated KD = 32 ± 5 μM.
| (Eq. 1) |
The kobs (reciprocal relaxation time 1/τ) for this reaction depends linearly on ligand concentration.
| (Eq. 2) |
The individual rate constants for α-NPG binding calculated by linear regression analysis are: kon = 4.3 ± 0.2 × 10⁶ M-1 s-1 (determined from the slope) and koff = 162 ± 9 s-1 (extrapolation to Y axis). The rate of α-NPG displacement by excess of TDG (open symbol) is in a good agreement with koff determined from binding experiments (Fig. 5A). The equilibrium dissociation constant (KD = koff/kon) is 38 ± 4 μM, in good agreement with the value obtained from steady-state measurements (Fig. 2B). The concentration dependence of the amplitude of the fluorescence change taken from the same stopped-flow experiments is shown in Fig. 5B. Consistently, the value for KD calculated from the data is 32 ± 5 μM.
Two-step process detected with MIANS-labeled LacY
Replacement of Val331 with Cys allows MIANS labeling at the cytoplasmic end of helix X far from the sugar-binding site (Fig. 1A), and sugar binding decreases MIANS fluorescence of labeled single-Cys331 LacY (11, 15, 17). Since Trp→α-NPG FRET measures direct interaction of α-NPG with LacY, we explored the possibility of comparing the effect of α-NPG binding on Trp151 and MIANS fluorescence in the same modified protein (i.e., MIANS-labeled V331C/C154G LacY).
MIANS at position 331 is a FRET acceptor from Trp (R0 = 22 Å) (20). Thus, excitation of Trp fluorescence in unlabeled C154G LacY at 295 nm exhibits a typical emission spectrum with a maximum at 330 nm, while excitation of MIANS-labeled C154G LacY at 330 nm exhibits MIANS fluorescence with a maximum at 415 nm (Fig. 6A, lines 1 and 3, respectively). Dramatically, when the MIANS-labeled protein is excited at 295 nm, Trp fluorescence is markedly diminished, and emission of MIANS at 415 nm is observed. In addition to Trp151, but to a lesser extent, Trp223 may also serve as a FRET donor to MIANS at position 331 (Fig. 1A). However, the remaining four Trp residues in LacY probably play little role, since the estimated distances between Cys331 and the other four Trp residues are much longer than R0. In this regard, W151Y/V331C LacY mutant labeled with MIANS displays 70-75% less Trp→MIANS FRET, confirming Trp151 as the major donor (data not shown). TDG markedly decreases MIANS emission, but has no effect on Trp fluorescence (Fig. 6B), Therefore, sugar binding alters the local environment around MIANS at the end of helix X, but does not change the distance between Trp151 and MIANS. However, addition of α-NPG to MIANS-labeled LacY results in significant decreases in both Trp and MIANS fluorescence (Fig. 6C).
Figure 6.
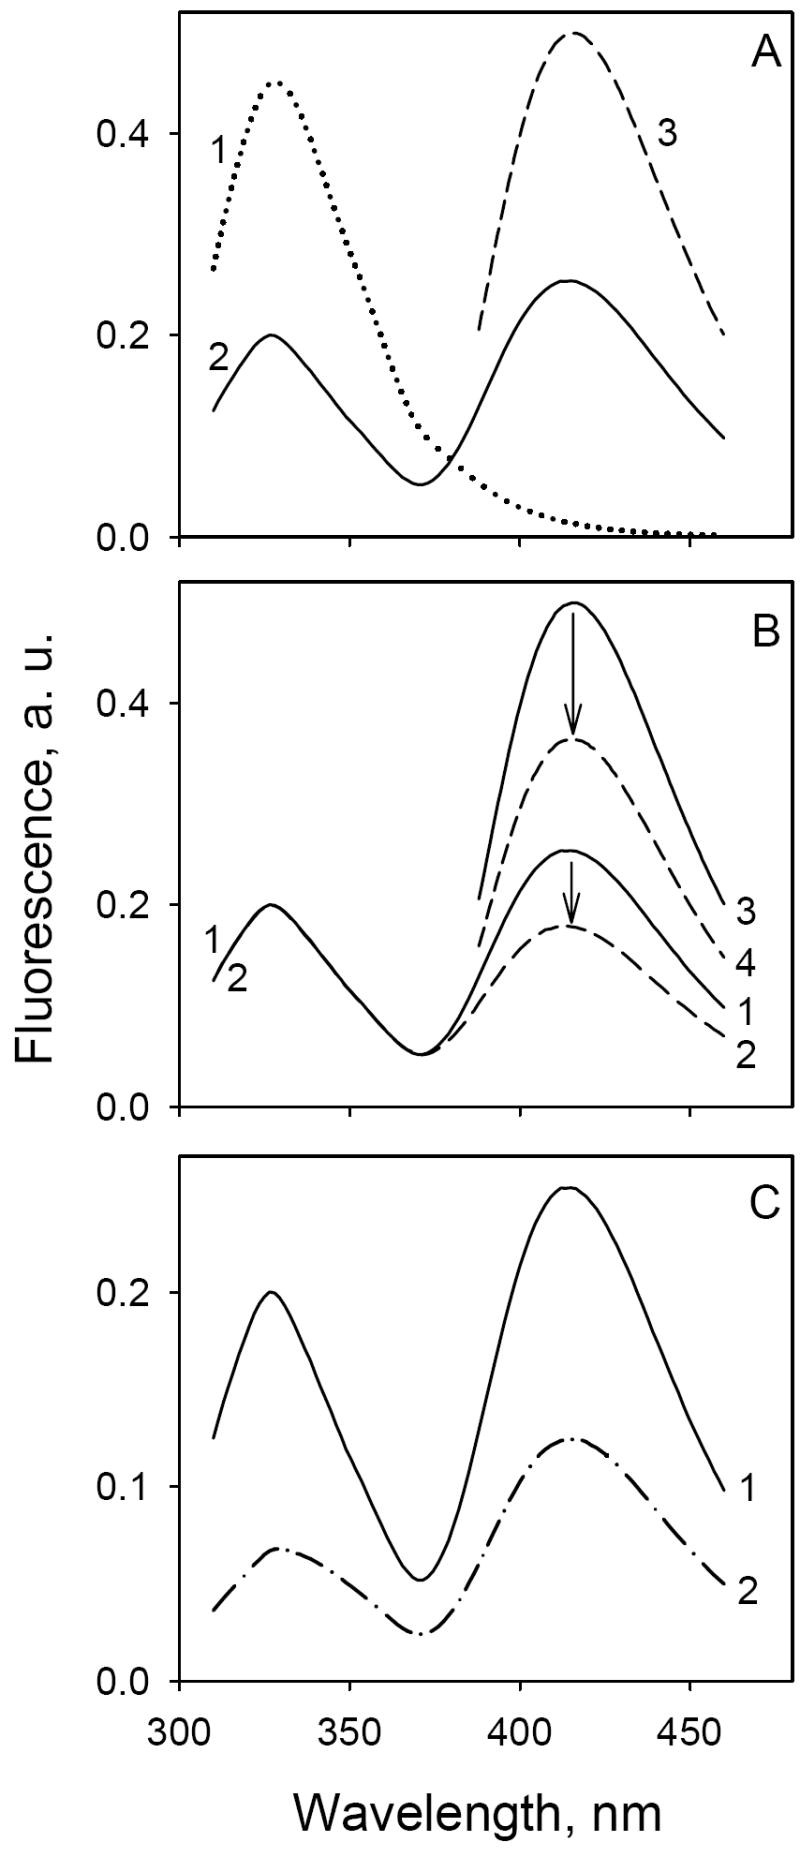
Trp→ α-NPG FRET and α-NPG-induced fluorescence change in MIANS-labeled C154G/V331C LacY. Emission spectra were recorded in 50 mM NaPi (pH 7.5)/0.02% DDM at 0.6 μM final protein concentration. A. Fluorescence of unlabeled (line 1) or MIANS-labeled (lines 2, 3) LacY without sugar; excitation wavelengths 295 nm (lines 1, 2) or 330 nm (line 3) for Trp→ α-NPG FRET or MIANS fluorescence, respectively. B. TDG effect on the fluorescence of MIANS-labeled C154G/V331C LacY; excitation at 295 nm (lines 1,2) or 330 nm (lines 3,4). Solid lines, no TDG; broken lines, addition of 15 mM TDG. The fluorescence change indicated by arrows is 30% in both cases. C. α-NPG effect on fluorescence of MIANS-labeled LacY with excitation at 295 nm: line 1, no α-NPG; line 2, addition of 50 μM α-NPG.
This complex effect of α-NPG on fluorescence is a combination of the inner filter effect, Trp→α-NPG FRET and the specific effect of α-NPG on MIANS fluorescence, and each effect can be analyzed separately. Stopped-flow traces of the α-NPG binding were recorded using two sets of wavelengths at each concentration of α-NPG. Trp→α-NPG FRET was measured at excitation and emission wavelengths of 295 and 330 nm, respectively (Fig. 7A), and the decrease in MIANS fluorescence was measured at excitation and emission wavelengths of 330 and 415 nm, respectively (Fig. 7B). Mixing protein with α-NPG results in two effects: (1) an initial drop of fluorescence caused by the inner-filter effect and (2) time-dependent fluorescence changes. Single exponential fits to the data demonstrate that rates of α-NPG binding increase with α-NPG concentration with respect to both Trp→α-NPG FRET and the change in MIANS fluorescence, but on different time scales (compare traces 1, 2 and 3 in Fig. 7A & B). The rate of change in MIANS fluorescence is clearly slower than the rate of change in Trp→α-NPG FRET at given α-NPG concentrations. Furthermore, the rate of α-NPG displacement with a saturating concentration of TDG measured for MIANS-labeled protein is in a good agreement with the rate of sugar release for protein unmodified with MIANS (compare upper trace on Fig. 7A with Fig. 4B).
Figure 7.
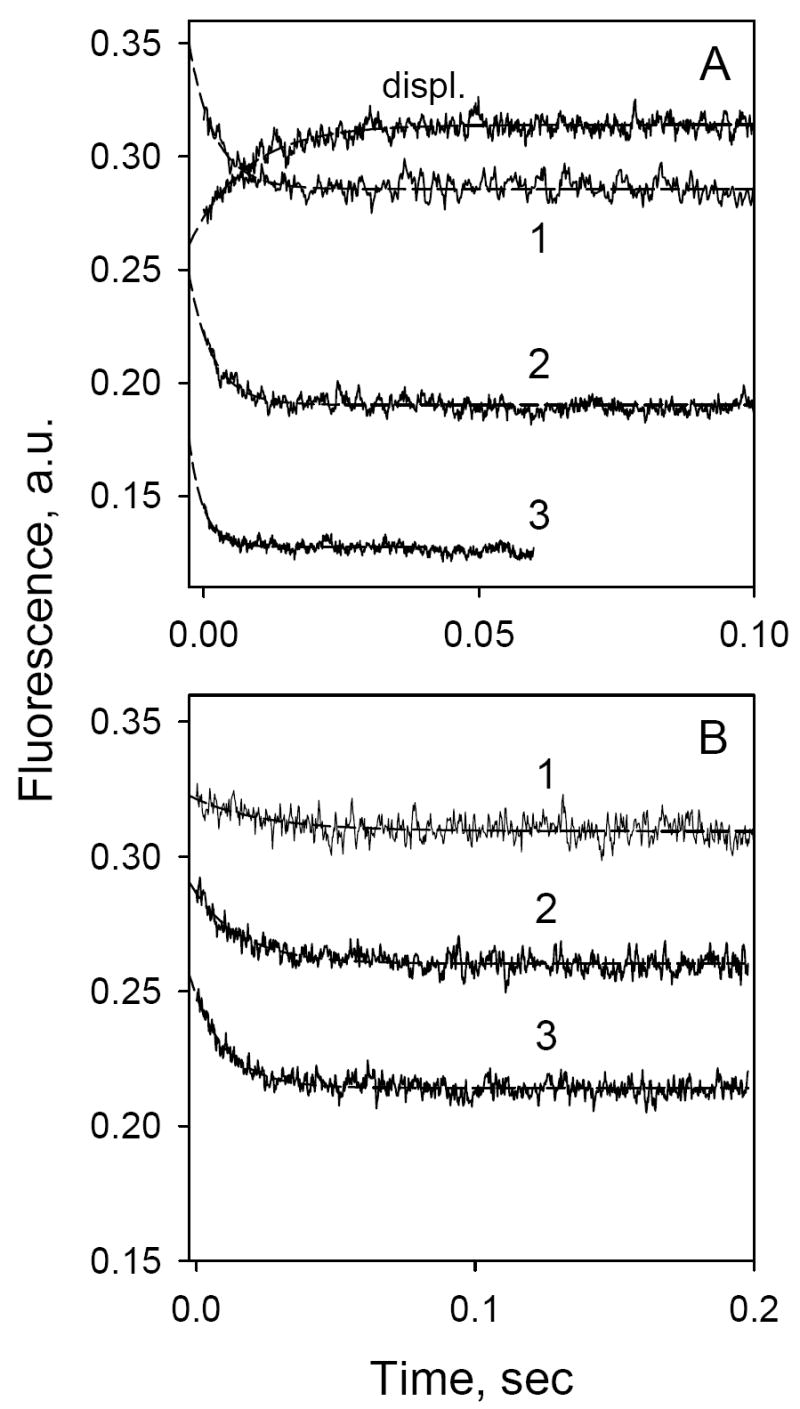
Time-dependent changes in Trp→ α-NPG FRET (A) or MIANS fluorescence (B) with MIANS-labeled C154G/331C LacY. Stopped-flow traces were recorded after rapid mixing of protein (1 μM, final concentration) with α-NPG at excitation and emission wavelengths of 295 and 330 nm (A) or 330 and 415 nm (B), respectively. α-NPG concentrations were: 20 μM (1), 50 μM (2) or 100 μM (3). The upper trace in panel A represents displacement of bound α-NPG (25 μM) by excess of TDG (15 mM). Other experimental details are described in Figure 4. Estimated rates (kobs) are 210 s-1, 230 s-1 and 380 s-1 for traces 1, 2 and 3 in panel A, and 40 s-1, 58 s-1 and 82 s-1 for traces 1, 2 and 3 in panel B, respectively.
The concentration dependence for the rate change in fluorescence measured at 330 (Trp→α-NPG FRET) and 415 nm (MIANS) in the same stopped-flow experiment is very different (Fig. 8A & B). Trp→α-NPG FRET displays a linear dependence on α-NPG concentration (Fig. 8A) in essentially the same manner as for LacY unmodified with MIANS (Fig. 5A). In contrast, the rate change in MIANS fluorescence exhibits a hyperbolic dependence on α-NPG concentration (Fig. 8B), indicating that there are at least two steps in the overall process.
Figure 8.
Concentration dependence of the rates of Trp→ α-NPG FRET (A) and α-NPG-induced changes in MIANS fluorescence (B) with MIANS-labeled C154G/V331C LacY. Two sets of data were collected after mixing of MIANS-labeled protein with α-NPG by stopped-flow: panel A, excitation and emission wavelengths, 295 and 330 nm for Trp→ α-NPG FRET; panel B – excitation and emission wavelengths, 330 and 415 nm for MIANS fluorescence. Other experimental details are described in the legend to Figure 5. The solid line in panel A shows linear regression fit with koff = 166 ± 10 s-1 and kon = 1.4 ± 0.1 × 10⁶ M-1 s-1. Estimated KD = 121 ± 8 μM. The solid line in panel B shows the hyperbolic fit (Eq. 4) to the experimental data with estimated parameters k2 = 238 ± 12 s-1, k-2 = 2 ± 7 s-1 and KD = 158 ± 31 mM.
A two-step reversible reaction can be described as follows:
| (Eq. 3) |
The observed rate k1obs (1/τ1) for the first step (Trp→α-NPG FRET) depends linearly on ligand concentration (Fig. 8A), and kinetic parameters kon and koff are estimated from linear regression analyses (Eq. 2). The observed rate k2obs (1/τ2) for the second step (the change in MIANS fluorescence) exhibits a hyperbolic dependency on the concentration of the substrate (Fig. 8B) indicating that the second step is slow with forward and reverse rate constants (k2 and k-2) estimated from Eq. 4 (27) :
| (Eq. 4) |
The calculated values of kon and koff for Trp→α-NPG FRET with MIANS-labeled protein are 1.4 ± 0.1 × 10⁶ M-1 s-1and 166 ± 10 s-1, respectively. Binding affinity for α-NPG is 3-4 times lower for the MIANS-modified protein (KD = 120 ± 8 μM) because kon is ca. 3-times lower than observed for the unlabeled protein (see Fig. 5A). The KD calculated from the hyperbolic concentration dependence of the rate change in MIANS fluorescence (158 ± 31 μM) is consistent with the KD calculated from kon and koff derived from the Trp→α-NPG FRET measurements. The values of k2 and k-2 calculated from equation 4 are 238 ± 12 s-1 and 2.3 ± 7.5 s-1, respectively.
DISCUSSION
Modeling studies (Fig. 1B) indicating that α-NPG should act as a FRET acceptor from Trp are confirmed by fluorescence experiments. Trp fluorescence decreases dramatically upon addition of α-NPG in two phases, a non-specific filter effect and a specific FRET signal that is elicited in steady-state experiments by displacement of the acceptor α-NPG with TDG, a non-fluorescent galactopyranoside (Fig. 2A). The apparent affinity for α-NPG calculated from the concentration dependence (Fig. 2B) is very similar to that measured by flow dialysis (15). Wild-type LacY also exhibits Trp→α-NPG FRET, but with lower efficiency (Fig. 3B), which is consistent with the lower affinity of the wild type protein for α-NPG. Replacement of Trp151 with Tyr results in a complete loss of the specific FRET effect, although the mutation does not preclude substrate binding (5-7). The observation strongly indicates that the other five Trp residues in LacY do not participate in Trp→α-NPG FRET and that Trp151 is the only energy donor, as predicted from the structure and modeling, thereby obviating the need for single-Trp151.
Mutant C154G in the membrane binds ligand at least as well as wild-type LacY, but is defective with respect to all modes of sugar translocation (15, 24, 25). In addition, purified C154G LacY binds α-NPG with 2-3 times better affinity than wild type, exhibits little tendency to aggregate in DDM, is thermostable and strongly favors an inward-facing conformation (PDB ID: 1PV7) (4, 15, 16). In these experiments, C154G LacY was used in order to study a well-expressed, stable molecule that binds α-NPG with high affinity, which reduces the inner filter effect.
Only galactoside derivatives, that have an absorption overlapping with the Trp emission wavelength, are acceptors for energy transfer. The galactopyranosyl ring is the specificity determinant for binding to LacY, and affinity depends on the nature of the sugar homologue. Thus, glucopyranosides, which differ from galactopyranosides only by the orientation of the C4-OH, do not bind (22, 23) and have no specific effect on Trp fluorescence (Fig. 3F). Furthermore, hydrophobic aglycons of D-galactopyranosides increase binding affinity, and α anomers have higher affinity than β anomers (26). Consistently, the largest specific FRET signal is observed with α-NPG, and the β anomer of either para or ortho NPG causes no specific change whatsoever in Trp fluorescence (Fig. 3F). However, other nitrophenyl derivatives such as ortho α-NPG and Dns6Gal also exhibit FRET (Figs. 3D, E). Moreover, with Dns6Gal binding to LacY, FRET monitored by a TDG-induced increase in Trp fluorescence coincides with a reciprocal decrease in Dns6Gal fluorescence due to Dns6Gal displacement (Fig. 3E).
Steady-state Trp→α-NPG FRET at increasing concentrations of α-NPG yields an apparent KD for α-NPG, but gives no information regarding rates of binding or release. However, time-dependent Trp→α-NPG FRET obtained by stopped-flow allows direct determination of sugar binding rates. Thus, an important step in the overall mechanism of LacY, ligand binding, can be studied by measuring the kinetic parameters for α-NPG binding.
Rates of sugar binding were measured at α-NPG concentrations ranging from 5 to 100 μM. The fluorescence change with time is a pseudo-first order process, and the data fit well to a single exponential. The effect of α-NPG concentration on the rate of binding is linear (Fig. 5A), as predicted by Eq. 2, indicating that the phenomenon represents a single step in the transport mechanism. Estimated individual rate constants for α-NPG binding are kon = 4.3 × 10⁶ M-1 s-1 and koff = 162 s-1. The equilibrium dissociation constant for α-NPG binding in DDM calculated from individual rate constants is 38 μM, which is virtually identical to the KD calculated from stopped-flow fluorescence amplitude change (Fig. 5B) and from steady-state measurements (Fig. 2 B) as well as that obtained with flow dialysis (15).
The X-ray structure of the C154G mutant with bound TDG (PDB ID: 1PV7) and wild-type LacY are in an inward-facing conformation. However the KD ligand is the same on both sides of the membrane within experimental error (28). The rate constants estimated from stopped flow (kon = 4.3 × 10⁶ M-1 s-1; koff = 162 s-1) are considerably faster than the turnover number for LacY (30-50 s-1) (29). The sugar-binding site in LacY is exposed only to the cytoplasmic side of the molecule, and the periplasmic side is completely blocked (3, 4, 9). Therefore, although the results presented here might be interpreted superficially to indicate that accessibility of the binding site is not a rate-limiting step in the transport mechanism, these experiments were carried out in detergent where accessibility to the sugar-binding site is not a consideration. Therefore, if the inward-facing conformation is the lowest free energy conformation of LacY in the membrane, it is possible that accessibility of the binding site to the periplasmic side of the membrane is rate limiting for transport.
V331C LacY labeled with MIANS at Cys331 is a model for studying the effect of a sugar-induced conformational change. The residues in LacY involved in galactopyranoside-specific binding are located within the N-terminal 6-helix bundle and Cys331 is on helix X in the C-terminal 6-helix bundle, which contains several amino acid residues required for H+ translocation. Stopped-flow measurements of fluorescence changes induced by α-NPG with MIANS-labeled V331C LacY provide a unique opportunity to measure rates of binding (Trp→α-NPG FRET), as well as rates of conformational change reflected by MIANS in the same protein sample. It is noteworthy that rates of binding measured by Trp→αNPG FRET (k1obs) vary linearly with sugar concentration for unmodified and MIANS-labeled LacY (Fig. 8A and 5A). The calculated kon for MIANS-labeled protein is about 3-times lower compared with unmodified protein, which alters α-NPG affinity proportionally, since koff is similar in both cases. A reasonable explanation is that modification of V331C by MIANS positions the bulky fluorophore in the vicinity of the inward facing cavity, thereby limiting access of ligand to the binding site. The hyperbolic dependence of the change in MIANS fluorescence on α-NPG concentration (k2obs) is a strong indication that relatively rapid formation of the protein-sugar complex is followed by a slower conformational change (27). Moreover, it is likely that the sugar-induced change in MIANS fluorescence is related to the global conformational change that occurs during transport, since the phenomenon occurs much more rapidly in the absence of the C154G mutation (I.N.S., V.N.K. & H.R.K., unpublished observations).
Finally, the findings presented here are consistent with recent observations regarding the thermodynamics of ligand-induced changes in the conformation of wild-type and C154G LacY as studied by isothermal calorimetry (Y. Nie, I. Smirnova, V. Kasho & H.R. Kaback, submitted for publication). The change in free energy upon α-NPG binding is similar for wild-type LacY or the C154G mutant. However, with the wild type, the change in free energy upon binding is due primarily to an increase in entropy, while in marked contrast, an increase in enthalpy is solely responsible for the change in free energy in the mutant. Thus, wild-type LacY behaves as if there are multiple ligand-bound conformational states, while the mutant is severely restricted.
Supplementary Material
Acknowledgments
We are indebted to Tatsushi Toyokuni and Paula Guanawan for synthesizing Dns6Gal.
Abbreviations
- LacY
lactose/H+ symporter from Escherichia coli
- DDM
dodecyl-β-d-maltopyranoside
- TDG
β-d-galactopyranosyl-1-thio-β-d-galactopyranoside
- α–NPG
4–nitrophenyl-α-d-galactopyranoside
- ortho-NPG
2–nitrophenyl-α-d-galactopyranoside
- NPGlc
4–nitrophenyl-α-d-glucopyranoside
- Dns6Gal
6’-(N-dansyl)aminohexyl-1-thio-β-d-galactopyranoside
- MIANS
2-(4’-maleimidylanilino)naphthalene-6-sulfonic acid (sodium salt)
- FRET
Förster resonance energy transfer
- R0
Förster distance
Footnotes
This work was supported by NIH grants DK051131 and DK069463 to H.R.K.
References
- 1.Saier MH, Jr, Beatty JT, Goffeau A, Harley KT, Heijne WH, Huang SC, Jack DL, Jahn PS, Lew K, Liu J, Pao SS, Paulsen IT, Tseng TT, Virk PS. The major facilitator superfamily. J Mol Microbiol Biotechnol. 1999;1:257–79. [PubMed] [Google Scholar]
- 2.Kaback HR, Sahin-Toth M, Weinglass AB. The kamikaze approach to membrane transport. Nat Rev Mol Cell Biol. 2001;2:610–20. doi: 10.1038/35085077. [DOI] [PubMed] [Google Scholar]
- 3.Guan L, Kaback HR. Lessons from Lactose Permease. Annu Rev Biophys Biomol Struct. 2006;35:67–91. doi: 10.1146/annurev.biophys.35.040405.102005. [DOI] [PMC free article] [PubMed] [Google Scholar]
- 4.Abramson J, Smirnova I, Kasho V, Verner G, Kaback HR, Iwata S. Structure and mechanism of the lactose permease of Escherichia coli. Science. 2003;301:610–5. doi: 10.1126/science.1088196. [DOI] [PubMed] [Google Scholar]
- 5.Guan L, Hu Y, Kaback HR. Aromatic stacking in the sugar binding site of the lactose permease. Biochemistry. 2003;42:1377–1382. doi: 10.1021/bi027152m. [DOI] [PubMed] [Google Scholar]
- 6.Vazquez-Ibar JL, Guan L, Svrakic M, Kaback HR. Exploiting luminescence spectroscopy to elucidate the interaction between sugar and a tryptophan residue in the lactose permease of Escherichia coli. Proc Natl Acad Sci U S A. 2003;100:12706–11. doi: 10.1073/pnas.1835645100. [DOI] [PMC free article] [PubMed] [Google Scholar]
- 7.Vazquez-Ibar JL, Guan L, Weinglass AB, Verner G, Gordillo R, Kaback HR. Sugar Recognition by the Lactose Permease of Escherichia coli. J Biol Chem. 2004;279:49214–21. doi: 10.1074/jbc.M407408200. [DOI] [PubMed] [Google Scholar]
- 8.Weinglass A, Whitelegge JP, Faull KF, Kaback HR. Monitoring Conformational Rearrangements in the Substrate-binding Site of a Membrane Transport Protein by Mass Spectrometry. J Biol Chem. 2004;279:41858–65. doi: 10.1074/jbc.M407555200. [DOI] [PubMed] [Google Scholar]
- 9.Mirza O, Guan L, Verner G, Iwata S, Kaback HR. Structural evidence for induced fit and a mechanism for sugar/H(+) symport in LacY. Embo J. 2006 doi: 10.1038/sj.emboj.7601028. [DOI] [PMC free article] [PubMed] [Google Scholar]
- 10.Rudnick G, Schuldiner S, Kaback HR. Equilibrium between two forms of the lac carrier protein in energized and nonenergized membrane vesicles from Escherichia coli. Biochemistry. 1976;15:5126–5131. doi: 10.1021/bi00668a028. [DOI] [PubMed] [Google Scholar]
- 11.Wu J, Frillingos S, Voss J, Kaback HR. Ligand-induced conformational changes in the lactose permease of Escherichia coli: evidence for two binding sites. Protein Sci. 1994;3:2294–301. doi: 10.1002/pro.5560031214. [DOI] [PMC free article] [PubMed] [Google Scholar]
- 12.Frillingos S, Kaback HR. Probing the conformation of the lactose permease of Escherichia coli by in situ site-directed sulfhydryl modification. Biochemistry. 1996;35:3950–3956. doi: 10.1021/bi952601m. [DOI] [PubMed] [Google Scholar]
- 13.Sahin-Tóth M, Karlin A, Kaback HR. Unraveling the mechanism of lactose permease of Escherichia coli. Proc Natl Acad Sci USA. 2000;97:10729–10732. doi: 10.1073/pnas.200351797. [DOI] [PMC free article] [PubMed] [Google Scholar]
- 14.le Coutre J, Whitelegge JP, Gross A, Turk E, Wright EM, Kaback HR, Faull KF. Proteomics on full-length membrane proteins using mass spectrometry. Biochemistry. 2000;39:4237–42. doi: 10.1021/bi000150m. [DOI] [PubMed] [Google Scholar]
- 15.Smirnova IN, Kaback HR. A Mutation in the Lactose Permease of Escherichia coli That Decreases Conformational Flexibility and Increases Protein Stability. Biochemistry. 2003;42:3025–31. doi: 10.1021/bi027329c. [DOI] [PubMed] [Google Scholar]
- 16.Ermolova NV, Smirnova IN, Kasho VN, Kaback HR. Interhelical packing modulates conformational flexibility in the lactose permease of Escherichia coli. Biochemistry. 2005;44:7669–77. doi: 10.1021/bi0502801. [DOI] [PubMed] [Google Scholar]
- 17.Venkatesan P, Kaback HR. The substrate binding site in the lactose permease of Escherichia coli. Proc Natl Acad Sci USA. 1998;95:9802–9807. doi: 10.1073/pnas.95.17.9802. [DOI] [PMC free article] [PubMed] [Google Scholar]
- 18.Schuldiner S, Kerwar GK, Kaback HR, Weil R. Energy-dependent binding of dansylgalactosides to the b-galactoside carrier protein. J Biol Chem. 1975;250:1361–70. [PubMed] [Google Scholar]
- 19.Peterman BF. Measurement of the dead time of a fluorescence stopped-flow instrument. Anal Biochem. 1979;93:442–4. doi: 10.1016/s0003-2697(79)80176-1. [DOI] [PubMed] [Google Scholar]
- 20.Wu P, Brand L. Resonance energy transfer: methods and applications. Anal Biochem. 1994;218:1–13. doi: 10.1006/abio.1994.1134. [DOI] [PubMed] [Google Scholar]
- 21.Puchalski MM, Morra MJ, von Wandruszka R. Assessment of corrections for the inner filter effect in fluorimetry. Fresenius J Anal Chem. 1991;340:341–344. [Google Scholar]
- 22.Sahin-Tóth M, Akhoon KM, Runner J, Kaback HR. Ligand recognition by the lactose permease of Escherichia coli: specificity and affinity are defined by distinct structural elements of galactopyranosides. Biochemistry. 2000;39:5097–5103. doi: 10.1021/bi0000263. [DOI] [PubMed] [Google Scholar]
- 23.Sahin-Tóth M, Lawrence MC, Nishio T, Kaback HR. The C-4 hydroxyl group of galactopyranosides is the major determinant for ligand recognition by the lactose permease of Escherichia coli. Biochemistry. 2001;43:13015–13019. doi: 10.1021/bi011233l. [DOI] [PubMed] [Google Scholar]
- 24.Menick DR, Sarkar HK, Poonian MS, Kaback HR. Cys154 is important for lac permease activity in Escherichia coli. Biochem Biophys Res Commun. 1985;132:162–170. doi: 10.1016/0006-291x(85)91002-2. [DOI] [PubMed] [Google Scholar]
- 25.van Iwaarden PR, Driessen AJ, Lolkema JS, Kaback HR, Konings WN. Exchange, efflux, and substrate binding by cysteine mutants of the lactose permease of Escherichia coli. Biochemistry. 1993;32:5419–5424. doi: 10.1021/bi00071a017. [DOI] [PubMed] [Google Scholar]
- 26.Sahin-Tóth M, Gunawan P, Lawrence MC, Toyokuni T, Kaback HR. Binding of hydrophobic D-galactopyranosides to the lactose permease of Escherichia coli. Biochemistry. 2002;41:13039–45. doi: 10.1021/bi0203076. [DOI] [PubMed] [Google Scholar]
- 27.Fersht A. Structure and mechanism in protein science : a guide to enzyme catalysis and protein folding. W.H Freeman; New York: 1999. [Google Scholar]
- 28.Guan L, Kaback HR. Binding affinity of lactose permease is not altered by the H+ electrochemical gradient. Proc Natl Acad Sci U S A. 2004;101:12148–52. doi: 10.1073/pnas.0404936101. [DOI] [PMC free article] [PubMed] [Google Scholar]
- 29.Viitanen P, Garcia ML, Kaback HR. Purified reconstituted lac carrier protein from Escherichia coli is fully functional. Proc Natl Acad Sci USA. 1984;81:1629–33. doi: 10.1073/pnas.81.6.1629. [DOI] [PMC free article] [PubMed] [Google Scholar]
Associated Data
This section collects any data citations, data availability statements, or supplementary materials included in this article.


